MNI EUROPEAN MARKETS ANALYSIS: Carney's Liberals Win Election
- Headlines crossed that Trump will provide auto tariff relief, but market sentiment hasn't shifted much. There has been no cash Tsy trading today with Japan markets out. The USD index is higher but largely holding onto Monday losses.
- CTV has said that PM Carney will hold government following elections but again it will be a minority government.
- Shipping rates have been trending lower since mid-2024 as threats to Red Sea shipping dissipated and much of the related jump has now been unwound. They have taken another leg down since January this year though, as threats to global trade volumes from US tariffs weigh on prices charged.
- Later US April consumer confidence, March merchandise trade, JOLTS job openings, inventories and February house prices print, as well as the April European Commission survey, Spanish Q1 GDP and preliminary April CPI. The ECB’s Cipollone and Donnery speak.
MARKETS
US TSYS: Asia Wrap - Futures Slightly Lower
TYM5 has traded a little lower with a range of 111-26 to 111.30+ during the Asia-Pacific session. It last changed hands at 111-27+, down 0-01 from the previous close. No Cash trading today with Japan out.
- Bloomberg- “Treasury Secretary Scott Bessent's debt-management team is expected to keep plans for sales of longer-dated securities steady, despite recent market swings.”
- “The quarterly supply announcement will set the size of upcoming auctions, including 3-, 10-, and 30-year maturities, and may provide guidance on debt-limit considerations.”
- “Despite having criticized his predecessor Janet Yellen for tilting US debt toward short-dated Treasuries, Bessent since taking office in January has said the department is “a long way” from replacing them with longer-term debt.”
- Microsoft and Meta will headline earnings on Wednesday, followed by Apple, Amazon, and Eli Lilly on Thursday, these reports should hopefully provide the market with some clarity and will dictate whether this bounce in risk is able to continue or falter.
- The 10-year Yield, has put in a lower high around 4.40% and has broken through the recent support around 4.25%. The next support is towards the 4.10 area which should find supply once more as the market will continue to look for higher term premium while uncertainty remains elevated.
- Data/Events : US GDP, ISM Manufacturing, NFM payrolls the main events this week.
GLOBAL MACRO: Shipping Rates Trending Lower Over 2025 As Trade Worries Grow
Shipping rates have been trending lower since mid-2024 as threats to Red Sea shipping dissipated and much of the related jump has now been unwound. They have taken another leg down since January this year though, as threats to global trade volumes from US tariffs weigh on prices charged. Since US reciprocal trade duties were announced on April 2, various shipping rate indices are mixed though.
- The Baltic Dry Index (BDI) is down 11.4% since April 2 and the average is -11.6% m/m & -21.9% y/y in April.
- February global IP rose 0.7% m/m, the 10th non-negative reading in the last year, to be up 2.9% y/y, the fastest since October 2022. Global trade growth has been trending up for the last year and was 3.0% y/y in February. However, both could slow going forward given that the BDI has been trending lower over the last year and can be a leading indicator.
Global trade vs Baltic Freight Index

- The FBX container rate is down 6.5% m/m & 15.9% y/y in April but actually up 0.7% since April 2 driven by an 8.3% increase in the China/East Asia to Mediterranean route, but this reflects some normalisation after the sharp drop on April 1 and it is still down almost 20% m/m on average in April to be 33.1% lower on a year ago.
- Given the tit-for-tat tariff increases between the US and China, it is not surprising that FBX container rate for China/East Asia to the east coast of North America is now 6.2% lower compared to April 2. The April average is little changed on the month but down 18.8% y/y.
- With shipping rates down double digits compared to a year ago and levels subdued, they are likely to provide some disinflationary pressure but container rates are still higher than end-2023 with the FBX up 52.1%, while BDI is now 33% lower.
Global FBX container rates US$/points

CANADA: Minority Liberal Government Likely, CAD Gives Up Earlier Gains
CTV has said that PM Carney will hold government following elections but again it will be a minority government. Elections Canada has allocated 341 of the 343 districts with Carney’s Liberals leading in 157 with 43.3% of the vote and so even they win the remaining 2 seats will be short of the 172 needed for a majority. It does look like they will hold more than the 151 they had in the last parliament though.
- The Conservatives are leading in 148 (41.3%) gaining 28 but not enough to take government. The major parties benefited from a swing away from smaller ones with Bloc Quebecois, New Democrats and the Greens likely to hold fewer districts.
- The Canadian dollar strengthened against the greenback when Canadian networks called the election for Carney signalling stability in the fight against US tariffs, however it has now given up those gains as the US dollar has broadly strengthened again (BBDXY +0.2%). USDCAD fell to 1.3809 but is now up 0.2% on the day to 1.3855.
AUSSIE BONDS: Subdued Session Ahead Of Q1 CPI
ACGBs (YM -1.0 & XM -2.5) are weaker but near the middle of the ranges of today’s Sydney session on a data-light day.
- No cash US tsys trading in Asia-Pac today, with Japan out. TYM5 is trading at 111-27+, -0-01+ from closing levels.
- Cash ACGBs are 1-2bps cheaper.
- The bills strip is flat to -1 across contracts.
- Global foreign exchange markets recorded a “sharp rise” in volatility earlier this month as traders worked through the potential impact of US tariff announcements, before becoming “more settled” in recent days, according to Reserve Bank of Australia Assistant Governor Christopher Kent. (per BBG)
- RBA-dated OIS pricing is little changed across meetings today. A 50bp rate cut in May is given a 12% probability, with a cumulative 117bps of easing priced by year-end.
- Tomorrow, the local data calendar will see Q1 CPI. It is forecast to show the RBA's preferred trimmed mean falling below the top of the 2-3% target band for the first time since Q4 2021. This should signal another 25bp cut on May 20. Retail sales are on Friday. The Federal Election is on Saturday.
- The AOFM plans to sell A$1200mn of the 2.75% 21 June 2035 bond on Friday.
AUSTRALIA: Consensus Expects Q1 Core Inflation Returned To Band
Q1 CPI prints on Wednesday and will be an important input into the May 20 RBA decision. With headline numbers continuing to be impacted by government electricity rebates possibly until the end of the year if Labor wins Saturday’s federal election, the focus will remain on the underlying trimmed mean. Consensus expects it to fall below the top of the 2-3% RBA target band for the first time since Q4 2021, which would likely mean another 25bp rate cut next month.
- Consensus is forecasting trimmed mean to rise 0.6% q/q & 2.8% y/y in Q1 after 0.5% & 3.2% in Q4. Projections are in a fairly narrow range of 0.6% to 0.8% q/q and 2.8% to 3.0% y/y. Of the major local banks, CBA, NAB and Westpac are in line with consensus, while ANZ is higher at 0.7% & 2.9%.
- Services will continue to be watched closely but monthly data suggest it moderated in Q1. It moderated 0.3pp to 4.3% y/y in Q4 but core services increased 0.1pp to 4.2% y/y. January/February data suggest headline services may have eased to around 3.6% y/y.
- Q1 headline inflation is projected to rise 0.8% q/q and 2.3% y/y, which is a significant quarterly rise from Q4’s 0.2% but a slight drop in the annual pace from 2.4%. Forecasts are between 0.6% and 0.9% q/q and 2.1% and 2.4% y/y. CBA and NAB are in line with consensus, while Westpac is lower at 0.7% q/q and ANZ higher at 0.9% q/q.
- Data for March are also released with Bloomberg consensus forecasting a 0.2pp moderation in headline to 2.2% but projections are in a wide range of 2.0-2.6%. Trimmed mean was 2.7% in February.
BONDS: NZGBS: Closed At Session Cheaps, Labour Demand & House Lending Up
NZGBs closed near session cheaps, with benchmark yields 3-4bps higher.
- No cash US tsys trading in Asia-Pac today, with Japan out. TYM5 is trading at 111-27+, -0-01+ from closing levels
- Filled jobs rose 0.2% m/m in March but are still down 1.5% y/y after being flat and down 1.6% y/y in February. However, the 3-month annualised rate at 0.4% turned positive for the first time since April 2024, signalling that Q1 employment may be flat to slightly higher on the quarter when labour market data is released on May 7.
- Labour demand remains weak but shows some tentative signs that it has begun to gradually recover. 3-month momentum is improving for filled jobs and also SEEK job ads, which rose 8.7% annualised in March.
- The RBNZ’s residential mortgage lending data showed lending to all borrowers at its highest since November 2011. First-home buyers up 24% y/y.
- Swap rates closed flat to 1bp higher.
- RBNZ dated OIS pricing closed showing 27bps of easing priced for May, with a cumulative 82bps by November 2025.
- Tomorrow, the local calendar will see ANZ Business Confidence.
- On Thursday, the NZ Treasury plans to sell NZ$250mn of the 4.50% May-30 bond, NZ$150mn of the 4.25% May-34 bond and NZ$50mn of the 5.00% May-54 bond.
NEW ZEALAND: Nascent Signs Labour Market Recovering
Filled jobs rose 0.2% m/m in March but are still down 1.5% y/y after being flat and down 1.6% y/y in February. However, the 3-month annualised rate at 0.4% turned positive for the first time since April 2024, signalling that Q1 employment may be flat to slightly higher on the quarter when labour market data is released on May 7.
NZ employment q/q%

- Labour demand remains weak but is showing some tentative signs that it has begun to gradually recover. 3-month momentum is improving for filled jobs and also SEEK job ads which rose 8.7% annualised in March. While vacancies are still down 15.4% y/y, they are off the low of -34.8% in June.
- SEEK applicants/job index shows that labour supply remains robust. It rose in the 3 months to February and was up 31.3% y/y with 3-month momentum annualised at almost 19%.
- The increase in March filled jobs was broad based across sectors with primary rising 0.4% m/m, goods-producing +0.1% and services +0.2%. Construction has taken the brunt of labour shedding over the last year down 6.1% y/y followed by admin & support services -5.7% and manufacturing -2.2%, while health care is up 1.7% y/y.
- Young people have seen the largest losses with filled jobs of 15-19 year olds down 10% y/y, while for 35-39 years they’re up 2.2% y/y.
NZ filled jobs vs SEEK job ads

FOREX G10 Wrap - USD Can’t Hold Onto Gains
The BBDXY has had an Asian range of 1219.50 - 1222.42, Asia is currently trading around 1223. Spain is still searching for answers for Monday's Blackouts, the EU said there are no indications of a cyber attack. Bloomberg - “ Olli Rehn said there’s a danger that inflation will dip below the 2% target and that the euro’s strength has added “further complexity” to policy.”
- EUR/USD - Asian range 1.1374 - 1.1422, Asia is currently trading 1.1382. Intra-day support is around 1.1300, should this area not hold demand should remerge on dips back to 1.1100.
- GBP/USD - Asian range 1.3397 - 1.3444, the GBP continues to lead higher, testing decent Weekly resistance now around 1.3500.
- USD/JPY - Asian range 142.00 - 142.58, has drifted higher for most of the Asia session. On the day the 143 handle should once again offer supply, then more importantly the 145/146 area should once more offer good levels for sellers to reengage.
- USD/CNH - Asian range 7.2692 - 7.2887, the USD/CNY fix printed lower again at 7.2029. Bloomberg - “The yuan was boosted by a report that China vowed to comprehensively rectify all kinds of unreasonable regulations and practices that restrict market access.” This saw USD/CNH break below the 7.2800 support which contributed to sudden spikes in both the AUD and NZD.
- USD/CAD - Asian range 1.3809 - 1.3867, currently trading 1.3860. Canada’s Liberal Party wins the election too soon to know if it's by a majority. Bounces back to 140.00 should find sellers first up.
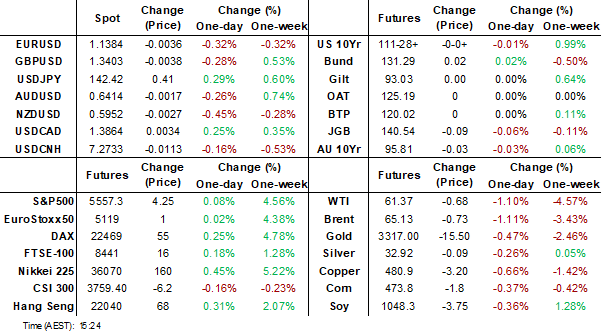
- Cross asset : SPX +0.21%, Gold 3317, US TYM5 111-27+, BBDXY 1222, Crude oil 61.60.
- Data/Events : Spain GDP & CPI, ECB CPI expectations, Germany consumer confidence
Fig 1 : GBP/USD Spot Weekly Chart

Source: MNI - Market News/Bloomberg
FOREX: Antipodean Wrap - AUD & NZD Drift Sideways
A very quiet session in Asia today, risk trading slightly better as stocks hold onto their late bounce in the US. (Bloomberg) -- “Global foreign exchange markets recorded a “sharp rise” in volatility earlier this month as traders worked through the potential impact of US tariff announcements, before becoming “more settled” in recent days, according to Reserve Bank of Australia Assistant Governor Christopher Kent. Kent didn’t comment on what the tariffs meant for Australia’s economy or the nation’s monetary policy outlook.”
- AUD/USD - Asian range 0.6415 - 0.6450, After a very quick spike up to 0.6450 the Aud has just as quickly fallen back towards the 0.6415 area. Dips back to the 0.6250/0.6300 area should continue to find demand while the market continues to focus on a lower USD.
- AUD/JPY - Asian range 91.24 - 91.68. Price goes into the London trading around 91.35, still within the last 11 days range of 0.8950/0.9200.
- NZDUSD - Asian range 0.5951 - 0.5987, going into London trading around 0.5951. Demand should return first around 0.5900, then around the 0.5850 area.
- AUD/NZD - Asian range 1.0748 - 1.0785, the cross has continued to drift higher in the Asian session. Watch for supply to return on any bounce back towards the 1.0800/50 area.
Fig 1 : AUD/JPY Spot Hourly Chart

Source: MNI - Market News/Bloomberg
ASIA STOCKS: A Modest but Broadly Positive Day Across Asia.
As President Trump is now indicating that he will reduce the expected tariffs on autos, Asian equities performed well today with Korea’s auto stocks up over +2.5% giving the KOSPI a boost.
China’s major bourses did very little in what seemed like a directionless day despite the positive headline.
- The Hang Seng rose just +0.12% today despite a broader regionally positive day whilst the CSI 300 fell -0.13%. Shanghai Comp was down -0.03% and Shenzhen held onto modest gains of +0.35%
- The KOSPI delivered strong gains of +0.51%, led by the auto sector and delivering three successive days of gains.
- The FTSE Malay KLCI went the other way falling -0.15% after yesterday’s strong gains.
- In Indonesia the Jakarta Composite’s good run continues eking out a gain of +0.50% for sixth successive day of gains
- Singapore’s FTSE Straits Times was up +0.25% whilst the PSEi in the Philippines was down marginally -0.06%.
- India’s NIFTY 50 opened marginally positive trying to follow on from yesterday’s strong gains of +1.20% having taken back the losses from earlier in the month to be back at year to date highs.
ASIA STOCKS: Strong Inflows for Taiwan and India
The ongoing theme of outflows has showed signs of abating with Taiwan and India enjoying yet another day of strong inflows.
- South Korea: Recorded outflows of -$100m as of yesterday, bringing the 5-day total to +$92m. 2025 to date flows are -$12,672m. The 5-day average is +$18m, the 20-day average is -$368m and the 100-day average of -$148m.
- Taiwan: Had inflows of +$211m as of yesterday, with total inflows of +$1,417m over the past 5 days. YTD flows are negative at -$18,621. The 5-day average is +$283m, the 20-day average of -$111m and the 100-day average of -$208m.
- India: Had inflows of +$589m as of the 25th, with total inflows of +$2,124m over the past 5 days. YTD flows are negative -$12,857m. The 5-day average is +$425m, the 20-day average of +$128m and the 100-day average of -$123m.
- Indonesia: Had outflows of -$11m as of Friday, with total outflows of -$38m over the prior five days. YTD flows are negative -$3,073m. The 5-day average is -$8m, the 20-day average -$61m and the 100-day average -$39m
- Thailand: Recorded outflows of -$32m as of yesterday, outflows totaling -$232m over the past 5 days. YTD flows are negative at -$1,722m. The 5-day average is -$46m, the 20-day average of -$31m the 100-day average of -$21m.
- Malaysia: Recorded inflows of +$31m as of yesterday, totaling +$130m over the past 5 days. YTD flows are negative at -$2,746m. The 5-day average is +$26m, the 20-day average of -$30m and the 100-day average of -$37m.
- Philippines: Saw inflows of +$4m as of yesterday, with net inflows of +$2m over the past 5 days. YTD flows are negative at -$286m. The 5-day average is $0m, the 20-day average of -$5m the 100-day average of -$4m.

OIL: Crude Continues Sell Off During APAC Trading Following Dallas Fed Drop
Oil prices continued declining during today’s APAC session. They fell on Monday with the sharp drop in the Dallas Fed manufacturing index adding to fears that trade agreements wouldn’t be reached with the US. WTI is 0.9% lower to $61.50/bbl, close to the intraday trough, while Brent is down 0.8% to $65.33/bbl. The USD index is up 0.3% which is also likely weighing on dollar-denominated crude.
- Oil’s reaction to the Dallas Fed data puts other releases this week, including GDP, ISM/PMIs and payrolls, even more in the spotlight. Signs that there was weakening in April, the reciprocal tariffs were announced April 2, would likely drive a further sell off as crude has been particularly worried about the impact of increased protectionism on global energy demand.
- China retaliated to US tariffs and while the US says that it is negotiating with it, China continues to deny that talks are taking place. Instead it has promised support for exporters and the economy and threatened others if they impact it negatively to gain favour with the US and warned against giving in to American “bullying”. China is the world’s largest oil importer.
- The supply side remains in focus with OPEC meeting on May 5 and the prospect of successful US-Iran talks resulting in an easing of sanctions. Also, US industry-based inventory data are released today.
- Later US April consumer confidence, March merchandise trade, JOLTS job openings, inventories and February house prices print, as well as the April European Commission survey, Spanish Q1 GDP and preliminary April CPI. The ECB’s Cipollone and Donnery speak.
Gold Gives Back Overnight Gains
- Gold finished the US trading session higher by +0.73% at YS$3,343.98, having been as low as $3,268.23 earlier in the day yet couldn’t hold onto those gains during the Asian trading day dropping back to $3,314.40.
- The overnight move had been supported by a weaker USD and weaker than expected data.
- The Dallas Fed. Manufacturing Activity fell to its lowest in 5 years with survey respondents showing executives describing the current situation as chaos as supply line disruptions decimate activity.
- This has reduced expectations for Wednesday’s data which sees employment data, inflation and growth.
- Gold had started the week in the Asian trading session on the back foot, trending downwards before the Texas data which has refocused attention on the possibility that already the trade war may be showing up in US data.
CHINA: April PMI to Show Trade War Impact
- China’s EPMI Index has fallen sharply in April possibly pointing to things to come for China’s PMI out tomorrow.
- The EPMI Index is a barometer for China’s high-tech sectors and a good leading indicator for China PMIs
- With March’s release being an outsized release of 59.6; April’s early release ahead of the PMI fell sharply to 49.4.
- The index is a survey of 280 companies across seven major (high tech) industries and provide a useful snapshot for the state of the economy given the focus on high tech (per BBG).
- The official Manufacturing and Non- Manufacturing PMI is released tomorrow for April as well as the CAIXIN PMI for Manufacturing and Non-Manufacturing and are compiled by the National Bureau of Statistics, typically includes a larger sample of enterprises.
- Conversely, the Caixin PMI, sponsored by Caixin Global, focuses on a more representative sample of smaller, privately-owned firms and medium-sized companies.
- Official PMI’s for March improved marginally from February as the effects of the Lunar New Year holidays started to wane.
- The CAIXIN PMI’s for March improved also with CAIXIN PMI Services pointing to a strong period for private owned firms engaged in the private sector.
- Tomorrow's release has the potential to show the impact of the trade war flowing through to activity with the PMI manufacturing expected for both anticipated to decline whilst the strength in services, particularly in the private sector, is forecast to continue.
Fig 1: China Emerging Industries PMI Versus Official Manufacturing PMI
Source: MNI - Market News/Bloomberg
UP TODAY (TIMES GMT/LOCAL)
| Date | GMT/Local | Impact | Country | Event |
| 29/04/2025 | 0600/0800 | * | GFK Consumer Climate | |
| 29/04/2025 | 0600/0800 | ** | Private Sector Production m/m | |
| 29/04/2025 | 0600/0800 | Flash Quarterly GDP Indicator | ||
| 29/04/2025 | 0600/0800 | ** | Retail Sales | |
| 29/04/2025 | 0700/0900 | ** | Economic Tendency Indicator | |
| 29/04/2025 | 0700/0900 | *** | HICP (p) | |
| 29/04/2025 | 0700/0900 | *** | GDP (p) | |
| 29/04/2025 | 0700/0900 | ECB's Cipollone On Financial and Trade Fragmentation | ||
| 29/04/2025 | 0800/1000 | ** | M3 | |
| 29/04/2025 | 0800/1000 | ** | ISTAT Consumer Confidence | |
| 29/04/2025 | 0800/1000 | ** | ISTAT Business Confidence | |
| 29/04/2025 | 0800/1000 | ** | ECB Consumer Expectations Survey | |
| 29/04/2025 | 0900/1100 | * | Consumer Confidence, Industrial Sentiment | |
| 29/04/2025 | 0900/1000 | * | Index Linked Gilt Outright Auction Result | |
| 29/04/2025 | 0940/1040 | BOE Ramsden At Innovate Finance Global Summit | ||
| 29/04/2025 | 1230/0830 | ** | Advance Trade, Advance Business Inventories | |
| 29/04/2025 | 1255/0855 | ** | Redbook Retail Sales Index | |
| 29/04/2025 | 1300/0900 | ** | S&P Case-Shiller Home Price Index | |
| 29/04/2025 | 1300/0900 | ** | FHFA Home Price Index | |
| 29/04/2025 | 1300/0900 | ** | FHFA Home Price Index | |
| 29/04/2025 | 1400/1000 | *** | Conference Board Consumer Confidence | |
| 29/04/2025 | 1400/1000 | *** | JOLTS jobs opening level | |
| 29/04/2025 | 1400/1000 | *** | JOLTS quits Rate | |
| 29/04/2025 | 1430/1030 | ** | Dallas Fed Services Survey | |
| 30/04/2025 | - | Bank of Japan Meeting | ||
| 30/04/2025 | 2350/0850 | * | Retail Sales (p) | |
| 30/04/2025 | 2350/0850 | ** | Industrial Production | |
| 30/04/2025 | 0130/0930 | *** | CFLP Manufacturing PMI | |
| 30/04/2025 | 0130/0930 | ** | CFLP Non-Manufacturing PMI | |
| 30/04/2025 | 0130/1130 | *** | CPI inflation | |
| 30/04/2025 | 0130/1130 | *** | CPI Inflation Monthly | |
| 30/04/2025 | 0145/0945 | ** | S&P Global Final China Manufacturing PMI | |
| 30/04/2025 | 0530/0730 | *** | GDP (p) | |
| 30/04/2025 | 0530/0730 | ** | Consumer Spending | |
| 30/04/2025 | 0600/0800 | ** | Import/Export Prices | |
| 30/04/2025 | 0600/0800 | ** | Retail Sales | |
| 30/04/2025 | 0600/1400 | ** | MNI China Money Market Index (MMI) | |
| 30/04/2025 | 0645/0845 | *** | HICP (p) | |
| 30/04/2025 | 0645/0845 | ** | PPI | |
| 30/04/2025 | 0700/0900 | ** | KOF Economic Barometer | |
| 30/04/2025 | 0755/0955 | ** | Unemployment | |
| 30/04/2025 | 0800/1000 | *** | GDP (p) | |
| 30/04/2025 | 0800/1000 | *** | GDP (p) | |
| 30/04/2025 | 0800/1000 | *** | Bavaria CPI | |
| 30/04/2025 | 0800/1000 | *** | North Rhine Westphalia CPI | |
| 30/04/2025 | 0800/1000 | *** | Baden Wuerttemberg CPI | |
| 30/04/2025 | 0900/1100 | *** | HICP (p) | |
| 30/04/2025 | 0900/1000 | ** | Gilt Outright Auction Result | |
| 30/04/2025 | 0900/1100 | *** | EMU Preliminary Flash GDP Q/Q | |
| 30/04/2025 | 0900/1100 | *** | EMU Preliminary Flash GDP Y/Y | |
| 30/04/2025 | 1000/1200 | ** | PPI | |
| 30/04/2025 | 1100/0700 | ** | MBA Weekly Applications Index | |
| 30/04/2025 | 1200/1400 | *** | HICP (p) | |
| 30/04/2025 | 1215/0815 | *** | ADP Employment Report | |
| 30/04/2025 | 1230/0830 | *** | Gross Domestic Product by Industry | |
| 30/04/2025 | 1230/0830 | *** | GDP | |
| 30/04/2025 | 1230/0830 | *** | Employment Cost Index | |
| 30/04/2025 | 1230/0830 | *** | Gross Domestic Product by Industry | |
| 30/04/2025 | 1230/0830 | *** | Treasury Quarterly Refunding | |
| 30/04/2025 | 1342/0942 | *** | MNI Chicago PMI |