EM ASIA CREDIT: MNI EM Credit Market Wrap - Asia
** The main stories out of the region**
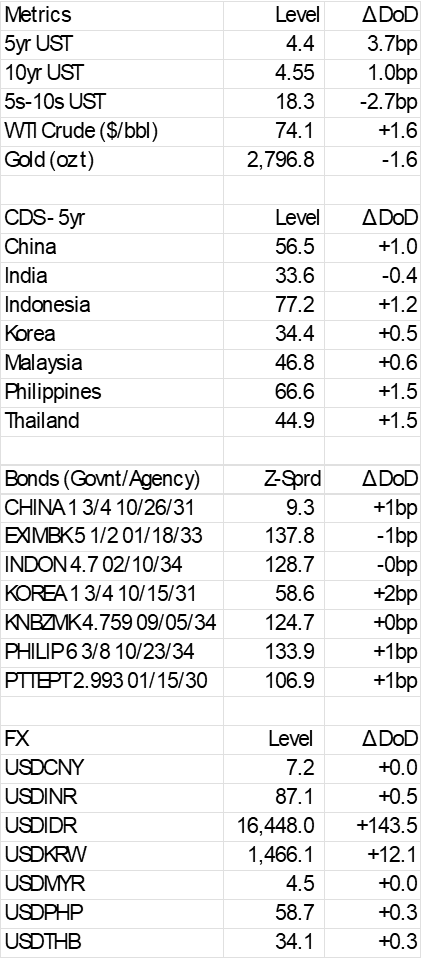
The Asia market session ends on a weak footing. Higher tariffs, announced by the U.S. government, on Canada, Mexico and China are expected to have wide ranging implications beyond the current targets. Export driven emerging market countries, including in Asia, are rightly concerned that this is just the beginning. On the back of this, Asia emerging market $ bonds were wider today, a move also reflected in the sovereign CDS (5yr, 1-2bp wider).
In terms of newsflow, still no new issuance, but I imagine there will be some interesting go/no-go calls between syndicate desks and potential issuers for those not already in blackout.
In terms of results, Vedanta reported Q3 numbers ahead of consensus, and managed to keep driving leverage lower (1.7x to 1.4x YoY) - positive for spreads. Korean steel maker, Posco Holdings, reported Q4 numbers weaker than consensus, as lower steel prices and margins impacted profitability - negative for spreads. Finally, LG Chem reported a relatively large operating loss (KRW252bn), well short of market estimates - negative for spreads.
Best and Worst Performers (zsprd, bp)
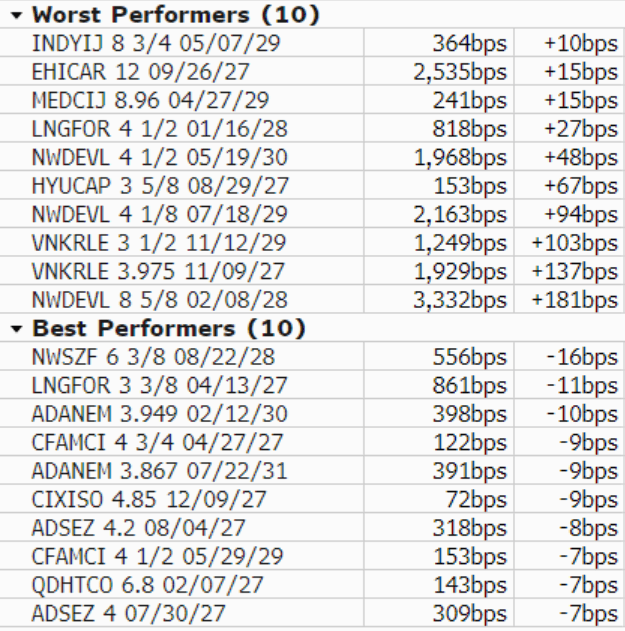
Source: Bloomberg
Want to read more?
Find more articles and bullets on these widgets:
Historical bullets
JGB TECHS: (H5) Returns Lower
- RES 3: 149.55 - High Mar 22 (cont)
- RES 2: 147.74 - High Jan 15 and bull trigger (cont)
- RES 1: 144.48/146.53 - High Nov 11 / High Aug 6
- PRICE: 142.12 @ 15:01 GMT Jan 03
- SUP 1: 141.65 - Low Dec 30
- SUP 2: 141.56 - 1.764 proj of the Aug 6 - Sep 3 - 9 price swing
- SUP 3: 141.05 - 2.000 proj of the Aug 6 - Sep 3 - 9 price swing
Markets slipped on the hawkish Fed and are yet to fully recover, touching 141.65 on the way lower. Medium-term trend signals on the continuation chart continue to point south. A resumption of the trend would pave the way for a move towards 141.56, a Fibonacci projection point on the continuation chart. A stronger recovery would open 144.48, the Nov 11 high. Further out, key resistance is at 146.53, the Aug 6 high (cont).
USDCAD TECHS: Bull Flag Highlights A Clear Uptrend
- RES 4: 1.4669 2.0% 10-dma envelope
- RES 3: 1.4539 3.382 proj of the Oct 17 - Nov 1 - 6 price swing
- RES 2: 1.4508 3.236 proj of the Oct 17 - Nov 1 - 6 price swing
- RES 1: 1.4467 High Dec 19
- PRICE: 1.4392 @ 15:50 GMT Jan 3
- SUP 1: 1.4336 Low Dec 20
- SUP 2: 1.4307/4232 20-day EMA / Low Dec 17
- SUP 3: 1.4136 50-day EMA
- SUP 4: 1.4011 Low Dec 5
USDCAD is unchanged and bulls remain in the driver’s seat. The latest pause appears to be a flag formation - a bullish continuation signal. Note too that moving average studies are in a bull-mode position, highlighting a dominant uptrend. Sights are on 1.4508 next, a Fibonacci projection level. Initial firm support to watch lies at 1.4307, the 20-day EMA. A pullback would be considered corrective.
AUDUSD TECHS: Southbound
- RES 4: 0.6471 High Dec 9
- RES 3: 0.6408 50-day EMA
- RES 2: 0.6341 High Dec 18
- RES 1: 0.6247/6282 High Dec 30 / 20-day EMA
- PRICE: 0.6204 @ 15:21 GMT Jan 3
- SUP 1: 0.6179 Low Dec 31
- SUP 3: 0.6158 1.236 proj of the Sep 30 - Nov 6 - 7 price swing
- SUP 3: 0.6100 Round number support
- SUP 4: 0.6045 1.500 proj of the Sep 30 - Nov 6 - 7 price swing
A bearish trend condition in AUDUSD remains intact and the pair continues to trade closer to latest lows. Recent weakness maintains the price sequence of lower lows and lower highs. Note that moving average studies are in a bear-mode position too, highlighting a dominant downtrend. Scope is seen for an extension towards 0.6158 next, a Fibonacci projection. Initial firm resistance to monitor is 0.6282, the 20-day EMA.