MNI DAILY TECHNICAL ANALYSIS - WTI Rally Tops Resistance
Price Signal Summary – WTI Rally Tops Resistance
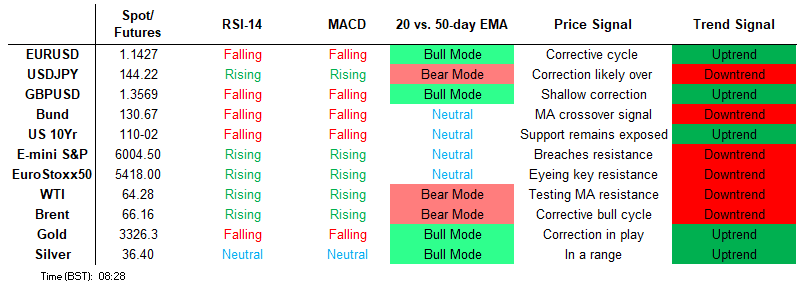
- The trend condition in S&P E-Minis is unchanged, it remains bullish and the contract traded to a fresh cycle high last week. The recent break of 5993.50, the May 20 high and a bull trigger, highlights a resumption of the uptrend. The trend cycle in Eurostoxx 50 futures remains bullish and the contract is trading closer to its recent highs. Moving average studies are in a bull-mode position, highlighting a clear dominant uptrend.
- Trend signals in GBPUSD are unchanged and remain bullish. Last week’s fresh cycle high, confirms a resumption of the uptrend and an extension of the price sequence of higher highs and higher lows. The trend set-up in EURJPY remains bullish and last week’s gains reinforce current conditions. Friday’s gains resulted in a print above key resistance at 165.21, the May 13 high. The trend structure in USDCAD remains bearish and the pair traded lower last Thursday, to a fresh cycle low. Support at 1.3686, the May 26 low and a bear trigger, has been cleared.
- A bullish theme in Gold remains intact and the latest pullback is considered corrective. Medium-term trend signals are bullish - moving average studies remain in a bull-mode position, highlighting a dominant uptrend. WTI futures traded higher last week, resulting in a clear break of resistance around the 50-day EMA. The climb signals scope for an extension towards $65.82, the Apr 4 high.
- The latest pullback in Bund futures appears corrective - for now - and the trend condition remains bullish. The recovery that started May 14 suggests the move down between Apr 22 - May 14, has been a correction. Gilt futures continue to trade closer to their recent highs. The latest rally undermines the recent bearish theme - a key short-term resistance at 91.87, the May 20 high, has been cleared.
FOREIGN EXCHANGE
EURUSD TECHS: Trend Structure Remains Bullish
- RES 4: 1.1625 1.500 proj of the Feb 28 - Mar 18 - 27 price swing
- RES 3: 1.1608 High Nov 9 2021
- RES 2: 1.1573 High Apr 21 and the bull trigger
- RES 1: 1.1495 High June 05
- PRICE: 1.1420 @ 06:04 BST Jun 9
- SUP 1: 1.1340 20-day EMA
- SUP 2: 1.1216/1.1065 50-day EMA and a pivot level / Low May 12
- SUP 3: 1.1026 38.2% retracement of the Feb 3 - Apr 21 bull cycle
- SUP 4: 1.0943 Low Apr 10
EURUSD is holding on to the bulk of its recent gains. The breach of 1.1419, the May 26 high, confirmed a resumption of the trend and has opened 1.1573, the Apr 21 high and bull trigger. Moving average studies are in a bull-mode position, highlighting a dominant uptrend. Support to watch lies at 1.1216, the 50-day EMA. A clear break of this average would undermine the bull theme. Initial support is at 1.1334, the 20-day EMA.
GBPUSD TECHS: Trend Needle Points North
- RES 4: 1.3800 Round number resistance
- RES 3: 1.3757 1.618 proj of the Feb 28 - Apr 3 - 7 price swing
- RES 2: 1.3681 1.500 proj of the Feb 28 - Apr 3 - 7 price swing
- RES 1: 1.3616 High Jun 5
- PRICE: 1.3554 @ 06:24 BST Jun 9
- SUP 1: 1.3453 20-day EMA
- SUP 2: 1.3335/3288 Low May 20 / 50-day EMA
- SUP 3: 1.3140 Low May 12 and key support
- SUP 4: 1.3041 Low Apr 14
Trend signals in GBPUSD are unchanged and remain bullish. Last week’s fresh cycle high, confirms a resumption of the uptrend and an extension of the price sequence of higher highs and higher lows. This opens 1.3681 next, a Fibonacci projection. Initial support to watch lies at 1.3453, the 20-day EMA. A clear break of this average would suggest potential for a deeper correction and expose the 50-day EMA, at 1.3288.
EURGBP TECHS: Trend Direction Remains Down
- RES 4: 0.8557 High Apr 28
- RES 3: 0.8541 High May 2
- RES 2: 0.8493 High May 9
- RES 1: 0.8440/59 50-day EMA and key resistance / High May 21
- PRICE: 0.8424 @ 06:41 BST Jun 9
- SUP 1: 0.8356 Low May 29 and the bear trigger
- SUP 2: 0.8327 1.382 proj of the Apr 11 - 16 - 21 price swing
- SUP 3: 0.8316 Low Mar 28 and a key support
- SUP 4: 0.8277 1.618 proj of the Apr 11 - 16 - 21 price swing
EURGBP is unchanged and a bear cycle remains in play. A key short-term resistance to watch is 0.8440, the 50-day EMA. It has been pierced, however, a clear break of it is required to highlight a stronger reversal. This would expose 0.8541. For bears, support to watch lies at 0.8356, the May 29 low. Clearance of this level would resume the downtrend and open 0.8316, the Mar 28 low and a key support.
USDJPY TECHS: Bear Cycle Remains In Play
- RES 4: 150.49 High Apr 2
- RES 3: 149.28 High Apr 3
- RES 2: 147.67/148.65 High May 14 / 12 and a reversal trigger
- RES 1: 145.18/146.28 50-day EMA / High May 29 and key resistance
- PRICE: 144.44 @ 06:47 BST Jun 9
- SUP 1: 142.12 Low May 27 and a key support
- SUP 2: 141.96 76.4% retracement of the Apr 22 - May 12 bull leg
- SUP 3: 139.89 Low Apr 22 and a bear trigger
- SUP 4: 138.82 1.50 proj of the Feb 12 - Mar 11 - 28 price swing
Recent gains in USDJPY are considered corrective and the trend condition remains bearish. Attention is on the next important support at 142.12, the May 27 low. A clear break of this level would confirm a resumption of the bear leg and open 139.89, the Apr 22 low. Moving average studies remain in a clear bear-mode position too, highlighting a dominant downtrend. Key short-term resistance has been defined at 146.28, the May 29 high.
EURJPY TECHS: Pierces An Important Resistance
- RES 4: 166.92 2.0% 10-dma envelope
- RES 3: 166.69 High Oct 31 2024 and a key resistance
- RES 2: 166.10 High Nov 6 ‘24
- RES 1: 165.29 High May 13 and bull trigger
- PRICE: 164.98 @ 07:02 BST Jun 9
- SUP 1: 163.43 20-day EMA
- SUP 2: 162.76 50-day EMA
- SUP 3: 161.78 Low May 26
- SUP 4: 161.09 Low May 23 and key support
The trend set-up in EURJPY remains bullish and last week’s gains reinforce current conditions. Friday’s gains resulted in a print above key resistance at 165.21, the May 13 high. A clear break of this hurdle would confirm a resumption of the uptrend and open 166.10, the Nov 6 2024 high. Key short-term support lies at 161.09, the May 23 low, where a break is required to highlight a stronger reversal and suggest scope for a deeper correction.
AUDUSD TECHS: Bullish Trend Sequence
- RES 4: 0.6603 High Nov 11 ‘24
- RES 3: 0.6582 High Nov 12 ‘24
- RES 2: 0.6550 61.8% retracement of the Sep 30 ‘24 - Apr 9 bear leg
- RES 1: 0.6538 High June 5
- PRICE: 0.6519 @ 07:54 BST Jun 9
- SUP 1: 0.6452/6404 20- and 50-day EMA values
- SUP 2: 0.6357 Low May 12
- SUP 3: 0.6275 Low Apr 14
- SUP 4: 0.6181 Low Apr 11
Trend signals in AUDUSD are unchanged, they are bullish and the pair continues to trade closer to its recent highs. Key support lies at 0.6404, the 50-day EMA. A clear break of this average is required to highlight a potential short-term reversal. The pair has recently cleared a key short-term resistance at 0.6515, the May 7 high, confirming a resumption of the uptrend. Sights are on 0.6550, a Fibonacci retracement.
USDCAD TECHS: Trend Needle Points South
- RES 4: 1.4200 Round number resistance
- RES 3: 1.4111 High Apr 4
- RES 2: 1.3909/1.4016 50-day EMA / High May 12 and 13
- RES 1: 1.3791 20-day EMA
- PRICE: 1.3680 @ 08:02 BST Jun 9
- SUP 1: 1.3611 Low Oct 8 2024
- SUP 2: 1.3579 1.500 proj of the Feb 3 - 14 - Mar 4 price swing
- SUP 3: 1.3503 1.618 proj of the Feb 3 - 14 - Mar 4 price swing
- SUP 4: 1.3473 Low Oct 2 2024
The trend structure in USDCAD remains bearish and the pair traded lower last Thursday, to a fresh cycle low. Support at 1.3686, the May 26 low and a bear trigger, has been cleared. This confirms a resumption of the downtrend and maintains the price sequence of lower lows and lower highs. Sights are on 1.3579 next, a Fibonacci projection. Resistance at the 50-day EMA is at 1.3909 - a key level. The 20- EMA is at 1.3791.
FIXED INCOME
BUND TECHS: (U5) Pullback Appears Corrective
- RES 4: 132.00 Round number resistance
- RES 3: 131.85 High Apr 22 and the bull trigger
- RES 2: 131.50 High May 7
- RES 1: 131.47 High Jun 5
- PRICE: 130.39 @ 05:43 BST Jun 9
- SUP 1: 130.12 Jun 5 low
- SUP 2: 129.30/13 Low May 22 / 15 and key short-term support
- SUP 3: 128.97 Low May 14
- SUP 4: 128.40 Low Apr 9
The latest pullback in Bund futures appears corrective - for now - and the trend condition remains bullish. The recovery that started May 14 suggests the move down between Apr 22 - May 14, has been a correction. A resumption of gains would signal scope for a climb towards 131.85, the Apr 22 high. Key short-term support to watch is 128.97, the May 14 low. First support lies at 130.12, the Jun 5 low.
BOBL TECHS: (U5) Support Remains Intact
- RES 4: 119.790 High Apr 7 and the bull trigger
- RES 3: 118.600 High Apr 22
- RES 2: 118.300 High May 7
- RES 1: 118.280 High Jun 3 / 5
- PRICE: 117.650 @ 05:51 BST Jun 9
- SUP 1: 117.530 Low Jun 5
- SUP 2: 117.470 Low May 21 and a key near-term support
- SUP 3: 117.470 Low May 21
- SUP 4: 116.660 Low Mar 27
Bobl futures remain in a bull cycle. The sharp pullback last Thursday - for now - appears corrective. The recovery since mid May highlights a reversal and the end of a correction in April and May. A resumption of gains would pave the way for a move towards 118.300, the May 7 high. Further out, scope would be for an extension towards 118.790, the Apr 7 high. Support to monitor is 117.470, the May 21 low. The bull trigger is 118.280, Jun 3 / 5 high.
SCHATZ TECHS: (U5) Retracement Mode
- RES 4: 107.830 High Apr 22
- RES 3: 107.690 High Apr 30
- RES 2: 107.610 High May 23 and a key near-term resistance
- RES 1: 107.320/475 Low May 29 / High May 27
- PRICE: 107.235 @ 06:07 BST Jun 9
- SUP 1: 107.195 Low Jun 6
- SUP 2: 107.125 Low May 12 and a key support
- SUP 3: 107.000 Round number support
- SUP 4: 106.890 2.000 proj of the May 23 - 29 - 30 price swing
Schatz futures remain in a bull cycle, however, the sharp pullback last Thursday does undermine the recent bull theme. A resumption of gains would highlight the fact that the retracement has been a correction. Initial resistance to watch is 107.475, the May 27 high. A break would be a bullish development. For bears, an extension lower would instead expose the key support at 107.125, the May 12 low.
GILT TECHS: (U5) Trading Above Support
- RES 4: 93.05 1.382 proj of the May 22 - 27 - 29 price swing
- RES 3: 93.00 Round number resistance
- RES 2: 92.79 1.236 proj of the May 22 - 27 - 29 price swing
- RES 1: 92.63 High Jun 5
- PRICE: 91.83 @ Close Jun 6
- SUP 1: 91.44 Low Jun 4
- SUP 2: 91.16/90.59 Low Jun 2 / Low May 29
- SUP 3: 90.11 Low May 22 and the bear trigger
- SUP 4: 90.00 Round number support
Gilt futures continue to trade closer to their recent highs. The latest rally undermines the recent bearish theme - a key short-term resistance at 91.87, the May 20 high, has been cleared. This signals scope for an extension higher and sights are on 92.79, a Fibonacci projection. Initial firm support has been defined at 91.44, the Jun 4 low. A break of this support is required to signal a possible reversal.
BTP TECHS: (U5) Northbound
- RES 4: 122.35 2.500 proj of the May 14 - 20 - 21 price swing
- RES 3: 122.00 Round number resistance
- RES 2: 121.65 2.000 proj of the May 14 - 20 - 21 price swing
- RES 1: 121.32 High Jun 5
- PRICE: 120.63 @ Close Jun 6
- SUP 1: 120.08 20-day EMA
- SUP 2: 119.48 Low May 26
- SUP 3: 118.87 Low May 21
- SUP 4: 118.51 Low May 14 and key support
A bull cycle in BTP futures remains intact and last Thursday’s pullback is for now considered corrective. Resistance and a bull trigger at 119.70, the Apr 24 high, has been cleared. This confirms a resumption of the uptrend and opens 121.12 next, a Fibonacci projection. Key support to watch lies at 118.51, the May 14 low. A clear break of this level would highlight a reversal. First support lies at 120.08, the 20-day EMA.
EQUITIES
EUROSTOXX50 TECHS: (M5) Bulls Remain In The Driver’s Seat
- RES 4: 5600.00 Round number resistance
- RES 3: 5565.23 1.618 proj of the Apr 7 - 9 - 10 price swing
- RES 2: 5516.00 High Mar 3 and the key bull trigger
- RES 1: 5475.00 High May 20
- PRICE: 5419.00 @ 06:22 BST Jun 9
- SUP 1: 5362.38 20-day EMA
- SUP 2: 5280.33 50-day EMA and a key support
- SUP 3: 5142.00 Low May 2
- SUP 4: 5055.00 Low Apr 30
The trend cycle in Eurostoxx 50 futures remains bullish and the contract is trading closer to its recent highs. Moving average studies are in a bull-mode position, highlighting a clear dominant uptrend. Sights are on 5516.00, the Mar 3 high and the key bull trigger. Clearance of this level would strengthen a bull theme. Key support to watch lies at 5280.33, the 50-day EMA. A clear break of this average would signal a possible reversal.
E-MINI S&P: (M5) Fresh Cycle High
- RES 4: 6124.00 High Feb 24
- RES 3: 6080.75 High Feb 26
- RES 2: 6057.00 High Mar 3
- RES 1: 6025.00 High June 6
- PRICE: 5996.50 @ 07:22 BST Jun 9
- SUP 1: 5883.97/5789.75 20- and 50-day EMA values
- SUP 2: 5756.50 Low May 23
- SUP 3: 5596.00 Low May 7
- SUP 4: 5455.50 Low Apr 30
The trend condition in S&P E-Minis is unchanged, it remains bullish and the contract traded to a fresh cycle high last week. The recent break of 5993.50, the May 20 high and a bull trigger, highlights a resumption of the uptrend and maintains a price sequence of higher highs and higher lows. A continuation would open 6057.00 next, the Mar 3 high. Key support lies at 5789.75, the 50-day EMA.
COMMODITIES
BRENT TECHS: (Q5) Has Cleared The 50-Day EMA
- RES 4: $75.33 - High Feb 20
- RES 3: $73.88 - High Apr 2 and a bull trigger
- RES 2: $67.73 - 61.8% retracement of the Apr 2 - 9 sell-off
- RES 1: $66.69 - Intraday high
- PRICE: $66.35 @ 07:11 BST Jun 9
- SUP 1: $62.09/57.78 - Low May 30 / Low April 9 and the bear trigger
- SUP 2: $55.88 - 2.236 proj of the Feb 20 - Mar 5 - Apr 2 price swing
- SUP 3: $54.70 - 2.382 proj of the Feb 20 - Mar 5 - Apr 2 price swing
- SUP 4: $54.00 - Round number support
Brent futures traded higher on Friday, resulting in a clear break of resistance at $65.33, the 50-day EMA. A continuation higher would open $67.73 next, a Fibonacci retracement. It is still possible that the recovery since early May is a correction. Moving average studies are in a bear-mode position, highlighting a dominant medium-term downtrend. Support to watch lies at $62.09, the May 30 low. A break would be bearish.
WTI TECHS: (N5) Bull Phase Intact
- RES 4: $72.12 - High Feb 20
- RES 3: $71.10 - High Apr 2 and key resistance
- RES 2: $65.82 - High Apr 4 2 and key resistance
- RES 1: $64.86 - High May 21
- PRICE: $64.44 @ 07:19 BST Jun 9
- SUP 1: $59.74/54.33 - Low May 30 / Low April 9 and the bear trigger
- SUP 2: $53.30 - 2.236 proj of the Feb 20 - Mar 5 - Apr 2 price swing
- SUP 3: $52.14 - 2.382 proj of the Jan 15 - Feb 4 - 11 price swing
- SUP 4: $50.00 - Psychological round number
WTI futures traded higher last week, resulting in a clear break of resistance around the 50-day EMA. The climb signals scope for an extension towards $65.82, the Apr 4 high. It is still possible that the recovery since early May is a correction. Moving average studies are in a bear-mode position, highlighting a dominant medium-term downtrend. Support to watch lies at $59.74, the May 30 low. A break would highlight a potential bearish reversal.
GOLD TECHS: Corrective Pullback
- RES 4: $3578.0 - 2.000 proj of the Dec 19 - Feb 24 - Feb 28 swing
- RES 3: $3547.9 - 1.764 proj of the Feb 28 - Apr 3 - Apr 7 price swing
- RES 2: $3435.6/3500.1 - High May 7 / High Apr 22 and bull trigger
- RES 1: $3403.5 - High Jun 5
- PRICE: $3320.0 @ 07:25 BST Jun 9
- SUP 1: $3240.0 - 50-day EMA
- SUP 2: $3121.0 - Low May 15 and key support
- SUP 3: $3085.0 - 61.8% retracement of the Apr 7 - Apr 22 upleg
- SUP 4: $3100.0 - Round number support
A bullish theme in Gold remains intact and the latest pullback is considered corrective. Medium-term trend signals are bullish - moving average studies remain in a bull-mode position, highlighting a dominant uptrend. A resumption of gains would refocus attention on $3435.6 next, the May 7 high. A break of this hurdle would strengthen bullish conditions. On the downside, the next support to monitor is $3240.0, the 50-day EMA.
SILVER TECHS: Impulsive Bull Wave Extends
- RES 4: $38.000 - Round number resistance
- RES 3: $37.195 - 2.236 proj of the May 15 - 22 high / low price swing
- RES 2: $36.987 - 1.000 proj of the Apr 7 - 25 - May 15 price swing
- RES 1: $36.712 - 2.000 proj of the May 15 - 22 high / low price swing
- PRICE: $36.283 @ 08:06 BST Jun 9
- SUP 1: $33.967 - Low Jun 3
- SUP 2: $33.147/31.651 - 50-day EMA / Low May 15
- SUP 3: $30.915/28.351 - Low Apr 11 / 7 and the bear trigger
- SUP 4: $27.686 - Low Sep 6 ‘24
An impulsive bull wave in Silver remains in play and last week’s strong gains reinforce this condition. The metal has recently cleared a number of important resistance points. Thursday’s rally resulted in a move above $34.903, the Oct 23 ‘24 high and a key bull trigger. The clear break of it marks an important medium-term bullish development. Sights are on $36.712 next, a Fibonacci projection. Initial support to watch lies at $33.967, the Jun 3 low.