MNI DAILY TECHNICAL ANALYSIS - USDJPY Drop Affirms Downtrend
Price Signal Summary – USDJPY Drop Affirms Downtrend
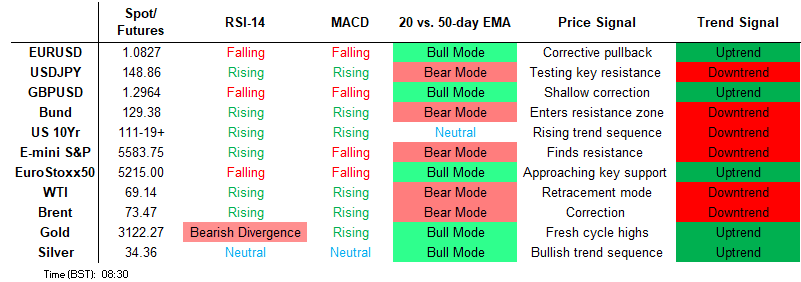
- S&P E-Minis traded sharply lower Friday and the contract maintains a softer tone. Attention is on key support and the bear trigger at, 5559.75, the Mar 13 low. A break of this level would confirm a resumption of the downtrend that started Feb 19. Eurostoxx 50 futures are trading lower today and this has resulted in a breach of key support at 5229.00, the Mar 11 low. The print below this support undermines a bullish theme and signals scope for a deeper retracement.
- Recent weakness in EURUSD appears to have been a correction and the trend condition remains bullish. MA studies are in a bull-mode position highlighting a dominant uptrend. 1.0733, the Mar 27 low, marks a key near-term support. The move down in EURGBP that started Mar 11 still appears corrective and has allowed a recent overbought condition to unwind. Note that MA studies are in a bull-mode position, highlighting a dominant uptrend. USDJPY is trading lower today. The primary trend direction is unchanged, it remains down and the latest recovery is considered corrective. A key short-term resistance at the 50-day EMA - at 150.90 - is intact.
- The trend condition in Gold is unchanged, it remains bullish. Today’s strong gains highlight a bullish start to this week’s session and confirm a continuation of the primary uptrend. The rally also once again, highlights fresh all-time highs for the yellow metal. Despite recent gains, a bearish trend condition in WTI futures remains intact, and gains this month are considered corrective. However, a key resistance at $69.17, the 50-day EMA, has been pierced. The breach strengthens a bullish theme.
- Bund futures have started the week on a bullish note, extending the recovery that started Mar 11. Recent gains are considered corrective, however, the recent breach of the 20-day EMA has exposed resistance at 129.41, the Jan 14 low. The short-term trend outlook in Gilt futures remains bearish, however, today’s gap higher highlights a bullish start to this week’s trading session, and signals scope for a stronger recovery near-term.
FOREIGN EXCHANGE
EURUSD TECHS: MA Studies Highlights A Dominant Uptrend
- RES 4: 1.1083 High Oct 2 2024
- RES 3: 1.1040 High Oct 4 2024
- RES 2: 1.0961 76.4% retracement of the Sep 25 ‘24 - Feb 3 bear leg
- RES 1: 1.0861/0955 High Mar 21 / 18 and the bull trigger
- PRICE: 1.0837 @ 06:17 BST Mar 31
- SUP 1: 1.0733 Low Mar 27 and a key short-term support
- SUP 2: 1.0649 50-day EMA and a short-term pivot level
- SUP 3: 1.0602 Low Mar 5
- SUP 4: 1.0548 50.0% retracement of the Feb 3 - Mar 18 bull run
Recent weakness in EURUSD appears to have been a correction and the trend condition remains bullish. MA studies are in a bull-mode position highlighting a dominant uptrend. 1.0733, the Mar 27 low, marks a key near-term support. A move through it would confirm a clear breach of the 20-day EMA and allow for a deeper correction towards the 50-day EMA at 1.0649. Key resistance and the bull trigger is at 1.0955, the Mar 18 high.
GBPUSD TECHS: Trend Needle Points North
- RES 4: 1.3175 High Oct 4 2024
- RES 3: 1.3119 76.4% retracement of the Sep 26 ‘24 - Jan 13 bear leg
- RES 2: 1.3048 High Nov 6 ‘24
- RES 1: 1.3015 High Mar 20 and the bull trigger
- PRICE: 1.2960 @ 06:30 BST Mar 31
- SUP 1: 1.2884/71 20-day EMA / Low Mar 27
- SUP 2: 1.2753 50-day EMA and a short-term pivot support
- SUP 3: 1.2679 Low Mar 4
- SUP 4: 1.2559 Low Feb 28
The trend in GBPUSD is bullish and the pair continues to trade above last week’s lows. Moving average studies are in a bull-mode position highlighting a dominant uptrend. Support at the 20-day EMA, at 1.2884, is intact. A continuation higher and a breach of 1.3015, the Mar 20 high and bull trigger, would pave the way for a climb towards 1.3048, the Nov 6 2024 high. A clear breach of the 20-day EMA is required to signal scope for a deeper correction.
EURGBP TECHS: Remains Above Support
- RES 4: 0.8494 High Aug 26 ‘24
- RES 3: 0.8474 High Jan 20 and a key resistance
- RES 2: 0.8428/8450 High Mar 18 / 11 and the bull trigger
- RES 1: 0.8395 High Mar 24 and a key near-term resistance
- PRICE: 0.8364 @ 06:47 BST Mar 31
- SUP 1: 0.8316 Low Mar 28
- SUP 2: 0.8291 76.4% retracement of the Mar 3 - 11 bull leg
- SUP 3: 0.8251 Low Mar 4
- SUP 4: 0.8241 Low Mar 3 and a key support
The move down in EURGBP that started Mar 11 still appears corrective and has allowed a recent overbought condition to unwind. Note that MA studies are in a bull-mode position, highlighting a dominant uptrend. Support to watch is 0.8316, the Mar 28 low. A break of this level is required to signal scope for a deeper retracement that would open 0.8290, a Fibonacci retracement. For bulls, clearance of 0.8395, the Mar 24 high, would be a bullish development.
USDJPY TECHS: Resistance At The 50-Day EMA Remains Intact
- RES 4: 152.70 50.0% retracement of the Jan 10 - Mar 11 bear leg
- RES 3: 151.30 High Mar 3
- RES 2: 150.90/151.21 50-day EMA / High Mar 28
- RES 1: 149.84 Intraday high
- PRICE: 148.85 @ 07:36 BST Mar 31
- SUP 1: 148.59 Low Mar 21
- SUP 2: 148.18 Low Mar 20 and a key short-term support
- SUP 3: 147.42 Low Mar 13
- SUP 4: 146.54 Low Mar 11 nad the bear trigger
USDJPY is trading lower today. The primary trend direction is unchanged, it remains down and the latest recovery is considered corrective. A key short-term resistance at the 50-day EMA - at 150.90 - is intact. A clear break of this EMA would undermine the bearish theme and signal scope for a stronger rally towards 152.70, a Fibonacci retracement. For bears, the first key support to watch is 148.18, the Mar 20 low. A breach would be bearish.
EURJPY TECHS: Monitoring Support
- RES 4: 165.43 High Nov 8
- RES 3: 164.90 High Dec 30 ‘24 and a key medium-term resistance
- RES 2: 164.55 High Jan 7
- RES 1: 164.19 High Mar 18 and the bull trigger
- PRICE: 161.49 @ 08:01 GMT Mar 31
- SUP 1: 161.13 Intraday low
- SUP 2: 160.66 50-day EMA and a pivot support
- SUP 3: 158.90 Low Mar 10
- SUP 4: 158.00 Round number support
A bull theme in EURJPY remains intact and recent weakness between Mar 18 - 20 appears corrective. This sell-off allowed an overbought condition to unwind. Pivot support to watch is 160.66, the 50-day EMA. A break of this level would signal potential for a deeper retracement. For bulls, sights are on resistance at 164.08, the Jan 24 high. It has been pierced, a clear break of it would strengthen a bullish condition and open 164.90, the Dec 30 ‘24 high.
AUDUSD TECHS: Support Remains Intact For Now
- RES 4: 0.6429 High Dec 12 ‘24
- RES 3: 0.6414 38.2% retracement of the Sep 30 ‘24 - Feb 3 bear leg
- RES 2: 0.6409 High Feb 21 and a bull trigger
- RES 1: 0.6331/91 High Mar 26 / High Mar 17 and 18
- PRICE: 0.6287 @ 08:04 BST Mar 31
- SUP 1: 0.6258 Low Mar 21
- SUP 2: 0.6187 Low Feb 4
- SUP 3: 0.6171/6088 Low Feb 4 / 3 and a key support
- SUP 4: 0.6045 1.500 proj of the Sep 30 - Nov 6 - 7 price swing
AUDUSD is unchanged and is trading in a tight range. A S/T bull theme is intact and the latest move down appears corrective. Key short-term support to watch is 0.6187, the Mar 4 low. Clearance of this level would reinstate a bear threat. First support is at 0.6258, the Mar 21 low. A stronger recovery would refocus attention on 0.6409, the Feb 21 high. Clearance of this hurdle would strengthen the bull cycle and resume the uptrend that started Feb 3.
USDCAD TECHS: Trend Signal Remains Bullish
- RES 4: 1.4700 Round number resistance
- RES 3: 1.4641 76.4% retracement of the Feb 3 - 14 bear leg
- RES 2: 1.4452/4543 High Mar 13 / 4 and a bull trigger
- RES 1: 1.4402 High Mar 20
- PRICE: 1.4325 @ 08:08 BST Mar 31
- SUP 1: 1.4235 Low Mar 26 and a key near-term support
- SUP 2: 1.4151/4107 Low Feb 14 / 50.0% of Sep 25 - Feb 3 bull run
- SUP 3: 1.4011 Low Dec 5 ‘24
- SUP 4: 1.3944 61.8% retracement of the Sep 25 ‘24 - Feb 3 bull cycle
USDCAD continues to trade above last week’s high. A return lower and clearance of 1.4235, the Mar 26 low, would undermine the bull theme and instead highlight potential for a test of 1.4151, the Feb 14 low and a bear trigger. Moving average studies continue to highlight a dominant uptrend. A reversal higher would refocus attention on the bull trigger at 1.4543, the Mar 4 high. First resistance to watch is 1.4402, the Mar 20 high.
FIXED INCOME
BUND TECHS: (M5) Bull Cycle Extends
- RES 4: 130.40 Low Feb 19
- RES 3: 130.26 61.8% retracement of the Feb 28 - Mar 11 bear leg
- RES 2: 130.00 Round number resistance
- RES 1: 129.41 Low Jan 14 and a key short-term resistance
- PRICE: 129.33@ 05:54 BST Mar 31
- SUP 1: 128.65 20-day EMA
- SUP 2: 127.74 Low Mar 25 and a key short-term support
- SUP 3: 127.20 Low Mar 17
- SUP 4: 126.53 Low Mar 11 and the bear trigger
Bund futures have started the week on a bullish note, extending the recovery that started Mar 11. Recent gains are considered corrective, however, the recent breach of the 20-day EMA has exposed resistance at 129.41, the Jan 14 low. Clearance of this level would strengthen a bullish theme and open the 130.00 handle and 130.26, a Fibonacci retracement. Key short-term support to watch lies at 127.74, the Mar 25 low.
BOBL TECHS: (M5) Bull Cycle Extends
- RES 4: 119.040 High Feb 28 and a key resistance
- RES 3: 118.950 High Mar 4
- RES 2: 118.382 76.4% retracement of the Feb 28 - Mar 6 sell-off
- RES 1: 118.100 Intraday high
- PRICE: 118.070 @ 06:10 BST Mar 31
- SUP 1: 117.441 20-day EMA
- SUP 2: 117.080 Low Mar 25 and a ey short-term support
- SUP 3: 116.800 Low Mar 17
- SUP 4: 116.470 Low Mar 12
Bobl futures are trading higher today as the contract extends the recovery that started Mar 6. The contract has breached 117.974, 61.8% retracement of the bear leg between Feb 28 - Mar 6. The breach strengthens the bull cycle and paves the way for a climb towards 118.382, a Fibonacci retracement. On the downside, initial support to watch lies at 117.441., the 20-day EMA. Key short-term support is at 117.080, the Mar 25 low.
SCHATZ TECHS: (M5) Approaching Key Resistance
- RES 4: 107.289 1.236 retracement proj of the Mar 4 - 6 bear leg
- RES 3: 107.200 Round number resistance
- RES 2: 107.120 High Mar 4 and key resistance
- RES 1: 107.055 Intraday high
- PRICE: 107.025 @ 06:24 BST Mar 31
- SUP 1: 106.910 Low Mar 28
- SUP 2: 106.783 20-day EMA
- SUP 3: 106.715 Low Mar 25
- SUP 4: 106.630 Low Mar 18
Schatz futures maintain a firmer tone and the contract is trading higher again, today. Price has cleared all the relevant retracement levels of the bear leg between Mar 4 - 6, and this signals scope for a climb towards key resistance and a bull trigger at 107.120, the Mar 4 high. On the downside, initial firm support to watch lies 106.783, the 20-day EMA. A move down and a breach of this level would signal a possible reversal.
GILT TECHS: (M5) Bullish Start To The Week
- RES 4: 93.79 High Mar 4
- RES 3: 93.01 High Mar 20
- RES 2: 92.55 Trendline resistance drawn from the Mar 4 high
- RES 1: 92.17 50.0% retracement of the Mar 4 - 27 bear cycle
- PRICE: 92.07 @ 08:10 BST Mar 31
- SUP 1: 91.85 Intraday low
- SUP 2: 91.03 Low Mar 28
- SUP 3: 90.55 Low Mar 27 and the bear trigger
- SUP 4: 90.49 1.618 proj of the Feb 6 - 20 - Mar 4 price swing
The short-term trend outlook in Gilt futures remains bearish, however, today’s gap higher highlights a bullish start to this week’s trading session, and signals scope for a stronger recovery near-term. An extension would open 92.55, a trendline resistance drawn from the Apr 4 high. Clearance of this level would strengthen the short-term bull cycle. Key support and the bear trigger has been defined at 90.55, the Mar 27 low.
BTP TECHS: (M5) Bull Phase Remains In Play
- RES 4: 119.31 Low Mar 4 and a gap high on the daily chart
- RES 3: 118.62 76.4% retracement of the Feb 28 - Mar 14 bear leg
- RES 2: 118.56 High Mar 5
- RES 1: 118.08 Intraday high
- PRICE: 118.05 @ 07:43 BST Mar 31
- SUP 1: 117.44 20-day EMA
- SUP 2: 116.89 Low Mar 25 and a key short-term support
- SUP 3: 116.15 Low Mar 17
- SUP 4: 115.75 Low Mar 14
Recent gains in BTP futures still appear corrective in nature. However, the contract continues to appreciate and price is trading higher once again, today. A continuation of the current bull phase would signal scope for a climb towards 118.62, a Fibonacci retracement. On the downside, key short-term support has been defined at 116.89, the Mar 25 low. A break of this level would signal a reversal and the end of the corrective cycle.
EQUITIES
EUROSTOXX50 TECHS: (M5) Trades Through A Key Support
- RES 4: 5600.00 Round number resistance
- RES 3: 5516.00 High Mar 3 and the bull trigger
- RES 2: 5471.00 High Mar 19 / 20
- RES 1: 5359.39 20-day EMA
- PRICE: 5218.00 @ 06:41 BST Mar 31
- SUP 1: 5200.00 Round number support
- SUP 2: 5160.00 Low Feb 4
- SUP 3: 5079.00 Low Feb 3 and a key support
- SUP 4: 5040.00 Low Jan 16
Eurostoxx 50 futures are trading lower today and this has resulted in a breach of key support at 5229.00, the Mar 11 low. The print below this support undermines a bullish theme and signals scope for a deeper retracement. Sights are on the 5200 handle next, where a break would open 5079.00, the Feb 3 low. It is still possible that recent weakness is part of a broader correction. Initial resistance to watch is 5359.39, the 20-day EMA.
E-MINI S&P: (M5) Sights Are On The Bear Trigger
- RES 4: 5896.39 50-day EMA
- RES 3: 5837.25 High Mar 25 and a key resistance
- RES 2: 5778.68 20-day EMA
- RES 1: 5651.25 Low Mar 21
- PRICE: 5584.50 @ 07:02 BST Mar 31
- SUP 1: 5574.25 Intraday low
- SUP 2: 5559.75 Low Mar 13 and the bear trigger
- SUP 3: 5483.50 2.00 proj of the Dec 6 ‘24 - Jan 13 - Feb 19 swing
- SUP 4: 5396.00 2.236 proj of the Dec 6 ‘24 - Jan 13 - Feb 19 swing
S&P E-Minis traded sharply lower Friday and the contract maintains a softer tone. Attention is on key support and the bear trigger at, 5559.75, the Mar 13 low. A break of this level would confirm a resumption of the downtrend that started Feb 19, and open 5483.30, a Fibonacci projection. Moving average studies are in a bear-mode position, highlighting a dominant downtrend. Key short-term resistance has been defined at 5837.25, the Mar 25 high.
COMMODITIES
BRENT TECHS: (M5) Holding On To The Bulk Of Its Recent Gains
- RES 4: $78.96 - High Jan 15 and a reversal trigger
- RES 3: $76.26 - High Feb 20 and a bull trigger
- RES 2: $74.32 - High Feb 25
- RES 1: $73.49 - High Mar 26
- PRICE: $72.72 @ 07:09 BST Mar 31
- SUP 1: $69.51/67.95 - Low Mar 19 / 5 and the bear trigger
- SUP 2: $67.87 - Low Sep 10 ‘24 and a key medium-term support
- SUP 3: $66.55 1.618 proj of the Jan 15 - Feb 4 - 20 price swing
- SUP 4: $64.26 2.000 proj of the Jan 15 - Feb 4 - 20 price swing
Brent futures are holding on to its recent highs. For now, short-term gains are considered corrective. However, price has breached the 50-day EMA, at $72.43. The clear break of this average signals scope for a stronger recovery and opens $74.32 next, the Feb 25 high. Moving average studies remain in a bear-mode position highlighting a dominant downtrend. The bear trigger lies at $67.95, the Mar 5 low.
WTI TECHS: (K5) Corrective Cycle Remains In Play
- RES 4: $76.57 - High Jan 15 and the bull trigger
- RES 3: $72.91 - High Feb 11 and key resistance
- RES 2: $70.98 - High Feb 25
- RES 1: $70.22 - High Mar 26
- PRICE: $69.37 @ 07:18 BST Mar 31
- SUP 1: $66.09/64.85 - Low Mar 19 / 5 and the bear trigger
- SUP 2: $63.73 - Low Sep 10 ‘24 and a key medium-term support
- SUP 3: $60.00 - Psychological round number
- SUP 4: $59.40 - 2.00 proj of the Jan 15 - Feb 4 - 11 price swing
Despite recent gains, a bearish trend condition in WTI futures remains intact, and gains this month are considered corrective. However, a key resistance at $69.17, the 50-day EMA, has been pierced. The breach strengthens a bullish theme and opens $70.98, the Feb 25 high. For bears, a reversal lower would expose the bear trigger at $64.85, the Mar 5 low. Clearance of this level would resume the downtrend and open $63.73, the Oct 10 ‘24 low.
GOLD TECHS: Northbound
- RES 4: $3200.00 - Round number resistance
- RES 3: $3196.2 - 3.236 proj of the Nov 14 - Dec 12 - 19 price swing
- RES 2: $3151.5 - 3.000 proj of the Nov 14 - Dec 12 - 19 price swing
- RES 1: $3127.9 - Intraday high
- PRICE: $3118.5 @ 07:26 BST Mar 31
- SUP 1: $3053.5 - Low Mar 28
- SUP 2: $2992.4 - 20-day EMA
- SUP 3: $2956.2 - High Feb 24
- SUP 4: $2908.4 - 50-day EMA
The trend condition in Gold is unchanged, it remains bullish. Today’s strong gains highlight a bullish start to this week’s session and confirm a continuation of the primary uptrend. The rally also once again, highlights fresh all-time highs for the yellow metal. Sights are on the $3151.5, a Fibonacci projection. Support to watch lies at $2992.4, the 20-day EMA. A pullback would be considered corrective.
SILVER TECHS: Bullish Trend Sequence
- RES 4: $35.736 - 1.236 proj of the Feb 14 - Apr 12 - May 2 ‘24 swing
- RES 3: $34.903 - High Oct 23 ‘24 and the bull trigger
- RES 2: $34.548 - High Oct 29 ‘24
- RES 1: $34.501 - Intraday high
- PRICE: $34.355 @ 08:23 BST Mar 31
- SUP 1: $33.304 - 20-day EMA
- SUP 2: $32.665 - Low Mar 21
- SUP 3: $32.483/31.814 - 50-day EMA / Low Mar 11
- SUP 4: $30.815 - Low Feb 28 and key support
Bullish conditions in Silver remain intact and last week’s gains reinforce this condition. The rally resulted in a breach of $34.233, the Mar 18 high and a bull trigger. This confirms a resumption of the uptrend and maintains the bullish price sequence of higher highs and higher lows. Sights are on $34.903, the Oct 23 ‘24 high and a medium-term bull trigger. Initial firm support to watch is $33.3004, the 20-day EMA.