MNI DAILY TECHNICAL ANALYSIS - USDJPY Clears Bull Trigger
Price Signal Summary – USDJPY Clears Bull Trigger on BoJ
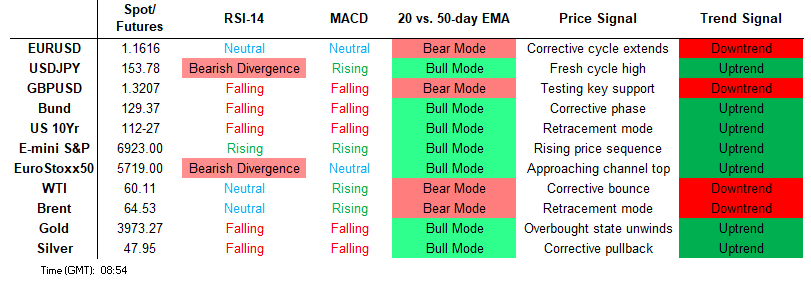
- The trend condition in S&P E-Minis remains bullish and price is trading higher this week. The fresh cycle high confirms a resumption of the primary uptrend and maintains the bullish price sequence of higher highs and higher lows. The trend structure in Eurostoxx 50 futures remains bullish. This week’s fresh cycle high’s reinforces a bull theme and the move higher maintains the rising price sequence of higher highs and higher lows.
- Bullish conditions in USDJPY remain intact. Key resistance at 153.27, the Oct 10 high, has been cleared. The break confirms a resumption of the medium-term uptrend. A bear cycle in GBPUSD remains intact and Wednesday's steep sell-off strengthens current conditions. The pair has breached 1.3249, the Oct 14 low and a bear trigger. The break confirms a resumption of the downtrend that started Sep 17. A bull trend in EURGBP remains intact and this week’s rally has strengthened current conditions. The clear break of resistance 0.8769, the Jul 28 high and bull trigger, confirms a resumption of the uptrend.
- A fresh cycle low this week in Gold highlights an extension of the bear cycle that started Oct 20. Note that the trend is overbought and the deeper retracement is allowing this condition to unwind. Recent gains in WTI futures appear corrective for now, however, note that price has recently traded through the 50-day EMA, currently at $60.09. The breach of this average signals scope for a stronger recovery.
- A short-term bear cycle in Bund futures remains intact for now. The move down that started on Oct 17 is considered corrective and this has allowed an overbought trend condition to unwind. The trend outlook in Gilt futures is unchanged, it remains bullish and a fresh cycle high on Tuesday reinforces current conditions. Note too that MA studies are in a bull-mode position, highlighting a dominant uptrend. Sights are 94.00 next.
[CROSS ASSET]: Refreshing the MNI Tech Trend Monitor, Adding Gold, Silver, JPY
- We refresh our Global Tech Trend Monitor, adding longer-term techs for Spot Gold, Silver and USDJPY, while refreshing levels for UK Gilt 10y and 30y yields as well as the Europe Banking Stock Index (SX7E).
- See full document here: https://emedia.marketnews.com/marketnewsintl/MNITechTrendMonitorOct25.pdf
FOREIGN EXCHANGE
EURUSD TECHS: Support Remains Intact For Now
- RES 4: 1.1919 High Sep 17 and a bull trigger
- RES 3: 1.1820 High Sep 23
- RES 2: 1.1775 61.8% retracement of the Sep 17 - Oct 9 bear leg
- RES 1: 1.1676/1728 High Oct 20 / 17 and key resistance
- PRICE: 1.1628 @ 06:16 GMT Oct 30
- SUP 1: 1.1577/42 Low Oct 22 / 9 and the bear trigger
- SUP 2: 1.1516 76.4% retracement of the Aug 1 - Sep 17 bull leg
- SUP 3: 1.1392 Low Aug 1 and bear trigger
- SUP 4: 1.1313 Low May 30
EURUSD has recovered from Wednesday’s low and for now, remains inside its current short-term range. Support lies at 1.1542, the Oct 9 low. Clearance of this level would confirm a resumption of the bear cycle that started Sep 17. A break would open 1.1516, a Fibonacci retracement. A move through 1.1516 would expose key support at 1.1392, the Aug 1 low. Price needs to trade above 1.1728, the Oct 17 high, to reinstate a bull theme.
GBPUSD TECHS: Support Remains Exposed
- RES 4: 1.3527 High Oct 1
- RES 3: 1.3471 High Oct 17 and a key short-term resistance
- RES 2: 1.3413 50-day EMA
- RES 1: 1.3359 20-day EMA
- PRICE: 1.3205 @ 06:34 GMT Oct 30
- SUP 1: 1.3142/41 Low Aug 1 and a key support / Low Oct 29
- SUP 2: 1.3041 Low Apr 14
- SUP 3: 1.2971 1.382 proj of the Sep 17 - 25 - Oct 1 price swing
- SUP 4: 1.2945 50.0% retracement of the Jan 13 - Jul 1 bull leg
A bear cycle in GBPUSD remains intact and Wednesday's steep sell-off strengthens current conditions. The pair has breached 1.3249, the Oct 14 low and a bear trigger. The break confirms a resumption of the downtrend that started Sep 17. Note too that key support at 1.3142, the Aug 1 low, was briefly pierced yesterday. A clear break of this level would strengthen a bearish theme. Initial firm resistance is 1.3359, the 20-day EMA.
EURGBP TECHS: Trend Needle Points North
- RES 4: 0.8865 1.764 proj of the Sep 15 - 25 - Oct 8 price swing
- RES 3: 0.8848 1.618 proj of the Sep 15 - 25 - Oct 8 price swing
- RES 2: 0.8835 High May 3 2023
- RES 1: 0.8818 High Oct 29
- PRICE: 0.8803 @ 07:02 GMT Oct 30
- SUP 1: 0.8751 High Sep 25
- SUP 2: 0.8718 20-day EMA
- SUP 3: 0.8692 50-day EMA
- SUP 4: 0.8656 Low Oct 8 and a key support
A bull trend in EURGBP remains intact and this week’s rally has strengthened current conditions. The clear break of resistance 0.8769, the Jul 28 high and bull trigger, confirms a resumption of the uptrend and maintains the bullish price sequence of higher highs and higher lows. The 0.8800 handle has been cleared, sights are on 0.8835, the May 3 2023 high. Initial support lies at 0.8751, the Sep 25 high.
USDJPY TECHS: Clears The Bull Trigger
- RES 4: 155.53 2.00% retracement of the Jan 10 - Apr 22 bear leg
- RES 3: 154.80 High Feb 12
- RES 2: 154.39 76.4% retracement of the Jan 10 - Apr 22 bear leg
- RES 1: 153.89 Intraday high
- PRICE: 153.69 @ 08:47 GMT Oct 30
- SUP 1: 152.16 Intraday low
- SUP 2: 151.34 20-day EMA
- SUP 3: 149.79 50-day EMA
- SUP 4: 149.05 Low Oct 6 and a gap high on the daily chart
Bullish conditions in USDJPY remain intact. Key resistance at 153.27, the Oct 10 high, has been cleared. The break confirms a resumption of the medium-term uptrend. Today’s gains have also resulted in a print above 153.82, a 1.618 projection of the Sep 17 - 26 - Oct 1 price swing. This opens 154.39, a Fibonacci retracement point. First important support to watch lies at 151.34, the 20-day EMA.
EURJPY TECHS: Fresh Cycle High
- RES 4: 180.37 1.500 proj of the Jul 31 - Sep 29 - Oct 2 price swing
- RES 3: 180.00 Psychological round number
- RES 2: 178.94 1.236 proj of the Jul 31 - Sep 29 - Oct 2 price swing
- RES 1: 178.70 Intraday high
- PRICE: 178.56 @ 08:48 GMT Oct 30
- SUP 1: 176.23 20-day EMA
- SUP 2: 174.64 50-day EMA
- SUP 3: 173.92 Low Oct 6 and a gap high on the daily chart
- SUP 4: 173.24 High Oct 3 and a gap low on the daily chart
The trend structure in EURJPY is bullish. The cross has traded to a fresh cycle high today, confirming once again, a resumption of the primary uptrend. Sights are on 178.94 next, a 1.236 projection of the Jul 31 - Sep 29 - Oct 2 price swing. Moving average studies remain in a bull-mode position, highlighting a dominant uptrend. Initial support to watch lies at 176.23, the 20-day EMA.
AUDUSD TECHS: Bullish Short-Term Conditions
- RES 4: 0.6707 High Sep 17 and a bull trigger
- RES 3: 0.6660 High Sep 18
- RES 2: 0.6644/46 76.4% of the Sep-Oct bear leg / 2.0% 10-dma Env.
- RES 1: 0.6618 High Oct 29
- PRICE: 0.6578 @ 08:08 GMT Oct 30
- SUP 1: 0.6544 50-day EMA
- SUP 2: 0.6493 Low Oct 24
- SUP 3: 0.6440 Low Oct 14
- SUP 4: 0.6415 Low Aug 21 / 22 and a key key support
A bull cycle in AUDUSD remains intact and this week’s climb reinforces current conditions. The break higher signals scope for gains towards 0.6629, the Sep 30 and Oct 1 high. Clearance of this level would strengthen the bullish condition. On the downside, support to watch lies at 0.6544, the 50-day EMA. A reversal lower and a clear break of the EMA would undermine the current bullish phase.
USDCAD TECHS: Has Pierced The 50-Day EMA
- RES 4: 1.4200 Round number resistance
- RES 3: 1.4167 50.0% retracement of the Feb 3 - Jun 16 bear leg
- RES 2: 1.4111 High Apr 10
- RES 1: 1.4039/80 High Oct 24 / 16 and the bull trigger
- PRICE: 1.3944 @ 08:11 GMT Oct 30
- SUP 1: 1.3888 Low Oct 29
- SUP 2: 1.3844 Bull channel base drawn from the Jul 23 low
- SUP 3: 1.3769 Low Sep 19
- SUP 4: 1.3727 Low Aug 29 and a bear trigger
A short-term bear leg in USDCAD remains intact and the pair traded lower Wednesday. Price has traded through 1.3916, the 50-day EMA. A clear break of this level would signal scope for a deeper retracement and potentially expose a channel support at 1.3844. The bull channel is drawn from the Jul 23 low. Note that the trend condition remains bullish and the move down is considered corrective. Key resistance is at 1.4080, the Oct 16 high.
FIXED INCOME
BUND TECHS: (Z5) Monitoring Support At The 50-Day EMA
- RES 4: 130.80 High Jun 13 and key resistance
- RES 3: 130.63 1.500 proj of the Sep 3 - 10 - 25 price swing
- RES 2: 130.07/59 High Oct 24 / 17 and the bull trigger
- RES 1: 129.73 High Oct 28
- PRICE: 129.29 @ 05:54 GMT Oct 30
- SUP 1: 129.21 Low Oct 28
- SUP 2: 129.11 50-day EMA
- SUP 3: 128.52 76.4% retracement of the Sep 25 - Oct 17 Bull leg
- SUP 4: 128.25 Low Oct 7
A short-term bear cycle in Bund futures remains intact for now. The move down that started on Oct 17 is considered corrective and this has allowed an overbought trend condition to unwind. The next important support to watch lies at the 50-day EMA, currently at 129.11. A clear break would signal scope for a deeper retracement. A reversal would refocus attention on the key resistance at 130.59, the Oct 17 high. First resistance is 129.73, Oct 28 high.
BOBL TECHS: (Z5) Bear Cycle Intact
- RES 4: 119.000 Round number resistance
- RES 3: 118.970 High Oct 17 and key resistance
- RES 2: 118.770 High Oct 22
- RES 1: 118.360/600 High Oct 28 / 24
- PRICE: 118.1180 @ 06:06 GMT Oct 30
- SUP 1: 118.060 LOw Oct 29
- SUP 2: 118.043 61.8% retracement of the Sep 25 - Oct 17 bull cycle
- SUP 3: 117.900 Low Oct 10
- SUP 4: 117.824 76.4% retracement of the Sep 25 - Oct 17 bull cycle
Bobl futures traded in a volatile manner yesterday. Price remains closer to the current bear cycle lows. The move down that started Oct 17 is - for now - considered corrective and is allowing an overbought trend condition to unwind. Support around the 50-day EMA, at 118.162, has been breached. This signals scope for a deeper retracement. Initial resistance is at 118.360, the Oct 28 high.
SCHATZ TECHS: (Z5) Trading At Its Recent Lows
- RES 4: 107.348 50.0% retracement of Apr 7 - Sep 25 bear leg (cont)
- RES 3: 107.320 High Oct 17 and the bull trigger
- RES 2: 107.235 High Oct 22
- RES 1: 107.111/175 50-day EMA / High Oct 24
- PRICE: 107.035 @ 06:19 GMT Oct 30
- SUP 1: 117.020 Low Oct 28
- SUP 2: 107.014 76.4% retracement of the Sep 25 - Oct 17 bull leg
- SUP 3: 106.995 Low Oct 8
- SUP 4: 106.965 Low Oct 6
A short-term bear cycle in Schatz futures remains intact and the contract is trading at its recent lows. For now, the current bear cycle that started Oct 17 is considered corrective and is allowing a recent overbought trend condition to unwind. The extension lower exposes 107.014, a Fibonacci retracement, and the next important support. On the upside, initial resistance is at 107.111, the 50-day EMA.
GILT TECHS: (Z5) Bullish Conditions
- RES 4: 94.24 1.618 proj of the Sep 3 - 11 - 26 price swing
- RES 3: 94.00 Round number resistance
- RES 2: 93.95 1.500 proj of the Sep 3 - 11 - 26 price swing
- RES 1: 93.96 High Oct 28
- PRICE: 93.78 @ Close Oct 29
- SUP 1: 93.15 Low Oct 27
- SUP 2: 92.54 20-day EMA
- SUP 3: 91.88 50-day EMA
- SUP 4: 91.60 Low Oct 14
The trend outlook in Gilt futures is unchanged, it remains bullish and a fresh cycle high on Tuesday reinforces current conditions. Note too that MA studies are in a bull-mode position, highlighting a dominant uptrend. Sights are 94.00 next. A break of this level would pave the way for an extension towards 94.24, a Fibonacci projection The contract is overbought, a pullback would allow this condition to unwind. Firm support to watch 92.54, the 20-day EMA.
BTP TECHS: (Z5) Trend Outlook Remains Bullish
- RES 4: 123.14 1.764 proj of the Sep 3 - 11 - 25 price swing
- RES 3: 122.81 1.618 proj of the Sep 3 - 11 - 25 price swing
- RES 2: 122.53 1.500 proj of the Sep 3 - 11 - 25 price swing
- RES 1: 121.94 High Oct 17 / 24 and the bull trigger
- PRICE: 121.45 @ Close Oct 29
- SUP 1: 120.74 High Aug 5 and a recent breakout level
- SUP 2: 120.47 50-day EMA
- SUP 3: 119.48 Low Oct 7
- SUP 4: 119.07 Low Sep 25t
Bullish trend conditions in BTP futures remain intact and short-term weakness is - for now - considered corrective. Recent gains resulted in a break of resistance at 120.74, the Aug 5 high and a bull trigger. The breach highlights a range breakout. The bull trigger is 121.94, the Oct 17 / 24 high. Initial firm support to watch is 120.74, the Aug 5 high. Note that the contract is overbought, a deeper pullback would allow this condition to unwind.
EQUITIES
EUROSTOXX50 TECHS: (Z5) Northbound
- RES 4: 5800.00 Round number resistance
- RES 3: 5787.50 Bull channel top drawn from the Aug 1 low
- RES 2: 5777.41 1.382 proj of the Aug 1 - 22 - Sep 2 price swing
- RES 1: 5742.00 High Oct 29
- PRICE: 5714.00 @ 06:33 GMT Oct 30
- SUP 1: 5640.59 20-day EMA
- SUP 2: 5552.20 50-day EMA
- SUP 3: 5433.00 Bear channel base drawn from the Aug 1 low
- SUP 4: 5497.00 Low Oct 14
The trend structure in Eurostoxx 50 futures remains bullish. This week’s fresh cycle high’s reinforces a bull theme and the move higher maintains the rising price sequence of higher highs and higher lows. Note too that moving average studies are in a bull-mode position, highlighting a dominant medium-term uptrend. Sights are on 5777.41, a Fibonacci projection. First support lies at 6740.59, the 20-day EMA.
E-MINI S&P: (Z5) Bull Cycle Extends
- RES 4: 7000.00 Psychological round number
- RES 3: 6993.12 3.500 proj of the Aug 20 - 28 - Sep 2 price swing
- RES 2: 6974.04 3.382 proj of the Aug 20 - 28 - Sep 2 price swing
- RES 1: 6953.75 Intraday high
- PRICE: 6925.00 @ 07:24 GMT Oct 30
- SUP 1: 6812.25/6780.35 High Oct 9 / 20-day EMA
- SUP 2: 6676.22 50-day EMA
- SUP 3: 6540.25 Low Oct 10 and a key short-term support
- SUP 4: 6506.50 Low Sep 5
The trend condition in S&P E-Minis remains bullish and price is trading higher this week. The fresh cycle high confirms a resumption of the primary uptrend and maintains the bullish price sequence of higher highs and higher lows. Sights are on 6974.04 next, a Fibonacci projection point. Initial firm support to watch lies at 6748.48, the 20-day EMA. A pullback would be considered corrective.
COMMODITIES
BRENT TECHS: (F6) Resistance Remains Exposed
- RES 4: $71.45 - 76.4% retracement of the Jun 23 - Oct 20 bear leg
- RES 3: $70.69 - High Jul 30
- RES 2: $69.29 - High Sep 26 and a key resistance
- RES 1: $65.98 - High Oct 9
- PRICE: $63.93 @ 07:08 GMT Oct 30
- SUP 1: $63.37/59.97 - Low Oct 24 / 20 and the bear trigger
- SUP 2: $58.72 - Low May 5
- SUP 3: $57.99 - Low Apr 9 and a key support
- SUP 4: $56.05 - 2.00 proj of the Jul 30 - Aug 13 - Sep 26 price swing
A short-term corrective bull cycle in Brent futures remains intact for now. The contract has traded through the 50-day EMA, at $64.73. Clearance of this hurdle signals scope for a stronger recovery. The next hurdle to monitor is $65.98, the Oct 9 high. A clear breach of this level would expose key resistance at $69.29, the Sep 26 high. Key support and the bear trigger has been defined at $59.97, the Oct 20 low.
WTI TECHS: (Z5) Corrective Phase
- RES 4: $71.47 - High Jun 23 and a key medium-term resistance
- RES 3: $67.68 - High Jul 30
- RES 2: $65.77/68.43 - High Sep 26 and key resistance
- RES 1: $62.59 - High Oct 24
- PRICE: $60.17 @ 07:18 GMT Oct 30
- SUP 1: $59.64/55.96 - Low Oct 23 / 20
- SUP 2: $54.85 - Low May 5
- SUP 3: $54.16 - Low Apr 9 and a key support
- SUP 4: $53.23 - 1.764 proj of the Jul 30 - Aug 13 - Sep 26 price swing
Recent gains in WTI futures appear corrective for now, however, note that price has recently traded through the 50-day EMA, currently at $60.09. The breach of this average signals scope for a stronger recovery. A resistance at $62.34, the Oct 8 high, has also been pierced. A clear break of it would expose key resistance at $65.77, the Sep 26 high. Key support and the bear trigger has been defined at $55.96, the Low Oct 20.
GOLD TECHS: Corrective Phase Still In Play
- RES 4: $4404.9 - 3.500 proj of the May 15 - Jun 16 - 30 price swing
- RES 3: $4400.0 - Round number resistance
- RES 2: $4161.4/4381.5 - High Oct 22 / High Oct 20 and bull trigger
- RES 1: $4026.8 - 20-day EMA
- PRICE: $3967.0 @ 07:25 GMT Oct 30
- SUP 1: $3886.6 - Low Oct 28 $3900.0 -
- SUP 2: $3846.3 - 50-day EMA
- SUP 3: $3800.00 Round number support
- SUP 4: $3751.3 - 50.0% retracement of the May 15 - Oct 20 bull leg
A fresh cycle low this week in Gold highlights an extension of the bear cycle that started Oct 20. Note that the trend is overbought and the deeper retracement is allowing this condition to unwind. The 20-day EMA has been breached, signalling scope for a deeper retracement, towards the 50-day EMA, at $3846.3. Key resistance and the bull trigger has been defined at $4381.5, the Oct 20 high. Initial resistance is at $4161.4, the Oct 22 high.
SILVER TECHS: Support At The 50-Day EMA Remains Intact For Now
- RES 4: $56.153 2.500 proj of the Aug 20 - Sep 16 - 17 price swing
- RES 3: $55.444 2.382 proj of the Aug 20 - Sep 16 - 17 price swing
- RES 2: $55.000 - Round number resistance
- RES 1: $49.456/54.480 - High Oct 23 / 17 and the bull trigger
- PRICE: $47.639 @ 08:16 GMT Oct 30
- SUP 1: $45.727 - 50-day EMA
- SUP 2: $41.135 - Low Sep 17
- SUP 3: $40.000 - Round number support
- SUP 4: $38.087 - Low AUg 27
Trend signals in Silver are bullish and the latest sharp pullback is considered corrective. Note that the trend condition has been in overbought territory and the deeper retracement is allowing this to unwind. Attention is on support at the 50-day EMA, at $45.727. It remains intact but a break would signal scope for a deeper retracement. Key resistance has been defined at $54.480, the Oct 17 high. Initial resistance is at $49.456, the Oct 23 high.