MNI DAILY TECHNICAL ANALYSIS - USDJPY Bounce Holds
Price Signal Summary – USDJPY Bounce Holds
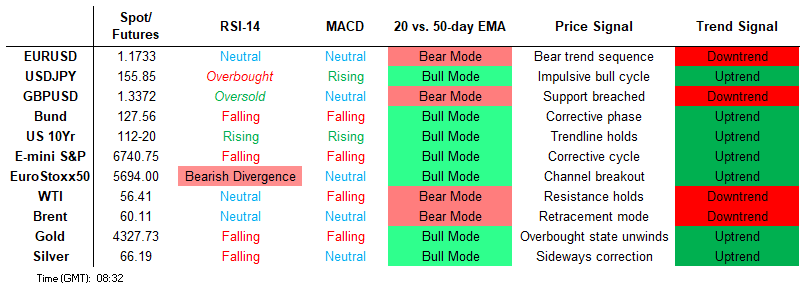
- The pullback in S&P E-Minis has resulted in a breach of both the 20- and 50-day EMAs. This strengthens a short-term bear theme and signals scope for a deeper retracement of the recent bull phase between Nov 21 - Dec 11. A bull cycle in EUROSTOXX 50 futures remains intact and the latest pullback is considered corrective. The first key support to watch lies at 5650.52, the 50-day EMA.
- A bull cycle in GBPUSD remains intact and for now, a short-term pullback is considered corrective. A fresh cycle high on Tuesday reinforces the bull theme. Attention is on 1.3452 (pierced), 61.8% of the Sep 17 - Nov 4 bear leg. The trend structure in USDJPY remains bullish. This is highlighted by moving average studies that are in a bull-mode position. Support to watch lies at 154.09, the 50-day EMA. A bear theme in USDCAD remains intact, reinforced by the recent bearish extension. The move down maintains the current price sequence of lower lows and lower highs and signals scope for a test of 1.3727 next.
- The trend structure in Gold remains bullish. The bear phase between Oct 20 - 28 appears to have been a correction and note that the recovery since Oct 28 signals the end of that corrective cycle. A bearish theme in WTI futures remains intact. Moving average studies are in a bear-mode position, highlighting a dominant downtrend. A key support and the bear trigger at $56.11, the Oct 17 low has been breached.
- Bund futures are trading in a range and remain in consolidation mode. A bear cycle is intact. Scope is seen for an extension towards the 127.00 handle. Key short-term resistance is 128.75, the Dec 3 high. Recent activity in Gilt futures highlights 90.50, the Dec 16 low, and 91.93, the Nov 27 high, as two important short-term directional triggers. A clear breach of support at 90.50 would signal scope for a deeper retracement towards 89.86.
[CROSS ASSET] MNI Tech Trend Monitor
- We refresh our Global Tech Trend Monitor, adding longer-term techs for USDMXN, EURHUF, EURGBP, Bitcoin and the USD Index as well as refreshing levels for Spot Gold, Silver, USDJPY, UK Gilt Yields and the Europe Banking Stock Index (SX7E).
See full document here: https://emedia.marketnews.com/marketnewsintl/TechTrendMonitorNov.pdf
FOREIGN EXCHANGE
EURUSD TECHS: Short-Term Reversal Signal
- RES 4: 1.1919 - High Sep 17 and a key M/T resistance
- RES 3: 1.1848 High Sep 18
- RES 2: 1.1813 76.4% retracement of the Sep 17 - Nov 5 bear leg
- RES 1: 1.1804 High Dec 16 and a key short-term resistance
- PRICE: 1.1746 @ 05:57 GMT Dec 18
- SUP 1: 1.1703/1666 Low Dec 17 / 20-day EMA
- SUP 2: 1.1638 50-day EMA
- SUP 3: 1.1615 Low Dec 9
- SUP 4: 1.1591 Low Dec 2
The trend in EURUSD remains bullish, however, a short-term reversal signal has appeared on the daily chart highlighting scope for a correction - Tuesday’s candle pattern is a shooting star formation. A correction would allow an overbought trend condition to unwind. The first important support lies at 1.1666, the 20-day EMA. Key short-term resistance has been defined at 1.1804, the Dec 16 high.
GBPUSD TECHS: Support Remains Intact
- RES 4: 1.3527 High Oct 1
- RES 3: 1.3471 High Oct 17
- RES 2: 1.3456 High Dec 16
- RES 1: 1.3452 61.8% retracement of the Sep 17 - Nov 4 bear leg
- PRICE: 1.3367 @ 06:28 GMT Dec 18
- SUP 1: 1.3312 Low Dec 17
- SUP 2: 1.3293 50-day EMA
- SUP 3: 1.3180 Low Dec 2
- SUP 4: 1.3125 Low Nov 26
A bull cycle in GBPUSD remains intact and for now, a short-term pullback is considered corrective. A fresh cycle high on Tuesday reinforces the bull theme. Attention is on 1.3452 (pierced), 61.8% of the Sep 17 - Nov 4 bear leg. A clear break of this hurdle would strengthen a bull theme and open 1.3527, the Oct 1 high. Initial firm support is 1.3293, the 50-day EMA. A breach of this EMA would highlight a possible reversal.
EURGBP TECHS: Bullish Outlook
- RES 4: 0.8865 High Nov 14 and a bull trigger
- RES 3: 0.8840 High Nov 20
- RES 2: 0.8818 High Nov 26
- RES 1: 0.8802 High Dec 2 and a key near-term resistance
- PRICE: 0.8786 @ 06:38 GMT Dec 18
- SUP 1: 0.8747/21 Low Dec 16 / 9
- SUP 2: 0.8706 76.4% retracement of the Oct 8 - Nov 14 bull leg
- SUP 3: 0.8670 Low Oct 21
- SUP 4: 0.8656 Low Oct 8 and a key support
The bull cycle in EURGBP that started Dec 9 remains intact and highlights a possible reversal of the Nov 14 - Dec 9 corrective phase. Key short-term support has been defined at 0.8721, the Dec 9 low. A break of this level would signal scope for a deeper retracement, towards 0.8706, a Fibonacci retracement. Initial firm resistance to watch is unchanged at 0.8802, the Dec 2 high. Clearance of this hurdle would be a bullish development.
USDJPY TECHS: Trading Above Support
- RES 4: 158.87 High Jan 10 and a key resistance
- RES 3: 158.29 2.618 projection of the Sep 17 - 26 - Oct 1 price swing
- RES 2: 158.00 Round number resistance
- RES 1: 156.95/157.89 High Dec 9 / High Nov 20 and bull trigger
- PRICE: 155.88 @ 07:05 GMT Dec 18
- SUP 1: 154.09 50-day EMA
- SUP 2: 153.62 Low Nov 14
- SUP 3: 152.82 Low Nov 7
- SUP 4: 151.54 Low Oct 29
The trend structure in USDJPY remains bullish. This is highlighted by moving average studies that are in a bull-mode position. Support to watch lies at 154.09, the 50-day EMA. A clear breach of this average would undermine the bull theme and signal scope for a deeper corrective pullback. This would open 153.62, the Nov 14 low. For bulls, a resumption of gains would open 158.00.
EURJPY TECHS: Trend Needle Points North
- RES 4: 184.84 Bull channel top drawn from the Feb 28 low
- RES 3: 184.34 2.236 proj of the Jul 31 - Sep 29 - Oct 2 price swing
- RES 2: 183.85 1.0% 10-dma envelope
- RES 1: 183.17 Intraday high
- PRICE: 182.94 @ 08:01 GMT Dec 18
- SUP 1: 181.40 20-day EMA
- SUP 2: 179.33 50-day EMA
- SUP 3: 177.15 Low Nov 10
- SUP 4: 176.71 Bull channel support drawn from the Feb 28 low
The trend structure in EURJPY remains bullish and a fresh cycle high today reinforces current conditions. Moving average studies are in a bull-mode position, highlighting a dominant uptrend. Recent gains resulted in a breach of 182.01, the Nov 20 high and a bull trigger, confirming a resumption of the trend. Sights are on 184.84, the top of a bull channel drawn from the Feb 28 low. First key support is 181.40, the 20-day EMA.
AUDUSD TECHS: Pierces The 20-Day EMA
- RES 4: 0.6759 High Oct 11 ‘24
- RES 3: 0.6723 High Oct 21 ‘24
- RES 2: 0.6707 High Sep 17 and a key resistance
- RES 1: 0.6686 High Dec 10
- PRICE: 0.6607 @ 08:05 GMT Dec 18
- SUP 1: 0.6593 Intraday low
- SUP 2: 0.6564 50-day EMA
- SUP 3: 0.6517 Low Nov 27
- SUP 4: 0.6466/21 Low Nov 26 / 21
The trend condition in AUDUSD remains bullish and the latest pullback appears corrective and is allowing a recent overbought condition to unwind. Support at the 20-day EMA, at 0.6596, has been pierced. The 50-day average lies at 0.6564. The area between the two averages represents a key short-term support zone. A resumption of gains would refocus attention on key resistance at 0.6707, the Sep 17 high and bull trigger.
USDCAD TECHS: Bear Cycle Intact
- RES 4: 1.4051 High Nov 28
- RES 3: 1.3931 50-day EMA
- RES 2: 1.3882 20-day EMA
- RES 1: 1.3823 High Dec 11
- PRICE: 1.3775 @ 08:14 GMT Dec 18
- SUP 1: 1.3727 Low Sep17
- SUP 2: 1.3682 76.4% retracement of the Jun 16 - Nov 6 bull cycle
- SUP 3: 1.3637 Low Jul 25
- SUP 4: 1.3576 Low Jul 23
A bear theme in USDCAD remains intact, reinforced by the recent bearish extension. The move down maintains the current price sequence of lower lows and lower highs and signals scope for a test of 1.3727 next, the Sep 17 low. Initial firm resistance to watch is 1.3892, the 20-day EMA. Short-term gains would be considered corrective and would allow an oversold condition to unwind.
FIXED INCOME
BUND TECHS: (H6) Bear Cycle Remains Intact
- RES 4: 129.55 High Nov 26 and key resistance
- RES 3: 129.24 High Dec 1
- RES 2: 128.75 High Dec 3 and a key resistance
- RES 1: 128.16 20-day EMA
- PRICE: 127.52 @ 05:36 GMT Dec 18
- SUP 1: 127.05 Low Dec 10
- SUP 2: 127.00 Round number support
- SUP 3: 126.81 2.764 projection of the Nov 12 - 20 - 26 price swing
- SUP 4: 126.58 3.000 projection of the Nov 12 - 20 - 26 price swing
Bund futures are trading in a range and remain in consolidation mode. A bear cycle is intact. Scope is seen for an extension towards the 127.00 handle. Key short-term resistance is 128.75, the Dec 3 high. Note that the contract is still oversold. A stronger corrective bounce would allow this oversold condition to unwind. The price pattern on Dec 10 is a doji candle - a short-term reversal signal.
BOBL TECHS: (H6) Trend Outlook Remains Bearish
- RES 4: 117.140 High Nov 26 and key resistance
- RES 3: 117.070 High Nov 27
- RES 2: 116.960 High Dec 1
- RES 1: 116.391/770 20-day EMA / High Dec 3
- PRICE: 116.100 @ 06:00 GMT Dec 18
- SUP 1: 115.720 Low Dec 10
- SUP 2: 115.660.4.000 proj of the Nov 6 - 14 - 26 price swing
- SUP 3: 115.600 Round number support
- SUP 4: 115.573 4.236 proj of the Nov 6 - 14 - 26 price swing
The trend set-up in Bobl futures is unchanged, it remains bearish following a recent impulsive sell-off. Short-term gains are considered corrective. Sights are on 115.660 next, a Fibonacci projection. Note that the trend is oversold, a stronger recovery would allow this set-up to unwind. Key resistance is seen at 116.770, the Dec 3 high. Initial resistance to watch is at the 20-day EMA, at 116.391.
SCHATZ TECHS: (H6) Corrective Bounce Extends
- RES 4: 106.975 High Dec 1
- RES 3: 106.945 High Dec 3 and a key short-term resistance
- RES 2: 106.885 Low Dec 2
- RES 1: 106.835 High Dec 8
- PRICE: 106.770 @ 06:12 GMT Dec 18
- SUP 1: 106.630 Low Dec 10
- SUP 2: 106.621 2.236 proj of the Nov 26 - Dec 2 - 3 minor price swing
- SUP 3: 106.600 2.382 proj of the Nov 26 - Dec 2 - 3 minor price swing
- SUP 4: 106.583 2.500 proj of the Nov 26 - Dec 2 - 3 minor price swing
A bear theme in Schatz futures remains intact following the recent impulsive sell-off and short-term gains are considered corrective. Note that on the continuation chart, moving average studies are in a bear-mode position, highlighting a dominant downtrend. Sights are on 106.621 next, a Fibonacci projection. Key short-term resistance has been defined at 106.945, the Dec 3 high. A corrective bounce would allow an oversold trend condition to unwind.
GILT TECHS: (H6) Resistance Remains Intact For Now
- RES 4: 92.55 High Nov 11
- RES 3: 92.31 High Nov 12
- RES 2: 92.00 Round number resistance
- RES 1: 91.78/93 High Dec 17 / High Nov 27
- PRICE: 91.44 @ Close Dec 17
- SUP 1: 91.19/90.50 Low Dec 17 / 16
- SUP 2: 90.28 Low Nov 21
- SUP 3: 90.00 Round number support
- SUP 4: 89.86 Low Nov 19 and the bear trigger
Recent activity in Gilt futures highlights 90.50, the Dec 16 low, and 91.93, the Nov 27 high, as two important short-term directional triggers. A clear breach of support at 90.50 would signal scope for a deeper retracement towards 89.86, the Nov 19 low and a bear trigger. For bulls, a stronger resumption of gains and a breach of 91.93, would instead signal scope for a climb towards resistance at 92.55, the Nov 11 high.
BTP TECHS: (H6) Recovery Appears Corrective
- RES 4: 121.33 High Oct 21 and a key resistance area
- RES 3: 121.37 High Nov 13
- RES 2: 121.24 High Nov 26
- RES 1: 120.34/77 High Dec 17 / 3
- PRICE: 119.85 @ Close Dec 17
- SUP 1: 119.54 Low Dec 12
- SUP 2: 119.13 Low Dec 10 and the bear trigger
- SUP 3: 118.00 Round number support
- SUP 4: 118.84 2.000 proj of the Nov 13 - 20 - 26 price swing
Gains in BTP futures appear corrective. The contract has traded above initial resistance at 120.17, the Nov 20 low. A continuation higher would signal scope for an extension towards 120.77, the Dec 3 high. On the downside, a clear reversal lower would refocus attention on key support at 119.13, the Dec 10 low and a bear trigger. Clearance of this level would confirm a resumption of the downtrend.
EQUITIES
EUROSTOXX50 TECHS: (Z5) Monitoring Support
- RES 4: 5902.82 1.764 proj of the Aug 1 - 22 - Sep 2 price swing
- RES 3: 5858.59 1.618 proj of the Aug 1 - 22 - Sep 2 price swing
- RES 2: 5825.00 High Nov 13 and a key resistance
- RES 1: 5799.00 High Dec 12
- PRICE: 5686.00 @ 06:33 GMT Dec 18
- SUP 1: 5668.00 Intraday low
- SUP 2: 5650.52 50-day EMA
- SUP 3: 5594.00 Low Nov 26
- SUP 4: 5475.00 Low Nov 21 and the bear trigger
A bull cycle in EUROSTOXX 50 futures remains intact and the latest pullback is considered corrective. The first key support to watch lies at 5650.52, the 50-day EMA. A clear break of the average would highlight a potential short-term reversal. This would open 5594.00, the Nov 26 low. For bulls, a resumption of gains would refocus attention on key resistance and the bull trigger at 5825.00, the Nov 13 high.
E-MINI S&P: (H6) Pullback Extends
- RES 4: 7042.67 2.0% Upper Bollinger Band
- RES 3: 7014.00 High Oct 30 and the bull trigger
- RES 2: 6932.25/6988.00 High Dec 15 / 12
- RES 1: 6870.74 20-day EMA
- PRICE: 6787.00 @ 05:56 GMT Dec 18
- SUP 1: 6771.50 Intraday low
- SUP 2: 6737.71 61.8% retracement of the Nov 21 - Dec 11 rally
- SUP 3: 6678.58 76.4% retracement of the Nov 21 - Dec 11 rally
- SUP 4: 6583.00 Low Nov 21
The pullback in S&P E-Minis has resulted in a breach of both the 20- and 50-day EMAs. This strengthens a short-term bear theme and signals scope for a deeper retracement of the recent bull phase between Nov 21 - Dec 11. Sights are on 6737.71, a Fibonacci retracement. Note that the key support and reversal trigger lies at 6583.00, the Nov 21 low. For bulls a resumption of gains would refocus attention on key resistance at 7014.00, the Oct 30 high.
COMMODITIES
BRENT TECHS: (G6) Trades Through Key Support
- RES 4: $70.86 - 76.4% retracement of the Jun 23 - Oct 17 bear leg
- RES 3: $70.33 - High Jul 30
- RES 2: $68.86 - High Sep 26 and a key resistance
- RES 1: 62.85/65.25 - 50-day EMA / High Oct 24
- PRICE: $60.17 @ 07:14 GMT Dec 18
- SUP 1: $58.72 - Low Dec 16
- SUP 2: $58.11 - Low Apr 9 and a key support
- SUP 3: $87.72 - 1.764 proj of the Jul 30 - Aug 13 - Sep 26 price swing
- SUP 4: $56.22 - 2.000 proj of the Jul 30 - Aug 13 - Sep 26 price swing
A bearish theme in Brent futures remains present and this week’s early sell-off reinforces current conditions. Note that MA studies are in a bear-mode condition. Key support and the bear trigger at $59.93, the Oct 20 low, has been breached. Clearance of this level confirms a resumption of the bear cycle and opens $58.11, the Apr 9 low. Key short-term resistance to watch is $65.25, the Oct 24 high. First resistance is $62.85, the 50-day EMA.
WTI TECHS: (G6) Bear Threat Remains Present
- RES 4: $70.16 - High Jun 23 and a key medium-term resistance
- RES 3: $64.97 - High Sep 26
- RES 2: $61.25 - High Oct 24 and a key resistance
- RES 1: $58.94 - 50-day EMA
- PRICE: $56.31 @ 07:25 GMT Dec 18
- SUP 1: $54.89 - Low Dec 16
- SUP 2: $54.71 - Low Apr 9 and a key support
- SUP 3: $53.77 - 1.764 proj of the Jul 30 - Aug 13 - Sep 26 price swing
- SUP 4: $52.27 - 2.000 proj of the Jul 30 - Aug 13 - Sep 26 price swing
A bearish theme in WTI futures remains intact. Moving average studies are in a bear-mode position, highlighting a dominant downtrend. A key support and the bear trigger at $56.11, the Oct 17 low has been breached. Clearance of this level resumes the downtrend and opens $53.77, a Fibonacci projection. Key short-term resistance to watch is $61.25, the Oct 24 high. First resistance is at $58.94, the 50- day EMA.
GOLD TECHS: Trend Structure Remains Bullish
- RES 4: $4404.9 - 3.500 proj of the May 15 - Jun 16 - 30 price swing
- RES 3: $4400.0 - Round number resistance
- RES 2: $4381.5 - High Oct 20 and bull trigger
- RES 1: $4353.5 - High Dec 12
- PRICE: $4333.7@ 07:27 GMT Dec 18
- SUP 1: $4219.4/4097.5 - 20- and 50-day EMA values
- SUP 2: $3998.1 - Low Nov 18
- SUP 3: $3886.6 - Low Oct 28 and a reversal trigger
- SUP 4: $3800.00 Round number support
The trend structure in Gold remains bullish. The bear phase between Oct 20 - 28 appears to have been a correction and note that the recovery since Oct 28 signals the end of that corrective cycle. Key support to watch is the 50-day EMA, at $4097.5. Clearance of this EMA would signal scope for a deeper retracement. Attention is on key resistance and the bull trigger at $4381.5, the Oct 20 high.
SILVER TECHS: Impulsive Bull Wave
- RES 4: $71.771 - 2.618 proj of the Oct 28 - Nov 13 - 21 price swing
- RES 3: $70.000 - Psychological round number
- RES 2: $68.397 - 2.236 proj of the Oct 28 - Nov 13 - 21 price swing
- RES 1: $66.893 - High Dec 17
- PRICE: $66.318 @ 18:16 GMT Dec 18
- SUP 1: $58.964 - 20-day EMA
- SUP 2: $53.873/48.644 - 50-day EMA / Low Nov 21
- SUP 3: $45.557 - Low Oct 28
- SUP 4: $41.135 - Low Sep 17
Trend signals in Silver remain bullish and yesterday’s extension reinforces the current bull theme. Note that moving average studies are in a bull position and this continues to highlight a dominant medium-term uptrend. The metal has also traded through the psychological $60.00 handle. Sights are on $68.397 next, the 2.236 projection of the Oct 28 - Nov 13 - 21 price swing. Initial key support lies at $58.964, the 20-day EMA.