MNI DAILY TECHNICAL ANALYSIS - S/T GBP Gains Seen Corrective
Price Signal Summary – S/T GBP Gains Still Seen Corrective
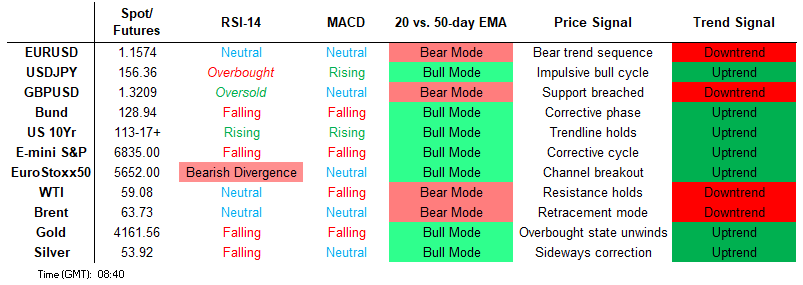
- S&P E-Minis are holding on to their latest gains following the recovery from the Nov 21 low. The climb has resulted in a breach of the 20- and 50- day EMAs. This highlights a bullish development and the likely end of the corrective cycle between Oct 30 and Nov 21. The move higher in EUROSTOXX 50 futures this week undermines a recent bearish theme and the contract is holding on to its gains. The contract has traded above the 20- and 50-day EMAs, signalling scope for a stronger recovery near-term.
- The trend theme in GBPUSD is bearish and short-term gains appear corrective. Price has breached the 20-day EMA and pierced the 50-day EMA, at 1.3260. The trend set-up in USDJPY is bullish and the latest shallow pullback appears corrective. The pair has recently entered overbought territory and a deeper retracement, if seen, would allow this condition to unwind. A bearish theme in AUDUSD remains intact, however, this week’s gains have resulted in a breach of both the 20- and 50-day EMAs. This exposes a short-term trendline resistance at 0.6553, drawn from the Sep 17 high.
- The trend condition in Gold remains bullish and the bear phase between Oct 20 and 28 appears to have been a correction. This allowed a recent overbought condition to unwind. Recent weakness in WTI futures highlights a bearish theme. A resumption of the bear leg would open the key support and the bear trigger at $55.99, the Oct 20 low.
- Recent gains in Bund futures appear corrective. However, the contract has traded through the 50-day EMA, at 129.04, and is holding on to its latest gains. A clear break of the average would signal scope for a stronger recovery. A volatile spike higher in Gilt futures on Wednesday resulted in a breach of some important short-term resistance points. This strengthens a bullish theme and a continuation higher would signal scope for a climb towards resistance at 92.55.
[CROSS ASSET] MNI Tech Trend Monitor - November Refresh
- We refresh our Global Tech Trend Monitor, adding longer-term techs for USDMXN, EURHUF, Bitcoin and the USD Index as well as refreshing levels for Spot Gold, Silver, USDJPY, UK Gilt Yields and the Europe Banking Stock Index (SX7E).
See full document here: https://emedia.marketnews.com/marketnewsintl/TechTrendMonitorNov.pdf
FOREIGN EXCHANGE
EURUSD TECHS: Doji Reversal Signal
- RES 4: 1.1728 High Oct 17
- RES 3: 1.1694 50.0% retracement of the Sep 17 - Nov 5 bear leg
- RES 2: 1.1656 High Nov 13 and key resistance
- RES 1: 1.1613 High Nov 27
- PRICE: 1.1586 @ 06:11 GMT Nov 28
- SUP 1: 1.1491/1469 Low Nov 21 / 5 and the bear trigger
- SUP 2: 1.1425 1.500 proj of the Oct 17 - 22 - 28 price swing
- SUP 3: 1.1392 Low Aug 1 and bear trigger
- SUP 4: 1.1313 Low May 30
The trend structure in EURUSD remains bearish and this week’s recovery appears corrective - for now. The pair has breached both the 20- and 50-day EMAs. Key short-term resistance to monitor is 1.1656, the Nov 13 high and a bull trigger. Clearance of this level would highlight a reversal. Note that yesterday’s candle pattern is a doji - a potential reversal signal. A resumption of weakness would open key support at 1.1469, the Nov 5 low.
GBPUSD TECHS: Monitoring Resistance
- RES 4: 1.3416 High Oct 21
- RES 3: 1.3368 50.0% retracement of the Sep 17 - Nov 4 bear leg
- RES 2: 1.3284 38.2% retracement of the Sep 17 - Nov 4 bear leg
- RES 1: 1.3269 High Nov 27
- PRICE: 1.3225 @ 06:38 GMT Nov 28
- SUP 1: 1.3125 Low Nov 26
- SUP 2: 1.3038/10 Low Nov 20 / Low Nov 4 & 5 and the bear trigger
- SUP 3: 1.2971 1.382 proj of the Sep 17 - 25 - Oct 1 price swing
- SUP 4: 1.2945 50.0% retracement of the Jan 13 - Jul 1 bull leg
The trend theme in GBPUSD is bearish and short-term gains appear corrective. Price has breached the 20-day EMA and pierced the 50-day EMA, at 1.3260. A clear break of the 50-day average would highlight a stronger bull theme. Moving average studies are in a bear-mode condition, highlighting a dominant downtrend. 1.3010, the Nov 4 / 5 low, is the trigger for a resumption of the bear leg. Note that yesterday's pattern is a doji - a bear reversal signal.
EURGBP TECHS: Has Pierced The 50-Day EMA
- RES 4: 0.8893 2.000 proj of the Sep 15 - 25 - Oct 8 price swing
- RES 3: 0.8875 High Apr 25
- RES 2: 0.8868 61.8% retracement of the 2022 - 2024 bear leg
- RES 1: 0.8818/65 High Nov 16 / 14
- PRICE: 0.8758 @ 06:55 GMT Nov 28
- SUP 1: 0.8746 Low Nov 27
- SUP 2: 0.8726 Low Oct 28
- SUP 3: 0.8706 76.4% retracement of the Oct 8 - Nov 14 bull leg
- SUP 4: 0.8656 Low Oct 8 and a key support
The trend set-up in EURGBP remains bullish and recent weakness is considered corrective. Moving average studies are in a bull-mode position, highlighting a dominant uptrend. Note that the cross has pierced the 50-day EMA, at 0.8752. A clear break of this average would signal scope for a deeper corrective pullback. For bulls, a resumption of gains would refocus attention on 0.8868, a Fibonacci retracement point.
USDJPY TECHS: Corrective Cycle Still In Play
- RES 4: 158.87 High Jan 10 and a key resistance
- RES 3: 158.29 2.618 projection of the Sep 17 - 26 - Oct 1 price swing
- RES 2: 158.00 Round number resistance
- RES 1: 157.89 High Nov 20
- PRICE: 156.39 @ 07:11 GMT Nov 28
- SUP 1: 155.16 20-day EMA
- SUP 2: 154.42 Low Nov 17
- SUP 3: 152.94 50-day EMA
- SUP 4: 151.54 Low Oct 29
The trend set-up in USDJPY is bullish and the latest shallow pullback appears corrective. The pair has recently entered overbought territory and a deeper retracement, if seen, would allow this condition to unwind. Support to watch is 155.16, the 20-day EMA. Moving average studies remain in a bull-mode position, highlighting a dominant uptrend. A resumption of the trend would open 158.00.
EURJPY TECHS: Trend STructure Remains Bullish
- RES 4: 183.37 Bull channel top drawn from the Feb 28 low
- RES 3: 184.34 2.000 proj of the Jul 31 - Sep 29 - Oct 2 price swing
- RES 2: 183.07 1.764 proj of the Jul 31 - Sep 29 - Oct 2 price swing
- RES 1: 182.01 High Nov 20 and the bull trigger
- PRICE: 181.18 @ 07:19 GMT Nov 28
- SUP 1: 179.58 20-day EMA
- SUP 2: 178.98/177.45 Low Nov 14 / 50-day EMA
- SUP 3: 175.71 Low Nov 5
- SUP 4: 175.03 Bull channel support drawn from the Feb 28 low
A bullish theme in EURJPY remains intact and the cross is holding on to its latest gains. Recent fresh cycle highs confirm a resumption of the trend and maintain the bullish price sequence of higher highs and higher lows. Sights are on 183.37, the top of a bull channel drawn from the Feb 28 low. First key support lies at 179.40, the 20-day EMA. A pullback would be considered corrective.
AUDUSD TECHS: Trendline Resistance Intact For Now
- RES 4: 0.6660 High Sep 18
- RES 3: 0.6640 76.4% retracement of the Sep 17 - Nov 21 bear leg
- RES 2: 0.6618 High Oct 29 and a key near-term resistance
- RES 1: 0.6553/6580 T-line drawn from the Sep 17 high / High Nov 13
- PRICE: 0.6524 @ 08:02 GMT Nov 28
- SUP 1: 0.6466/21 Low Nov 26 / 21
- SUP 2: 0.6415 Low Aug 21 / 22 and a bear trigger
- SUP 3: 0.6404 38.2% retracement of the Apr 9 - Sep 17 bull cycle
- SUP 4: 0.6373 Low Jun 23
A bearish theme in AUDUSD remains intact, however, this week’s gains have resulted in a breach of both the 20- and 50-day EMAs. This exposes a short-term trendline resistance at 0.6553, drawn from the Sep 17 high. A clear break of this line would highlight a stronger reversal. On the downside, a resumption of weakness would refocus attention on 0.6415, the Aug 21 / 22 low and the trigger for a stronger downleg.
USDCAD TECHS: Support At The 50-Day EMA Remains Exposed
- RES 4: 1.4314 61.8% retracement of the Feb 3 - Jun 16
- RES 3: 1.4200 Channel top drawn from Jul 23 low
- RES 2: 1.4140/67 High Nov 5 / 50.0% of the Feb 3 - Jun 16 bear leg
- RES 1: 1.4131 High Nov 21
- PRICE: 1.4032 @ 16:21 GMT Nov 27
- SUP 1: 1.4025/3993 Intraday low / 50-day EMA
- SUP 2: 1.3923 Bull channel base drawn from the Jul 23 low
- SUP 3: 1.3888 Low Oct 29 and a key support
- SUP 4: 1.3833 Low Sep 24
The move lower in USDCAD Wednesday once again highlights a short-term bear threat. Support to watch is at the 50-day EMA, at 1.3995. A clear breach of the average would strengthen a bear theme and expose the base of a bull channel at 1.3923. The channel is drawn from the Jul 23 low. On the upside, a resumption of gains would open 1.4140, the Nov 5 high and the next key resistance.
FIXED INCOME
BUND TECHS: (Z5) Holding On To The Bulk Of Its Recent Gains
- RES 4: 130.07 High Oct 24
- RES 3: 129.74 61.8% retracement of the Oct 17 - Nov 20 bear leg
- RES 2: 129.40 High Nov 13
- RES 1: 129.21 High Nov 26
- PRICE: 129.00 @ 05:52 GMT Nov 28
- SUP 1: 128.72/37 Low Nov 24 / 20 and the short-term bear trigger
- SUP 2: 128.25 Low Oct 7
- SUP 3: 127.88 Low Sep 25 and key support
- SUP 4: 127.61 Low Sep 3 and a key M/T support
Recent gains in Bund futures appear corrective. However, the contract has traded through the 50-day EMA, at 129.04, and is holding on to its latest gains. A clear break of the average would signal scope for a stronger recovery and open 129.40, the Nov 13 high. Key short-term support and the bear trigger to watch lies at 128.37, the Nov 20 low. Clearance of this level would resume the bear leg and open 128.25, the Oct 7 low.
BOBL TECHS: (Z5) Resistance At The 50-Day EMA Remains Intact
- RES 4: 118.600 High Oct 24
- RES 3: 118.360 High Oct 28
- RES 2: 118.270 High Nov 5
- RES 1: 118.088/180 50-day EMA / High Nov 21
- PRICE: 117.980 @ 06:10 GMT Nov 28
- SUP 1: 117.790 Low Nov 20 and the bear trigger
- SUP 2: 117.710 Low Oct 6
- SUP 3: 117.630 Low Oct 1
- SUP 4: 117.470 Low Sep 15 and a key support
The short-term trend theme in Bobl futures remains bearish and short-term gains appear corrective - for now. Recent weakness resulted in a breach of 118.043, 61.8% of the Sep 25 - Oct 17 bull cycle. Note that 117.824, the 76.4% retracement, has been pierced. A resumption of the downleg would open 117.630, the Oct 1 low. Initial firm resistance is at 118.088, the 50-day EMA (pierced). A clear break of it is required to signal a potential reversal.
SCHATZ TECHS: (Z5) Bear Trend Remains Intact
- RES 4: 107.175 High Oct 24
- RES 3: 107.095 High Oct 28 / 31
- RES 2: 107.052 50-day EMA
- RES 1: 107.014 20-day EMA
- PRICE: 106.980 @ 06:24 GMT Nov 28
- SUP 1: 106.945 Low Nov 17
- SUP 2: 106.920 Low Sep 25 and a key support
- SUP 3: 106.900 Round number support
- SUP 4: 106.830 Low Mar 27 (cont.)
The short-term trend condition in Schatz futures is unchanged, it remains bearish and the latest bounce is considered corrective. Recent weakness paves the way for an extension towards 106.920, the Sep 25 low and a key support. Clearance of this level would strengthen a bear theme. Initial firm resistance to watch is at the 50-day EMA, at 107.052. A clear break of this average would highlight a potential reversal.
GILT TECHS: (H6) Bullish Theme
- RES 4: 92.55 High Nov 11
- RES 3: 92.31 High Nov 12
- RES 2: 92.00 Round number resistance
- RES 1: 91.93 High Nov 27
- PRICE: 91.50 @ Close Nov 27
- SUP 1: 90.53 Low Nov 25
- SUP 2: 90.28 Low Nov 21
- SUP 3: 90.00 Round number support
- SUP 4: 89.86 Low Nov 19 and the bear trigger
A volatile spike higher in Gilt futures on Wednesday resulted in a breach of some important short-term resistance points. This strengthens a bullish theme and a continuation higher would signal scope for a climb towards resistance at 92.55, the Nov 11 high. A gap in the daily chart has been filled. Price traded lower yesterday, a stronger reversal would refocus attention on the first important support at 90.53, the Nov 26 low.
BTP TECHS: (Z5) Trend Needle Points North
- RES 4: 123.14 1.764 proj of the Sep 3 - 11 - 25 price swing
- RES 3: 122.81 1.618 proj of the Sep 3 - 11 - 25 price swing
- RES 2: 122.53 1.500 proj of the Sep 3 - 11 - 25 price swing
- RES 1: 121.70/94 High Nov 13 / High Oct 17 / 22 and the bull trigger
- PRICE: 121.40 @ Close Nov 27
- SUP 1: 120.48 Low Nov 20 and key short-term support
- SUP 2: 120.15 50.0% retracement of the Sep 3 - Oct 17 bull leg
- SUP 3: 119.73 61.8% retracement of the Sep 3 - Oct 17 bull leg
- SUP 4: 119.07 Low Sep 25
The trend set-up in BTP futures is bullish and the latest pullback appears to have been a correction. A strong rally this week reinforces a bull theme. Note that the MA studies are in a bull-mode position, highlighting a dominant uptrend. A continuation higher would expose the bull trigger at 121.94, the Oct 17 and 22 high. Key short-term support has been defined at 120.48, the Nov 20 low. A clear breach of this level would resume the recent bear leg.
EQUITIES
EUROSTOXX50 TECHS: (Z5) Bullish Short-Term Theme
- RES 4: 5825.00 High Nov 13 and a key resistance
- RES 3: 5742.40 76.4% retracement of the Nov 13 - 21 bear leg
- RES 2: 5691.30 61.8% retracement of the Nov 13 - 21 bear leg
- RES 1: 5674.00 High Nov 27
- PRICE: 5664.00 @ 06:47 GMT Nov 28
- SUP 1: 5597.61/5475.00 50-day EMA / Low Nov 21 and bear trigger
- SUP 2: 5427.01 61.8% retracement of the Aug 1 - Nov 13 bull cycle
- SUP 3: 5383.00 Low Sep 18
- SUP 4: 5366.00 Low Sep 17
The move higher in EUROSTOXX 50 futures this week undermines a recent bearish theme and the contract is holding on to its gains. The contract has traded above the 20- and 50-day EMAs, signalling scope for a stronger recovery near-term. A continuation would open 5691.30 and 5742.40, Fibonacci retracement points. For bears, a reversal lower would instead expose the key S/T support and bear trigger at 5475.00, the Nov 21 low.
E-MINI S&P: (Z5) Bullish Recovery
- RES 4: 6953.75 High Oct 30 and bull trigger
- RES 3: 6900.50 High Nov 12
- RES 2: 6852.56 76.4% retracement of the Oct 30 - Nov 21 bear leg
- RES 1: 6846.75 High Nov 26
- PRICE: 6835.00 @ 02:44 GMT Nov 28
- SUP 1: 6674.50/6525.00 Low Nov 25 / 21
- SUP 2: 6500.00 Round number support
- SUP 3: 6476.62 23.6% retracement of the Apr 7 - Oct 30 uptrend
- SUP 4: 6427.00 Low Sep 2
S&P E-Minis are holding on to their latest gains following the recovery from the Nov 21 low. The climb has resulted in a breach of the 20- and 50- day EMAs. This highlights a bullish development and the likely end of the corrective cycle between Oct 30 and Nov 21. A continuation higher would signal scope for a move towards the key resistance and bull trigger at 6953.75, the Oct 30 high. Key support lies at 6525.00, the Nov 21 low.
COMMODITIES
BRENT TECHS: (G6) Trading Below Resistance
- RES 4: $70.86 - 76.4% retracement of the Jun 23 - Oct 17 bear leg
- RES 3: $70.33 - High Jul 30
- RES 2: $68.86 - High Sep 26 and a key resistance
- RES 1: $65.25 - High Oct 24
- PRICE: $63.14 @ 07:18 GMT Nov 28
- SUP 1: $59.93 - Low Nov 20 and the bear trigger
- SUP 2: $58.92 - Low May 5
- SUP 3: $58.11 - Low Apr 9 and a key support
- SUP 4: $56.22 - 2.00 proj of the Jul 30 - Aug 13 - Sep 26 price swing
The move down in Brent futures since Nov 11, highlights a bearish theme. A stronger resumption of weakness would expose key support and bear trigger at $59.93, Oct 20 low. Clearance of this level would confirm a continuation of the bear cycle. Note, it is still possible that a bullish corrective cycle is in play. The contract has recovered from its recent lows, a move above $65.25, the Oct 24 high, is required to signal scope for a stronger recovery.
WTI TECHS: (F6) Bear Theme Intact
- RES 4: $71.38 - High Jun 23 and a key medium-term resistance
- RES 3: $67.16 - High Jul 30
- RES 2: $65.33 - High Sep 26 and key resistance
- RES 1: $61.84 - High Oct 24
- PRICE: $59.08 @ 06:00 GMT Nov 28
- SUP 1: $55.99 - Low Oct 20 and bear trigger
- SUP 2: $55.33 - Low May 1
- SUP 3: $54.72 - Low Apr 9 and a key support
- SUP 4: $53.53 - 1.764 proj of the Jul 30 - Aug 13 - Sep 26 price swing
Recent weakness in WTI futures highlights a bearish theme. A resumption of the bear leg would open the key support and the bear trigger at $55.99, the Oct 20 low. Clearance of this level would resume the downtrend. Note that it is still possible a bullish corrective cycle remains in play. The contract has recovered from its latest low, resistance to watch is $61.84, the Oct 24 high. A clear break of this hurdle would signal scope for a stronger correction.
GOLD TECHS: Bullish Trend Structure
- RES 4: $4404.9 - 3.500 proj of the May 15 - Jun 16 - 30 price swing
- RES 3: $4381.5 - High Oct 20 and bull trigger
- RES 2: $4264.7 - 76.4% retracement of the Oct 20 - 28 correction
- RES 1: $4245.2 - High Nov 13
- PRICE: $4182.9 @ 07:30 GMT Nov 28
- SUP 1: $3981.6 - 50-day EMA
- SUP 2: $3886.6 - Low Oct 28 and a reversal trigger
- SUP 3: $3800.00 Round number support
- SUP 4: $3760.9 - Low Sep 29
The trend condition in Gold remains bullish and the bear phase between Oct 20 and 28 appears to have been a correction. This allowed a recent overbought condition to unwind. Key support to watch lies at the 50-day EMA, at $3981.6. Clearance of this EMA would signal scope for a deeper retracement. The first short-term bull trigger has been defined at $4245.23, the Nov 13 high.
SILVER TECHS: Sights Are On The Bull Trigger
- RES 4: $56.153 2.500 proj of the Aug 20 - Sep 16 - 17 price swing
- RES 3: $55.444 2.382 proj of the Aug 20 - Sep 16 - 17 price swing
- RES 2: $55.000 Round number resistance
- RES 1: $54.480 - High Oct 17 and the bull trigger
- PRICE: $53.751 @ 08:16 GMT Nov 28
- SUP 1: $50.817 - 20-day EMA
- SUP 2: $48.550/45.557 - 50-day EMA / Low Oct 28
- SUP 3: $41.135 - Low Sep 17
- SUP 4: $38.087 - Low Aug 27
Trend signals in Silver remain bullish. Support to watch lies at the 50-day EMA, at $48.550. A clear breach of this average would signal scope for a deeper retracement. On the upside, attention is on key resistance and the bull trigger at $54.480, the Oct 17 high. Clearance of this level would confirm a resumption of the primary uptrend and open $55.444, a Fibonacci projection.