MNI DAILY TECHNICAL ANALYSIS - S&P Stretches Winning Streak
Price Signal Summary – E-mini S&P Stretches Winning Streak
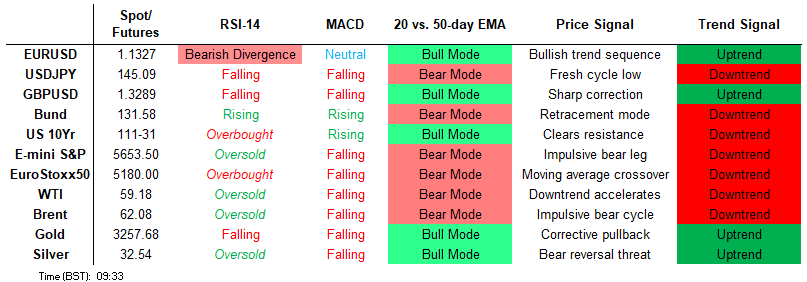
- The recovery in the e-mini S&P continues, with a tenth consecutive session of higher highs - the longest winning streak of the year so far, underpinning the short-term positive momentum for stocks. Eurostoxx 50 futures maintain a positive tone and are building on recent gains. The contract has cleared the 20-day EMA and pierced the 50-day EMA, at 5102.56. A clear break of this average would strengthen the current bull cycle.
- The trend set-up in USDCAD is unchanged and remains bearish. A fresh cycle low on Apr 21 reinforces the bear cycle and signals scope for a continuation near-term. The recent pullback in EURUSD is considered corrective and the trend structure is unchanged, it remains bullish. MA studies are in a bull-mode position signalling a dominant uptrend, and the latest move down is allowing an overbought condition to unwind. A mid-session rally in EURGBP was sold into the Wednesday close, keeping the sell-on-rallies theme intact and highlighting a continuation of the current bear cycle.
- Gold is off lows early Friday, but remains within range of recent lows after markets pressuring prices toward multi-week lows and opening a sizeable gap with the recent high. A medium-term bearish trend in WTI futures strengthened this week and the latest move down reinforces this theme, signalling the end of the correction between Apr 9 - 23. The correction allowed an oversold trend condition to unwind.
- Bund futures continue to trade below their recent highs. Despite the latest move down, a bull cycle remains in play and the sell-off between Apr 7 - 9 is considered corrective. Gilt futures gapped higher at the open Thursday, extending the current bull cycle that started Apr 9. 92.63, the Apr 8 high, has recently been breached, and Thursday’s early gains have resulted in a clear break of 93.44.
FOREIGN EXCHANGE
EURUSD TECHS: Corrective Cycle
- RES 4: 1.1696 1.618 proj of the Feb 28 - Mar 18 - 27 price swing
- RES 3: 1.1625 1.500 proj of the Feb 28 - Mar 18 - 27 price swing
- RES 2: 1.1608 High Nov 9 2021
- RES 1: 1.1440/1573 High Apr 23 / 21 and the bull trigger
- PRICE: 1.1328 @ 08:59 BST May 1
- SUP 1: 1.1271 Low May 1
- SUP 2: 1.1261 20-day EMA and a key support
- SUP 3: 1.1144/1025 High Apr 3 / 50-day EMA and a pivot level
- SUP 4: 1.0805 Low Apr 3
The recent pullback in EURUSD is considered corrective and the trend structure is unchanged, it remains bullish. MA studies are in a bull-mode position signalling a dominant uptrend, and the latest move down is allowing an overbought condition to unwind. A resumption of gains would open 1.1608 next, the Nov 9 2021 high. Key support is at the 20-day EMA, at 1.1251. A break of this average would signal scope for a deeper corrective pullback.
GBPUSD TECHS: Bearish Candle Pattern
- RES 4: 1.3605 1.236 proj of the Feb 28 - Apr 3 - 7 price swing
- RES 3: 1.3550 High Feb 24 ‘22
- RES 2: 1.3510 1.236 proj of the Feb 28 - Apr 3 - 7 price swing
- RES 1: 1.3444 High Apr 28 / 29
- PRICE: 1.3299 @ 09:01 BST May 1
- SUP 1: 1.3260 Low May 1
- SUP 2: 1.3220 20-day EMA
- SUP 3: 1.3041/3025 Low Apr 14 / 50-day EMA
- SUP 4: 1.2807 Low Apr 10
GBP/USD is more stable Friday morning, however the leg lower follows markets taking note of a bearish tweezer top formation on the daily candle chart formed on Monday/Tuesday. This price action marks the first real bearish candle pattern since the rally of the YTD low. Moving average studies remain in a bull-mode position however, signalling a dominant underlying uptrend. Sights are on 1.3510, a Fibonacci projection. Support to watch lies at 1.3220, the 20-day EMA.
EURGBP TECHS: Bear Cycle Extends
- RES 4: 0.8781 2.236 proj of the Mar 3 - 11 - 28 price swing
- RES 3: 0.8768 High Nov 20 ‘23
- RES 2: 0.8624/0.8738 High Apr 21/ High Apr 11 and the bull trigger
- RES 1: 0.8557 High Apr 28
- PRICE: 0.8518 @ 09:03 BST May 2
- SUP 1: 0.8480 Low May 1
- SUP 2: 0.8477/62 61.8% of the Mar 28 - Apr 11 rally / 50-day EMA
- SUP 3: 0.8415 76.4% retracement of the Mar 28 - Apr 11 rally
- SUP 4: 0.8316 Low Mar 28 and a key support
A mid-session rally in EUR/GBP was sold into the Wednesday close, keeping the sell-on-rallies theme intact and highlighting a continuation of the current bear cycle. Sights are on 0.8477, a Fibonacci retracement point where a break would strengthen the bearish theme. Support at the 50-day EMA, is at 0.8462. It is still possible that the move down that started Apr 11, is a correction. A reversal and a resumption of gains would open 0.8738, the Apr 11 high and bull trigger.
USDJPY TECHS: Strength Could Mark Start of Reversal
- RES 4: 148.27 High Apr 9
- RES 3: 146.87 50-day EMA
- RES 2: 146.54 Low Mar 11
- RES 1: 145.92 High May 2
- PRICE: 145.09 @ 09:05 BST May 2
- SUP 1: 141.49 Low Apr 23
- SUP 2: 139.79 1.382 proj of the Feb 12 - Mar 11 - 28 price swing
- SUP 3: 138.82 1.500 proj of the Feb 12 - Mar 11 - 28 price swing
- SUP 4: 138.07 Low Jul 28 ‘23
The bounce in USDJPY that started Apr 22 has firmed, working against the view that S/T strength is corrective. Resistance at 144.06, the 20-day EMA, has been broken. A clear break of this level would signal scope for a stronger recovery. Resistance at the 50-day EMA, is at 146.72. Moving average studies remain in a bear-mode position highlighting a dominant downtrend. A resumption of the trend would open 139.79 next, a Fibonacci projection.
EURJPY TECHS: Clears Bull Trigger
- RES 4: 165.94 2.0% 10-dma envelope
- RES 3: 165.43 High Nov 8
- RES 2: 164.90 High Dec 30 ‘24 and a key medium-term resistance
- RES 1: 164.63 High Mar 18 and the bull trigger
- PRICE: 164.36 @ 09:12 GMT May 2
- SUP 1: 161.43/159.48 50-day EMA / Low Apr 9
- SUP 2: 158.30 Low Apr 7 and key support
- SUP 3: 157.02 76.4% retracement of the Feb 28 - Mar 18 bull cycle
- SUP 4: 155.60 Low Low Mar 4
A bullish theme in EURJPY remains intact as prices showed through the bull trigger on the Thursday/Friday rally. Attention is on 164.90, the Dec 30 high and medium-term resistance. Clearance of this hurdle would resume the uptrend. Key short-term support lies at 158.30, the Apr 7 low. A break of it is required to signal scope for a deeper retracement. This would open 157.02, a Fibonacci retracement. First support to watch is 161.57, the 50-day EMA.
AUDUSD TECHS: Consolidation Phase
- RES 4: 0.6550 61.8% retracement of the Sep 30 ‘24 - Apr 9 bear leg
- RES 3: 0.6528 High Nov 29 ‘24
- RES 2: 0.6471 High Dec 9 ‘24
- RES 1: 0.6450 High Apr 29
- PRICE: 0.6417 @ 09:19 BST May 2
- SUP 1: 0.6344/6316 Low Apr 24 / 50-day EMA
- SUP 2: 0.6181 Low Apr 11
- SUP 3: 0.6116 Low Apr 10
- SUP 4: 0.5915 Low Apr 9 and key support
AUDUSD remains inside a consolidation phase, having traded either side of the 0.6400 level for 10 consecutive sessions. The underlying trend remains bullish and the pair is trading close to recent highs. Price has recently breached a key resistance at 0.6409, the Dec 9 ‘24 high. This breach reinforces bullish conditions and signals scope for a continuation higher near-term. Sights are on 0.6471 next, the Dec 9 2024 high. Initial key support to monitor is 0.6316, the 50-day EMA. A clear break of this EMA would be a concern for bulls.
USDCAD TECHS: Trend Needle Points South
- RES 4: 1.4415 High Apr 1
- RES 3: 1.4296 High Apr 7
- RES 2: 1.4087 50-day EMA
- RES 1: 1.3906/3935 High Apr 17 / 20-day EMA
- PRICE: 1.3830 @ 09:21 BST May 2
- SUP 1: 1.3781 Low Apr 21 and the bear trigger
- SUP 2: 1.3744 76.4% retracement of Sep 25 ‘24 - Feb 3 bull run
- SUP 3: 1.3696 Low Oct 10 2024
- SUP 4: 1.3643 Low Oct 9 ‘24
The trend set-up in USDCAD is unchanged and remains bearish. A fresh cycle low on Apr 21 reinforces the bear cycle and signals scope for a continuation near-term. Potential is seen for a move towards 1.3744, a Fibonacci retracement. Moving average studies are in a bear mode position, highlighting a dominant downtrend. First resistance to watch is 1.3943, the 20-day EMA.
FIXED INCOME
BUND TECHS: (M5) Trend Needle Points North
- RES 4: 133.90 1.236 proj of the Mar 25 - Apr 7- 9 price swing
- RES 3: 133.00 round number resistance
- RES 2: 132.56 High Feb 28 and a key resistance
- RES 1: 132.03 High Apr 7 and the bull trigger
- PRICE: 131.52 @ 08:09 BST May 2
- SUP 1: 130.77/129.92 20-day EMA / Low Apr 11
- SUP 2: 129.02 Low Apr 10
- SUP 3: 128.60 Low Apr 9 and a key support
- SUP 4: 128.47 Low Mar 28
Bund futures continue to trade below their recent highs. Despite the latest move down, a bull cycle remains in play and the sell-off between Apr 7 - 9 is considered corrective. Attention is on resistance at 132.03, the Apr 7 high and a bull trigger. Clearance of this level would confirm a resumption of the uptrend and open 132.56, the Feb 28 high. Firm support lies at 128.60, the Apr 9 low. A break of this level would alter the picture.
BOBL TECHS: (M5) Trading Closer To Its Recent Highs
- RES 4: 120.20 High Dec 12 ‘24 (cont)
- RES 3: 120.000 Psychological round number
- RES 2: 119.960 High Apr 7 and the bull trigger
- RES 1: 119.780 High Apr 22
- PRICE: 119.460 @ 08:18 BST May 2
- SUP 1: 119.180 Low Apr 23
- SUP 2: 118.996 20-day EMA
- SUP 3: 118.060 Low Apr 10
- SUP 4: 117.680 Low Apr 9 and a key support
Bobl futures are trading closer to their recent highs and a bull cycle remains in play. The steep sell-off between Apr 7 - 9 is considered corrective. The early April rally resulted in a break of key resistance at 119.040, the Feb 28 high, strengthening bullish conditions. The focus is on the 120.000 handle next. Firm support lies at 117.680, the Apr 9 low. The 20-day EMA, an important short-term support, is at 118.996.
SCHATZ TECHS: (M5) Bull Cycle Remains In Play
- RES 4: 107.812 0.618 proj of the Mar 6 - Apr 7 - 9 price swing
- RES 3: 107.800 Round number resistance
- RES 2: 107.775 High Apr 7 and the bull trigger
- RES 1: 107.735 High Apr 22
- PRICE: 107.495 @ 08:21 BST May 2
- SUP 1: 107.387 20-day EMA
- SUP 2: 107.252 38.2% retracement of the Mar 6 - Apr 7 bull cycle
- SUP 3: 107.125 Low Apr 10
- SUP 4: 106.965 Low Apr 9 and a key support
A bull cycle in Schatz futures remains in play and the latest pullback appears corrective. Sights are on resistance at 107.775, the Apr 7 high and bull trigger. Clearance of 107.775 would confirm a resumption of the uptrend and open 107.812, a Fibonacci projection. Moving average studies remain in a bull-mode position, highlighting a dominant uptrend. Initial firm support to watch lies at 107.387, the 20-day EMA.
GILT TECHS: (M5) Bull Cycle Extends
- RES 4: 94.75 76.4% of the Dec 3 ‘24 - Jan 13 bear leg (cont)
- RES 3: 94.50 High Apr 7 and key resistance
- RES 2: 94.00 Round number resistance
- RES 1: 93.86 Opening High, May 1
- PRICE: 93.60 @ 08:23 BST May 2
- SUP 1: 92.40 20-day EMA
- SUP 2: 91.73/91.43 Low Apr 17 / 15
- SUP 3: 90.47/89.99 Low Apr 11 / 9
- SUP 4: 89.68 Low Jan 15 (cont)
Gilt futures gapped higher at the open Thursday, extending the current bull cycle that started Apr 9. 92.63, the Apr 8 high, has recently been breached, and Thursday’s early gains have resulted in a clear break of 93.44, the 76.4% retracement of the Apr 7-9 sell-off. This strengthens the bull cycle and opens 94.50, the Apr 7 high and a key resistance. On the downside, support to watch is 92.40, the 20-day EMA.
BTP TECHS: (M5) Overbought But Remains Bullish
- RES 4: 121.93 76.4% of the Dec 5 ‘24 - Mar 14 bear leg (cont)
- RES 3: 121.43 1.618 proj of the Mar 14 - Apr 4 - 9 price swing
- RES 2: 121.00 High Feb 7 (cont) and a key resistance
- RES 1: 120.65 1.382 proj of the Mar 14 - Apr 4 - 9 price swing
- PRICE: 120.25 @ 08:26 BST May 2
- SUP 1: 119.60/119.07 Low Apr 23 / 20-day EMA
- SUP 2: 117.28 Low Apr 10
- SUP 3: 116.06 Low Apr 9
- SUP 4: 115.75 Low Apr 14 and a bear trigger
A bull cycle in BTP futures remains intact and the contract is holding on to the bulk of its recent gains. The Apr 24 rally reinforces current bullish conditions. The move higher resulted in the break of key resistance at 120.39, the Feb 28 high. Sights are on 120.65 next, a Fibonacci projection. Firm support to watch lies at 119.07, the 20-day EMA. The contract is overbought, a pullback would unwind this trend condition.
EQUITIES
EUROSTOXX50 TECHS: (M5) Trading At Its Recent Highs
- RES 4: 5341.00 High Mar 27
- RES 3: 5263.01 76.4% retracement of the Mar 3 - Apr 7 bear leg
- RES 2: 5228.63 76.4% retracement of the Mar 20 - Apr 7 bear leg
- RES 1: 5184.00 High May 2
- PRICE: 5176.00 @ 08:29 BST May 2
- SUP 1: 4959.00/4812.00 Low Apr 23 / 16 and a key support
- SUP 2: 4664.00 Low Apr 10
- SUP 3: 4444.00 Low Apr 7 and the bear trigger
- SUP 4: 4336.00 Low Nov 28 ‘23 (cont)
Eurostoxx 50 futures maintain a positive tone and are building on recent gains. The contract has cleared the 20-day EMA and pierced the 50-day EMA, at 5102.56. A clear break of this average would strengthen the current bull cycle and signal scope for a continuation of the corrective uptrend. This would open 5165.00 next, the Apr 3 high. Support to watch lies at 4812.00, the Apr 16 low. Clearance of this level would highlight a reversal.
E-MINI S&P: (M5) Tops 50-Day EMA
- RES 4: 5837.25 High Mar 25 and a bull trigger
- RES 3: 5865.15 200-dma
- RES 2: 5773.25 High Apr 2
- RES 1: 5662.25 High Apr 28
- PRICE: 5656.00 @ 08:35 BST May 2
- SUP 1: 5355.25/5127.25 Low Apr 24 / 21 and a key support
- SUP 2: 4996.43 76.4% retracement of the Apr 7 - 10 bounce
- SUP 3: 4832.00 Low Apr 7 and the bear trigger
- SUP 4: 4760.88 1.618 proj of the Feb 19 - Mar 13 - 25 price swing
The recovery in the e-mini S&P continues, with a tenth consecutive session of higher highs - the longest winning streak of the year so far, underpinning the short-term positive momentum for stocks. The bull cycle that started on Apr 7, remains in play and has breached a number of important short-term resistances. The index has topped 5618.25, the 50-day EMA, opening layered resistance at 5773.25-5774.43.
COMMODITIES
BRENT TECHS: (N5) Bearish Theme Despite Late Bounce
- RES 4: $78.10 - High Jan 15
- RES 3: $75.81 - High Feb 20
- RES 2: $74.63 - High Apr 2 and a bull trigger
- RES 1: $67.93 - 50-day EMA
- PRICE: $62.37 @ 08:43 BST May 2
- SUP 1: $59.30/58.00 - Low May 1 / Low April 9 and the bear trigger
- SUP 2: $56.29 - 2.236 proj of the Feb 20 - Mar 5 - Apr 2 price swing
- SUP 3: $55.10 - 2.382 proj of the Feb 20 - Mar 5 - Apr 2 price swing
- SUP 4: $54.00 - Round number support
Brent futures are off lows, but the bear cycle persists, with prices hitting a new low Thursday. This week’s price action confirms recent gains as corrective and has allowed an oversold condition to unwind. The primary trend direction remains down and sights are on $56.29 a Fibonacci projection. Initial support to watch lies at $61.51, the Apr 10 low. On the upside, the next important resistance to monitor is at the 50-day EMA, at $67.93.
WTI TECHS: (M5) Momentum Shifts Lower
- RES 4: $75.51 - High Jan 15 and a key resistance
- RES 3: $72.56 - High Feb 20
- RES 2: $71.76 - High Apr 2 and key resistance
- RES 1: $65.38 - 50-day EMA
- PRICE: $59.47 @ 08:45 BST May 2
- SUP 1: $56.39/54.67 - Low May 2 / Low April 9 and bear trigger
- SUP 2: $53.72 - 2.236 proj of the Feb 20 - Mar 5 - Apr 2 price swing
- SUP 3: $52.54 - 2.382 proj of the Jan 15 - Feb 4 - 11 price swing
- SUP 4: $50.00 - Psychological round number
A medium-term bearish trend in WTI futures strengthened this week and the latest move down reinforces this theme, signalling the end of the correction between Apr 9 - 23. The correction allowed an oversold trend condition to unwind. A clear resumption of the bear cycle would open $53.72, a Fibonacci projection. Initial support has broken at $58.29, the Apr 29 low. Resistance to watch is $64.87, the 50-day EMA.
GOLD TECHS: Support Tested
- RES 4: $3600.0 - Round number resistance
- RES 3: $3578.0 - 2.000 proj of the Dec 19 - Feb 24 - Feb 28 swing
- RES 2: $3547.9 - 1.764 proj of the Feb 28 - Apr 3 - Apr 7 price swing
- RES 1: $3386.6/3500.1 - High Apr 23 / 22 and the bull trigger
- PRICE: $3260.2 @ 08:51 BST May 2
- SUP 1: $3202.0 - Low May 1
- SUP 2: $3167.8 - High Apr 3 and a recent breakout level
- SUP 3: $3164.3 - 61.8% retracement Apr 7 - Apr 22 upleg
- SUP 4: $3110.0 - 50-day EMA
Gold is off lows early Friday, but remains within range of recent lows after markets pressuring prices toward multi-week lows and opening a sizeable gap with the recent high. The S/T weakness has pressured support at the 20-day EMA at $3243.7, which could begin to signal a short-term top should the price stay fragile. $3167.8 marks the next key downside level, the April 3 high and recent breakout. For now, moving average studies are in a bull-mode position highlighting a dominant uptrend. The next objective is $3547.9, a Fibonacci projection.
SILVER TECHS: Structure Remains Bullish
- RES 4: $36.000 - Round number resistance
- RES 3: $34.903 - High Oct 23 ‘24 and the bull trigger
- RES 2: $34.590 - High Mar 28
- RES 1: $33.686 - High Apr 25
- PRICE: $32.570 @ 08:58 BST May 2
- SUP 1: $31.668 - Low May 2
- SUP 2: $30.577/28.351 - Low Apr 10 / 7 and the bear trigger
- SUP 3: $27.686 - Low Sep 6 ‘24
- SUP 4: $27.180 - Low Aug 14 ‘24
A strong rally in Silver on Apr 23 reinforces the current bullish theme and the metal is holding on to the bulk of its latest gains. Price has cleared $33.117, 76.4% of the Mar 28 - Apr 7 bear leg. This paves the way for a climb towards $34.590, the Mar 28 high. On the downside, initial firm support at $32.087, the Apr 17 low, is being tested. A material break of this level would undermine the bull cycle and highlight a potential reversal.