MNI Daily Technical Analysis - S&P E-Minis Uptrend Is Intact
Price Signal Summary - Trend Needle In S&P E-Minis Points North
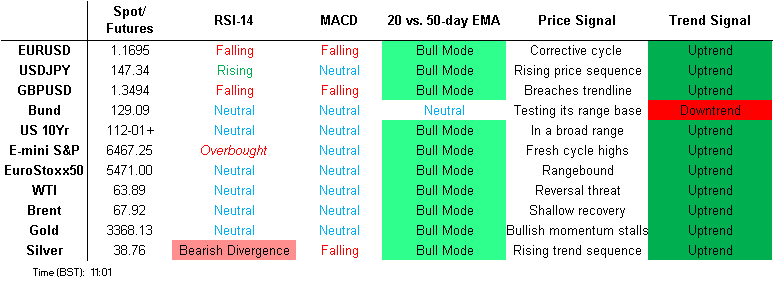
- In the equity space, the dominant uptrend in S&P E-Minis remains intact and Friday’s rally reinforces current conditions. Attention is on 6508.75, the Aug 15 high and the bull trigger. Clearance of this level would confirm a resumption of the uptrend and open 6523.63, a 1.764 projection of the May 23 - Jun 11 - 23 price swing. Support to watch lies at 6298.61, the 50-day EMA. The trend set-up in EUROSTOXX 50 futures is bullish and the contract traded to a fresh short-term cycle high last week. The recent print above the May and July highs strengthens a bull theme and opens 5575.00, the Mar 3 high (cont) and key resistance. Support to watch lies at 5370.47, the 50-day EMA.
- In FX, the trend set-up in EURUSD remains bullish and Friday’s rally reinforces current conditions. Support at the 50-day EMA remains intact, at 1.1596. A clear break of it would signal scope for a deeper retracement and potentially expose key support at 1.1392, the Aug 1 low. For bulls, a stronger resumption of gains would open key resistance and the bull trigger at 1.1829, the Jul 1 high. Strong gains on Friday in GBPUSD signals the end of the recent corrective phase - Friday’s reversal pattern is a bullish engulfing candle. An extension higher would refocus attention on the short-term bull trigger at 1.3595, the Aug 14 high. Clearance of this level would signal scope for a climb towards 1.3636, 76.4% of the bear leg between Jul 1 and Aug 1. Key short-term support has been defined at 1.3391, the Aug 22 low. USDJPY traded sharply lower Friday highlighting a potential bearish threat. The bear trigger has been defined at 146.21, the Aug 14 low. Clearance of this level would reinstate a downtrend and pave the way for an extension towards 145.40, the 50% retracement of the Apr - Aug upleg. For bulls, a resumption of gains would instead open 149.12, 61.8% of the Aug 1 - 14 bear leg.
- On the commodity front, the medium-term trend condition in Gold remains bullish - moving average studies are in a bull-mode position highlighting a dominant uptrend. The sideways direction that has been in place since the Apr peak appears to be a pause in the uptrend. A resumption of gains would open $3439.0, the Aug 23 high. On the downside, first key support to watch lies at $3268.2, the Jul 30 low. First support is $3311.6, the Aug 20 low. In the oil space, a bear cycle in WTI futures remains intact and recent short-term gains appear corrective - for now. A key support at $61.99, the Jun 30 low, has been breached, strengthening a bearish theme. A continuation lower would open $57.71, the May 30 low. Key short-term resistance has been defined at $69.36, the Jul 30 high. Clearance of this level would cancel a bear theme.
- In the FI space, Bund futures are trading above their recent lows. A bear threat is present. The contract recently breached support at 128.84, the Jul 25 low and a bear trigger. Note that 129.00 marks the base of a broad range and a clear range breakout would strengthen a bearish threat. This would open 128.40 initially, the Apr 9 low. Strength above the 50-day EMA of 129.83, is required to signal a reversal.
FOREIGN EXCHANGE
EURUSD TECHS: Friday’s Rally Reinforces A Bull Theme
- RES 4: 1.1851 High Sep 10 2021
- RES 3: 1.1829 High Jul 01 and the bull trigger
- RES 2: 1.1789 High Jul 24
- RES 1: 1.1743 High Aug 22
- PRICE: 1.1703 @ 06:10 BST Aug 25
- SUP 1: 1.1596/1.1528 50-day EMA / Low Aug 5
- SUP 2: 1.1392 Low Aug 1 and bear trigger
- SUP 3: 1.1373 Low Jun 10
- SUP 4: 1.1313 Low May 30
The trend set-up in EURUSD remains bullish and Friday’s rally reinforces current conditions. Support at the 50-day remains intact, at 1.1596. A clear break of it would signal scope for a deeper retracement and potentially expose key support at 1.1392, the Aug 1 low. For bulls, a stronger resumption of gains would open key resistance and the bull trigger at 1.1829, the Jul 1 high.
GBPUSD TECHS: Bullish Engulfing Candle
- RES 4: 1.3753 High High Jul 2
- RES 3: 1.3681 High Jul 4
- RES 2: 1.3636 76.4% retracement of the Jul 1 - Aug1 downleg
- RES 1: 1.3544/3595 High Aug 22 / 14
- PRICE: 1.3510 @ 06:26 BST Aug 25
- SUP 1: 1.3391 Low Aug 22
- SUP 2: 1.3315 61.8% retracement of the Aug 1 - 14 bull leg
- SUP 3: 1.3249 76.4% retracement of the Aug 1 - 14 bull leg
- SUP 4: 1.3142 Low Aug 1 and a key support
Strong gains on Friday in GBPUSD signals the end of the recent corrective phase - Friday’s reversal pattern is a bullish engulfing candle. An extension higher would refocus attention on the short-term bull trigger at 1.3595, the Aug 14 high. Clearance of this level would signal scope for a climb towards 1.3636, the 76.4% retracement of the bear leg between Jul 1 and Aug 1. Key short-term support has been defined at 1.3391, the Aug 22 low.
EURGBP TECHS: Support Remains Exposed
- RES 4: 0.8769 High Jul 28
- RES 3: 0.8744 High Aug 7
- RES 2: 0.8682 High Aug 8
- RES 1: 0.8674 Intraday high
- PRICE: 0.8662 @ 06:47 BST Aug 25
- SUP 1: 0.8597 Low Aug 14
- SUP 2: 0.8562 50.0% retracement May 29 - Jul 28 upleg
- SUP 3: 0.8540 Low Jun 30
- SUP 4: 0.8514 61.8% retracement May 29 - Jul 28 upleg
Recent gains in EURGBP are considered corrective. A stronger recovery would refocus attention on the bull trigger at 0.8769, the Jul 28 high. On the downside, note that recent weakness resulted in a breach of key support at 0.8611, the Jul 31 low. The cross has also pierced the 50-day EMA, at 0.8621. A clear breach of these supports would instead highlight a stronger reversal. This would open 0.8562, a Fibonacci retracement point.
USDJPY TECHS: Monitoring Support
- RES 4: 151.62 61.8% retracement of the Jan 10 - Apr 22 bear leg
- RES 3: 150.92 High Aug 1 and a key resistance
- RES 2: 149.81 76.4% retracement of the Aug 1 - 14 bear leg
- RES 1: 148.78/149.12 High Aug 22 / 61.8% of the Aug 1 - 14 bear leg
- PRICE: 147.26 @ 07:01 BST Aug 25
- SUP 1: 147.26/146.21 20-day EMA / Low Aug 14
- SUP 2: 145.86 Low Jul 24
- SUP 3: 145.40 50% retracement of the Apr - Aug upleg
- SUP 4: 144.80 Trendline drawn from the Apr 22 low
USDJPY traded sharply lower Friday highlighting a potential bearish threat. The bear trigger has been defined at 146.21, the Aug 14 low. Clearance of this level would reinstate a downtrend and pave the way for an extension towards 145.40, a Fibonacci retracement. For bulls, a resumption of gains would instead open 149.12, 61.8% of the Aug 1 - 14 bear leg. Key resistance is far off at 150.92, the Aug 1 high.
EURJPY TECHS: Trend Needle Still Points North
- RES 4: 177.08 2.000 proj of the Feb 28 - Mar 18 - Apr 7 price swing
- RES 3: 175.43 High Jul 11 ‘24 and a key medium-term resistance
- RES 2: 174.86 1.764 proj of the Feb 28 - Mar 18 - Apr 7 price swing
- RES 1: 173.02/97 High Aug 13 / High Jul 28 and the bull trigger
- PRICE: 172.37 @ 07:07 BST Aug 25
- SUP 1: 170.46 50-day EMA
- SUP 2: 169.73/45 Low Jul 31 / 23.6% of the Feb 28 - Jul 28 bull leg
- SUP 3: 168.46 Low Jul 1
- SUP 4: 167.46 Low Jun 23
The trend needle in EURJPY continues to point north and the cross is trading closer to its recent highs. Key support to watch lies at the 50-day EMA at 170.46. A clear break of the average is required to highlight a stronger short-term bearish threat. Moving average studies are in a bull-mode position reinforcing the primary uptrend. Clearance of the Jul 28 high of 173.97, would confirm a continuation of the bull cycle.
AUDUSD TECHS: Finds Support
- RES 4: 0.6688 High Nov 7 ‘24
- RES 3: 0.6677 0.764 proj of the Jun 23 - Jul 11 - 17 price swing
- RES 2: 0.6569/6625 High Aug 14 / 24 and the bull trigger
- RES 1: 0.6524 High Aug 18
- PRICE: 0.6498 @ 08:03 BST Aug 25
- SUP 1: 0.6415 Low Aug 21 / 22
- SUP 2: 0.6373 Low Jun 23
- SUP 3: 0.6354 38.2% retracement of the Apr 9 - Jul 24 upleg
- SUP 4: 0.6323 Low Apr 16
AUDUSD rallied Friday and for now, the pair is holding on to its latest gains. The rally signals the end of the recent corrective phase. A continuation higher would signal scope for a climb towards 0.6569, the Aug 14 high. Key resistance and the bull trigger is at 0.6625, the Aug 24 high. On the downside, support to watch lies at 0.6415, the Aug 21 / 22 low. A clear break would resume the bear leg.
USDCAD TECHS: Trading Above The 50-Day EMA
- RES 4: 1.4111 High Apr 10
- RES 3: 1.4019 38.2% retracement of the Feb 3 - Jun 16 bear leg
- RES 2: 1.3968 High May 20
- RES 1: 1.3925 High Aug 22
- PRICE: 1.3829 @ 08:07 BST Aug 25
- SUP 1: 1.3797 20-day EMA
- SUP 2: 1.3771/22 50-day EMA / Low Aug 22
- SUP 3: 1.3576 Low Jul 23
- SUP 4: 1.3557/40 Low Jul 3 / Low Jun 16 and the bear trigger
Gains last week in USDCAD and the breach of resistance at 1.3879, the Aug 1 high, continues to highlight a bullish phase. Moving average studies have recently crossed and are in a bull-mode position, strengthening the current uptrend. An extension higher would signal scope for a climb towards 1.4019, a Fibonacci retracement. On the downside, support to watch lies at 1.3771, the 50-day EMA.
FIXED INCOME
BUND TECHS: (U5) Trend Condition Remains Bearish
- RES 4: 130.26 High Aug 8
- RES 3: 130.06 High Aug 14
- RES 2: 129.83 50-day EMA
- RES 1: 129.51 20-day EMA
- PRICE: 129.20 @ 05:46 BST Aug 25
- SUP 1: 128.64 Low Aug 15
- SUP 2: 128.40 Low Apr 9
- SUP 3: 128.19 Low Mar 27 (cont)
- SUP 4: 127.83 76.4% retracement of the Mar 11 - Apr 7 bull leg (cont)
Bund futures are trading above their recent lows. A bear threat is present. The contract recently breached support at 128.84, the Jul 25 low and a bear trigger. Note that 129.00 marks the base of a broad range and a clear range breakout would strengthen a bearish threat. This would open 128.40 initially, the Apr 9 low. Strength above the 50-day EMA of 129.83, is required to signal a reversal. Resistance at the 20-day EMA is at 129.51.
BOBL TECHS: (U5) Bearish Theme
- RES 4: 117.710 High Aug 5 and a key resistance
- RES 3: 117.640 High Aug 7
- RES 2: 117.488 50-day EMA
- RES 1: 117.410 High Aug 21
- PRICE: 117.230 @ 05:59 BST Aug 25
- SUP 1: 116.950 Low Aug 15
- SUP 2: 116.840 1.00 proj of the Jun 13 - Jul 11 - 22 price swing
- SUP 3: 116.800 Low Mar 17 (cont)
- SUP 4: 116.637 76.4% retracement of the Mar 6 - Apr 7 bull leg (cont)
A bearish theme in Bobl futures remains intact. A strong sell-off on Aug 15 highlights the bearish threat and moving average studies are in a bear-mode position. The contract has pierced support at 116.970, the Jul 25 low and a bear trigger. A clear breach of this level would set the scene for an extension towards 116.840, a Fibonacci projection. Key short-term resistance is 117.488, the 50-day EMA.
SCHATZ TECHS: (U5) Trend Signals Remain Bearish
- RES 4: 107.300 Round number resistance
- RES 3: 107.245 High Jul 24
- RES 2: 107.164 50-day EMA
- RES 1: 107.086 20-day EMA
- PRICE: 107.020 @ 06:02 BST Aug 25
- SUP 1: 106.985 Low Aug 15
- SUP 2: 107.964 1.618 proj of the Jul 7 - 11 - 22 price swing
- SUP 3: 106.928 1.764 proj of the Jul 7 - 11 - 22 price swing
- SUP 4: 106.870 2.000 proj of the Jul 7 - 11 - 22 price swing
The trend outlook in Schatz futures is unchanged, a bearish theme remains intact. The contract traded lower on August 15, resulting in a print below 106.990, the Aug 12 low. A clear breach of this level would resume the downtrend and mark an extension of the price sequence of lower lows and lower highs. This would open 106.964, a Fibonacci projection. Initial resistance is 107.086, the 20-day EMA.
BTP TECHS: (U5) Trading Inside A Range
- RES 4: 122.35 2.500 proj of the May 14 - 20 - 21 price swing
- RES 3: 122.00 Round number resistance
- RES 2: 121.73 High Jun 13 and the bull trigger
- RES 1: 121.13 High Aug 15
- PRICE: 120.67 @ Close Aug 22
- SUP 1: 119.59 Low Jul 25 and key short-term support
- SUP 2: 119.48 Low May 26
- SUP 3: 118.87 Low May 21
- SUP 4: 118.51 Low May 14 and key support
The primary trend condition in BTP futures remains bullish. However, for now, the contract continues to trade inside a range and the Aug 15 sell-off signals scope for a move towards the lower end of the range. Key support to watch lies at 119.59, the Jul 25 low. A clear break of this level would highlight a range breakout and a bearish threat. Key resistance is unchanged at 121.73, the Jun 13 high.
US 10YR FUTURE TECHS: (U5) Support Remains Intact For Now
- RES 4: 113-23 76.4% retracement of the Sep’24 - Jan’25 sell-off
- RES 3: 113-07 76.4% retracement of the Apr 7 - 11 sell-off
- RES 2: 112-23 High May 1
- RES 1: 112-15+ High Aug 5 and the bull trigger
- PRICE: 111-16+ @ 11:04 BST Aug 22
- SUP 1: 111-12 50-day EMA
- SUP 2: 110-23+/08+ Low Aug 1 / Low Jul 15 & 16
- SUP 3: 110-03 76.4% retracement of the May 22 - Jul 1 bull leg
- SUP 4: 109-28 Low Jun 6 and 11
A bullish theme in Treasury futures remains intact and the contract continues to trade above support around the 50-day EMA, at 111-12. A clear break of this average would expose support at 110-23+, the Aug 1 low. For bulls, gains would refocus attention on 112-15+, the Aug 5 high and the bull trigger. Clearance of this hurdle would resume the uptrend and pave the way for a climb towards 112-23 initially, the May 1 high.
EQUITIES
EUROSTOXX50 TECHS: (U5) Trend Needle Points North
- RES 4: 5575.00 High Mar 3 and a major resistance (cont)
- RES 3: 5568.00 High Mar 6
- RES 2: 5526.00 High Mar 19 / 20 (cont)
- RES 1: 5522.00 High Aug 22
- PRICE: 5487.00 @ 06:19 BST Aug 25
- SUP 1: 5409.83 20-day EMA
- SUP 2: 5370.47 50-day EMA
- SUP 3: 5280.00 Low Aug 7
- SUP 4: 5249.00 Low Aug 5
The trend set-up in Eurostoxx 50 futures is bullish and the contract traded to a fresh short-term cycle high last week. The recent print above the May and July highs strengthens a bull theme and signals scope for a climb towards 5575.00, the Mar 3 high (cont) and key resistance. Moving average studies are in a bull-mode position, highlighting an uptrend. Support to watch lies at 5370.47, the 50-day EMA.
E-MINI S&P: (U5) Bull Phase Intact
- RES 4: 6600.00 Round number resistance
- RES 3: 6572.45 2.0% 10-dma envelope
- RES 2: 6523.63 1.764 proj of the May 23 - Jun 11 - 23 price swing
- RES 1: 6508.75 High Aug 15 and all-time High
- PRICE: 6479.50 @ 07:25 BST Aug 25
- SUP 1: 6362.75 Low Aug 20
- SUP 2: 6313.25 Low Aug 6
- SUP 3: 6298.61 50-day EMA
- SUP 4: 6239.50 Low Aug 1
The dominant uptrend in S&P E-Minis remains intact and Friday’s rally reinforces current conditions. Moving average studies are in a bull-mode position, highlighting a clear uptrend and positive market sentiment. Attention is on 6508.75, the Aug 15 high and the bull trigger. Clearance of this level would confirm a resumption of the uptrend and open 6523.63, a Fibonacci projection. Support to watch lies at 6298.61, the 50-day EMA.
COMMODITIES
BRENT TECHS: (V5) Gains Appear Corrective
- RES 4: $81.07 - 2.764 proj of the Apr 9 - 23 - May 5 price swing
- RES 3: $79.86 - 2.618 proj of the Apr 9 - 23 - May 5 price swing
- RES 2: $77.73 - High Jun 23 and a bull trigger
- RES 1: $72.83 - High Jul 30 and a key resistance
- PRICE: $67.91 @ 07:05 BST Aug 25
- SUP 1: $65.01 - Low Aug 13
- SUP 2: $60.96 - Low May 30
- SUP 3: $58.18 - Low May 5
- SUP 4: $57.74 - Low Apr 9 and a key support
Brent futures are holding on to their most recent gains, however, a bear cycle remains intact. Sights are on $65.01, the Aug 13 low, where a clear break would confirm a resumption of the bear leg and pave the way for an extension lower. A clear breach would open $60.96, the May 30 low. Key short-term resistance has been defined at $72.83, the Jul 30 high. Clearance of this level would cancel a bear theme.
WTI TECHS: (V5) Still Looking For Weakness
- RES 4: $77.85 - 2.794 proj of the Apr 9 - 23 - May 5 price swing
- RES 3: $75.65 - 2.500 proj of the Apr 9 - 23 - May 5 price swing
- RES 2: $74.25 - High Jun 23 and a bull trigger
- RES 1: $63.84/69.36 - 50-day EMA / High Jul 30 and key resistance
- PRICE: $63.83 @ 07:19 BST Aug 25
- SUP 1: $61.29 - Low Aug 13
- SUP 2: $57.71 - Low May 30
- SUP 3: $54.80 - Low May 5
- SUP 4: $54.03 - Low Apr 9 and a key support
A bear cycle in WTI futures remains intact and recent short-term gains appear corrective - for now. A key support at $61.99, the Jun 30 low, has been breached, strengthening a bearish theme. A continuation lower would open $57.71, the May 30 low. Key short-term resistance has been defined at $69.36, the Jul 30 high. Clearance of this level would cancel a bear theme. Initial resistance to watch is $63.84, the 50-day EMA.
GOLD TECHS: Support Remains Intact
- RES 4: $3547.9 - 1.764 proj of the Feb 28 - Apr 3 - Apr 7 price swing
- RES 3: $3500.1 - High Apr 22 and bull trigger
- RES 2: $3451.3 - High Jun 16
- RES 1: $3409.2/3439.0 - High Aug 8 / 23
- PRICE: $3367.7 @ 07:19 BST Aug 25
- SUP 1: $3311.6/3268.2 - Low Aug 20 / Low Jul 30
- SUP 2: $3248.7 - Low Jun 30 and the bear trigger
- SUP 3: $3204.7 - Low May 20
- SUP 4: $3121.0 - Low May 15 and key support
The medium-term trend condition in Gold remains bullish - moving average studies are in a bull-mode position highlighting a dominant uptrend. The sideways direction that has been in place since the Apr peak appears to be a pause in the uptrend. A resumption of gains would open $3439.0, the Aug 23 high. Key resistance and the bull trigger is at $3500.1, the Apr 22 low. On the downside, first key support to watch lies at $3268.2, the Jul 30 low.
SILVER TECHS: Northbound
- RES 4: $41.064 - 1.764 proj of the Apr 7 - 25 - May 15 swing
- RES 3: $40.285 - 1.618 proj of the Apr 7 - 25 - May 15 swing
- RES 2: $40.000 - Psychological round number
- RES 1: $39.655 - 1.500 proj of the Apr 7 - 25 - May 15 swing
- PRICE: $38.924 @ 08:25 BST Aug 25
- SUP 1: $37.229/36.216 - 50-day EMA / Low Jul 31
- SUP 2: $35.285 - Low Jun 24
- SUP 3: $33.940 - 50.0% retracement of the Apr 7 - Jul 23 bull leg
- SUP 4: $32.958 - Low Jun 2
Trend signals in Silver are unchanged and remain bullish. Prices have recently recovered off support at the 50-day EMA, now at $37.229. A clear break of the average is needed to strengthen a short-term bearish threat and allow for a deeper retracement. This would open $35.285, the Jun 24 low. For bulls, the resumption of gains opens the next objective at $39.655 a Fibonacci projection.