MNI DAILY TECHNICAL ANALYSIS - Oil Spike Fades
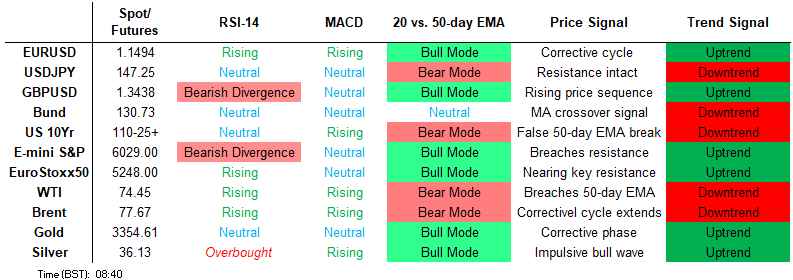
Price Signal Summary – WTI Spike Fades, But Bullish Backdrop Persists
- The trend condition in S&P E-Minis is unchanged, it remains bullish. For now, the most recent shallow pullback is considered corrective. The contract has pierced support at 6007.80, the 20-day EMA. A short-term bear cycle in Eurostoxx 50 futures remains intact and the contract has traded to a fresh cycle low today. Recent weakness has resulted in a breach of the 50-day EMA.
- The latest pullback in GBPUSD appears corrective. Attention is on support at the 50-day EMA, at 1.3357A clear breach of the 50-day EMA would signal scope for a deeper retracement. Today’s rally in USDJPY strengthens a bullish theme. The move higher marks an extension of last week’s gains and highlights a stronger reversal. It also cancels a recent bear theme. A primary downtrend in USDCAD remains intact and recent gains are considered corrective. Resistance at the 20-day EMA, at 1.3713, has been breached. A continuation higher would signal scope for a stronger retracement.
- A bullish theme in Gold remains intact and last week’s pullback is considered corrective. Medium-term trend signals are bullish too - moving average studies are in a bull-mode position, highlighting a dominant uptrend. A bull cycle in WTI futures remains intact and the contract has delivered a fresh cycle high today. Price action is likely to remain volatile near-term, and from a technical standpoint, the trend remains in an extreme overbought position.
- Bund futures remain in consolidation mode and continue to trade below the Jun 13 high. For now, the latest move down appears to be a correction. Key short-term support to watch lies at 130.12, the Jun 5 low. A bullish condition in Gilt futures remains intact and the latest sell-off is - for now - considered corrective. Recent gains marked an extension of the breach of resistance at 91.87, the May 20 high.
FOREIGN EXCHANGE
EURUSD TECHS: Trend Needle Points North
- RES 4: 1.1783 1.764 proj of the Feb 28 - Mar 18 - 27 price swing
- RES 3: 1.1696 1.618 proj of the Feb 28 - Mar 18 - 27 price swing
- RES 2: 1.1685 76.4% retracement of the Jan ‘21 - Sep ‘22 downleg
- RES 1: 1.1544/1631 High Jun 20 / 12 and the bull trigger
- PRICE: 1.1491 @ 06:00 BST Jun 23
- SUP 1: 1.1444 20-day EMA
- SUP 2: 1.1310/1.1210 50-day EMA and a pivot level / Low May 29
- SUP 3: 1.1131 Low May 16
- SUP 4: 1.1065 Low May 12 and a reversal trigger
The trend set-up in EURUSD is unchanged and remains bullish. Recent weakness still appears corrective. The climb on Jun 12 resulted in a breach of 1.1573, the Apr 21 high. This strengthens the bullish theme and confirms a resumption of this year's uptrend. Scope is seen for a climb towards 1.1696, a Fibonacci projection. Initial firm support to watch lies at 1.1444, the 20-day EMA. The 50-day EMA lies at 1.1310.
GBPUSD TECHS: Monitoring Support At The 50-Day EMA
- RES 4: 1.3800 Round number resistance
- RES 3: 1.3757 1.618 proj of the Feb 28 - Apr 3 - 7 price swing
- RES 2: 1.3681 1.500 proj of the Feb 28 - Apr 3 - 7 price swing
- RES 1: 1.3511/3632 High Jun 20 / 13 and the bull trigger
- PRICE: 1.3428 @ 06:49 BST Jun 23
- SUP 1: 1.3383 Low Jun 19
- SUP 2: 1.3361 50-day EMA
- SUP 3: 1.3267 Trendline support drawn from the Jan 13 low
- SUP 4: 1.3140 Low May 12 and key support
The latest pullback in GBPUSD appears corrective. Attention is on support at the 50-day EMA, at 1.3357A clear breach of the 50-day EMA would signal scope for a deeper retracement. Trend signals remain bullish - moving average studies are in a bull-mode position highlighting a dominant uptrend. Key resistance and the bull trigger has been defined at 1.3632, the Jun 13 high. A break of this hurdle would resume the primary uptrend.
EURGBP TECHS: Holding On To Its Gains
- RES 4: 0.8648 76.4% retracement of the Apr 11 - May 29 downleg
- RES 3: 0.8624 High Apr 21
- RES 2: 0.8592 61.8% retracement of the Apr 11 - May 29 downleg
- RES 1: 0.8575 Intraday high
- PRICE: 0.8569 @ 07:26 BST Jun 23
- SUP 1: 0.8488/8465 20- and 50-day EMA values
- SUP 2: 0.8407/8356 Low Jun 4 / Low May 29 and the bear trigger
- SUP 3: 0.8327 1.382 proj of the Apr 11 - 16 - 21 price swing
- SUP 4: 0.8316 Low Mar 28 and a key support
A bullish theme in EURGBP remains intact and the cross is holding on to its gains. The recent breach of the 50-day EMA highlighted a stronger reversal. This signals scope for a climb towards 0.8592 next, a Fibonacci retracement. On the downside, support to watch lies at 0.8465, the 50-day EMA. Clearance of this level would instead highlight a possible reversal. Support at the 20-day EMA is at 0.8488.
USDJPY TECHS: Rally Extends
- RES 4: 150.49 High Apr 2
- RES 3: 149.28 High Apr 3
- RES 2: 148.65 High May 12 and a reversal trigger
- RES 1: 147.67 High May 14
- PRICE: 147.32 @ 07:34 BST Jun 23
- SUP 1: 146.30 Intraday low
- SUP 2: 145.08 50-day EMA
- SUP 3: 144.66 20-day EMA
- SUP 4: 142.80 Low Jun 13
Today’s rally in USDJPY strengthens a bullish theme. The move higher marks an extension of last week’s gains and highlights a stronger reversal. It also cancels a recent bear theme. The climb exposes key resistance at 148.65, the May 12 high and a reversal trigger. Clearance of this level would confirm a resumption of the bull cycle that started Apr 22. Support to watch lies at 145.08, the 50-day EMA.
EURJPY TECHS: Bull Cycle Extension
- RES 4: 171.09 High Jul 23 ‘24
- RES 3: 170.47 76.4% Fibonacci retracement for Jul - Aug ‘24 downleg
- RES 2: 169.91 1.236 proj of the Feb 28 - Mar 18 - Apr 7 price swing
- RES 1: 169.67 Intraday high
- PRICE: 169.26 @ 08:07 BST Jun 23
- SUP 1: 167.46 Intraday low
- SUP 2: 165.55 20-day EMA
- SUP 3: 164.95 Low Jun 13
- SUP 4: 164.04 50-day EMA
The trend set-up in EURJPY remains bullish and today’s strong start to this week’s session, reinforces a bullish theme. The cross has recently cleared 166.69, the Oct 31 ‘24 high. This signals scope for an extension towards 170.47, a key Fibonacci retracement point. Note that the cross is overbought, a pullback would unwind this condition. Support to watch lies at 165.55, the 20-day EMA.
AUDUSD TECHS: Trades Through The 50-Day EMA
- RES 4: 0.6700 76.4% retracement of the Sep 30 ‘24 - Apr 9 bear leg
- RES 3: 0.6688 High Nov 7 ‘24
- RES 2: 0.6603 High Nov 11 ‘24
- RES 1: 0.6479/6552 20-day EMA / High June 16 and the bull trigger
- PRICE: 0.6418 @ 08:18 BST Jun 23
- SUP 1: 0.6398 Intraday low
- SUP 2: 0.6357 Low May 12
- SUP 3: 0.6309 38.2% retracement of the Apr 9 - Jun 16 bull cycle
- SUP 4: 0.6275 Low Apr 14
The medium-term trend set-up in AUDUSD is unchanged, the outlook remains bullish. However, a corrective cycle is in play and this has resulted in a break of support around the 50-day EMA, at 0.6435. A clear break of this average would signal scope to a deeper correction and open 0.6357, the May 12 low. Clearance of this support would highlight a stronger reversal. Initial resistance to watch is 0.6479, the 20-day EMA.
USDCAD TECHS: Approaching The 50-Day EMA
- RES 4: 1.4111 High Apr 4
- RES 3: 1.4016 High May 12 and 13 and a key resistance
- RES 2: 1.3828/1.3920 50-day EMA / High May 21
- RES 1: 1.3747 High Jun 19
- PRICE: 1.3760 @ 08:24 BST Jun 23
- SUP 1: 1.3635 Low Jun 18
- SUP 2: 1.3540/3525 Low Jun 16 / 1.0% 10-dma envelope
- SUP 3: 1.3503 1.618 proj of the Feb 3 - 14 - Mar 4 price swing
- SUP 4: 1.3473 Low Oct 2 2024
A primary downtrend in USDCAD remains intact and recent gains are considered corrective. Resistance at the 20-day EMA, at 1.3713, has been breached. A continuation higher would signal scope for a stronger retracement and expose pivot resistance at the 50-day EMA, at 1.3828. Key support and the bear trigger has been defined at 1.3540, the Jun 16 low. A break of this price point would resume the downtrend.
FIXED INCOME
BUND TECHS: (U5) Support Intact For Now
- RES 4: 132.42 2.000 proj of the May 14 - 20 - 22 price swing
- RES 3: 132.00 Round number resistance
- RES 2: 131.95 High Jun 13 and the bull trigger
- RES 1: 131.27 61.8% retracement of the Jun 13 - 16 downleg
- PRICE: 130.76 @ 05:38 BST Jun 23
- SUP 1: 130.17 Low Jun 16
- SUP 2: 130.12 Low Jun 5 a key short-term support
- SUP 3: 129.30 Low May 22
- SUP 4: 128.97 Low May 14 and a reversal trigger
Bund futures remain in consolidation mode and continue to trade below the Jun 13 high. For now, the latest move down appears to be a correction. Key short-term support to watch lies at 130.12, the Jun 5 low. A break of this level would highlight a stronger reversal and undermine the bullish theme. This would open 129.30, the May 22 low. Key short-term resistance and the bull trigger, has been defined at 131.95, the Jun 13 high.
BOBL TECHS: (U5) Support Remains Exposed
- RES 4: 118.649 1.382 proj of the May 21 - Jun 3 - Jun 5 price swing
- RES 3: 118.531 1.236 proj of the May 21 - Jun 3 - Jun 5 price swing
- RES 2: 118.390 High Jun 13 and a bull trigger
- RES 1: 118.065 61.8% retracement of the Jun 13 - 16 downleg
- PRICE: 117.810 @ 06:28 BST Jun 23
- SUP 1: 117.530 Low Jun 5 and a key near-term support
- SUP 2: 117.470 Low May 21
- SUP 3: 117.470 Low May 21
- SUP 4: 116.660 Low Mar 27
Bobl futures remain in a bull cycle, however, the contract continues to trade below its Jun 13 high. The latest pullback has exposed key short-term support at 117.530, the Jun 5 low. A break of this level would highlight a stronger reversal and cancel the recent bull theme. This would open 117.470, the May 21 low. Key short-term resistance has been defined at 118.390, the Jun 13 high. Clearance of this level would be bullish.
SCHATZ TECHS: (U5) Support Remains Exposed
- RES 4: 107.690 High Apr 30
- RES 3: 107.610 High May 23 and a key near-term resistance
- RES 2: 107.430/475 High Jun 13 / High May 27
- RES 1: 107.304 20-day EMA
- PRICE: 107.240 @ 06:38 BST Jun 23
- SUP 1: 107.195/185 Low Jun 6 / 16
- SUP 2: 107.125 Low May 12 and a key support
- SUP 3: 107.000 Round number support
- SUP 4: 106.890 2.000 proj of the May 23 - 29 - 30 price swing
Schatz futures are still in consolidation and remain below the Jun 13 high. Support to watch lies at 107.195, the Jun 6 low. It has been pierced, a clear break of this level would reinstate a bearish threat and signal scope for an extension towards 107.125, the May 12 low. On the upside, clearance of 107.470, the May 30 high, is required to strengthen a bullish condition. First key resistance is 107.430, the Jun 13 high.
GILT TECHS: (U5) Pullback Considered Corrective
- RES 4: 94.15 2.000 proj of the May 22 - 27 - 29 price swing
- RES 3: 94.00 Round number resistance
- RES 2: 93.73 1.764 proj of the May 22 - 27 - 29 price swing
- RES 1: 93.13./93.68 61.8% of Jun 13 - 16 downleg / High Jun 13
- PRICE: 92.69 @ Close Jun 20
- SUP 1: 92.34 20-day EMA
- SUP 2: 92.23 Low Jun 16
- SUP 3: 91.56 Low Jun 9
- SUP 4: 91.44 Low Jun 8
A bullish condition in Gilt futures remains intact and the latest sell-off is - for now - considered corrective. Recent gains marked an extension of the breach of resistance at 91.87, the May 20 high. This signals scope for a test of 93.73, a Fibonacci projection point. Note the uptrend is in overbought territory, a deeper pullback would unwind this position. Initial firm support lies at 92.34, the 20-day EMA.
BTP TECHS: (U5) Trend Structure Remains Bullish
- RES 4: 122.71 2.764proj of the May 14 - 20 - 21 price swing
- RES 3: 122.35 2.500 proj of the May 14 - 20 - 21 price swing
- RES 2: 122.00 Round number resistance
- RES 1: 121.73 High Jun 13 and the bull trigger
- PRICE: 120.61 @ Close Jun 20
- SUP 1: 120.15 Low Jun 5
- SUP 2: 119.48 Low May 26
- SUP 3: 118.87 Low May 21
- SUP 4: 118.51 Low May 14 and key support
The trend condition in BTP futures is unchanged, it remains bullish and the latest pullback appears corrective. Recent gains reinforce a bull theme and maintain the price sequence of higher highs and higher lows. Sights are on the 122.00 handle next. Key support to watch lies at 118.51, the May 14 low. A clear break of this level would highlight a reversal. First support is 120.15, the Jun 5 low.
EQUITIES
EUROSTOXX50 TECHS: (U5) Bear Cycle Remains In Play
- RES 4: 5486.00 High May 20 and a key bull trigger
- RES 3: 5456.00 High Jun 11
- RES 2: 5403.00 High Jun 12
- RES 1: 5343.47 20-day EMA
- PRICE: 5222.00 @ 07:05 BST Jun 23
- SUP 1: 5194.00 Intraday low
- SUP 2: 5182.00 Low May 2
- SUP 3: 5100.94 38.2% retracement of the Apr 7 - May 20 bull leg
- SUP 4: 5078.00 Low Apr 30
A short-term bear cycle in Eurostoxx 50 futures remains intact and the contract has traded to a fresh cycle low today. Recent weakness has resulted in a breach of the 50-day EMA. Price has also traded through 5279.00, May 23 low. The clear break of both support points signals a S/T top and scope for a deeper retracement. Sights are on 5182.00, the May 2 low and 5100.94, a Fibonacci retracement. Initial resistance is 5343.47, the 20-day EMA.
E-MINI S&P: (U5) Shallow Correction
- RES 4: 6200.00 1.500 proj of the Apr 7 - 10 - 21 price swing
- RES 3: 6172.50 High Feb 24
- RES 2: 6134.00 High Feb 26
- RES 1: 6128.75 High Jun 11 and the bull trigger
- PRICE: 6009.25 @ 07:45 BST Jun 23
- SUP 1: 5906.79 50-day EMA
- SUP 2: 5811.50 Low May 23
- SUP 3: 5645.75 Low May 7
- SUP 4: 5500.00 Low Apr 30
The trend condition in S&P E-Minis is unchanged, it remains bullish. For now, the most recent shallow pullback is considered corrective. The contract has pierced support at 6007.80, the 20-day EMA. A clear breach of this average would suggest potential for a deeper retracement and expose the 50-day EMA, at 5906.79. Key short-term resistance and the bull trigger has been defined at 6128.75, the Jun 11 high.
COMMODITIES
BRENT TECHS: (Q5) Bull Cycle Still In Play
- RES 4: $85.00 - Round number resistance
- RES 3: $83.46 - 2.764 proj of the Apr 9 - 23 - May price swing
- RES 2: $82.13 - 2.618 proj of the Apr 9 - 23 - May price swing
- RES 1: $81.40 - Intraday high
- PRICE: $78.07 @ 06:00 BST Jun 23
- SUP 1: $74.41/70.41 - Low Jun 18 / 13
- SUP 2: $67.99 - 50-day EMA
- SUP 3: $62.09 - Low May 30
- SUP 4: $57.78 - Low Apr 9 and a key support
A bull cycle in Brent futures is in play and the contract has traded to a fresh cycle high today. Price action is likely to remain volatile near-term and from a technical standpoint, the trend remains in an extreme overbought position. A continuation higher would expose $82.13, a Fibonacci projection. A firm short-term support is seen at $70.41, the Jun 13 low. A clear breach of this level would signal scope for a deeper retracement.
WTI TECHS: (Q5) Fresh Cycle High
- RES 4: $82.62 - 3.000 proj of the Apr 9 - 23 - May 5 price swing
- RES 3: $80.43 - 2.764 proj of the Apr 9 - 23 - May 5 price swing
- RES 2: $80.00 - Psychological round number
- RES 1: $78.40 - Intraday high
- PRICE: $74.93 @ 05:04 BST Jun 23
- SUP 1: $71.33/67.11 - Low Jun 18 / 13
- SUP 2: $64.35 - 50-day EMA
- SUP 3: $58.87 - Low May 30
- SUP 4: $54.13 - Low Apr 9 and a key support
A bull cycle in WTI futures remains intact and the contract has delivered a fresh cycle high today. Price action is likely to remain volatile near-term, and from a technical standpoint, the trend remains in an extreme overbought position. A continuation higher would expose the $80.00 handle. A firm support is noted at $67.11, the Jun 13 low. A breach of this level would signal scope for a deeper retracement.
GOLD TECHS: MA Studies Highlight A Dominant Uptrend
- RES 4: $3578.0 - 2.000 proj of the Dec 19 - Feb 24 - Feb 28 swing
- RES 3: $3547.9 - 1.764 proj of the Feb 28 - Apr 3 - Apr 7 price swing
- RES 2: $3500.1 - High Apr 22 and bull trigger
- RES 1: $3451.3 - High Jun 16
- PRICE: $3355.2 @ 08:10 BST Jun 23
- SUP 1: $3338.8/3282.7 - Low Jun 12 / 50-day EMA
- SUP 2: $3204.7 - Low May 20
- SUP 3: $3121.0 - Low May 15 and key support
- SUP 4: $3100.0 - Round number support
A bullish theme in Gold remains intact and last week’s pullback is considered corrective. Medium-term trend signals are bullish too - moving average studies are in a bull-mode position, highlighting a dominant uptrend. Resistance at $3435.6, the May 7 high, has recently been pierced. A clear break of this level would strengthen the uptrend and open $3500.1, the Apr 22 all-time high. Initial key support to monitor is $3282.7, the 50-day EMA.
SILVER TECHS: Retracement Mode
- RES 4: $39.026 - 1.382 proj of the Apr 7 - 25 - May 15 price swing
- RES 3: $38.246 - 1.236 proj of the Apr 7 - 25 - May 15 price swing
- RES 2: $38.000 - Round number resistance
- RES 1: $37.317 - High Jun 18
- PRICE: $36.109 @ 08:26 BST Jun 23
- SUP 1: $35.487 - 20-day EMA
- SUP 2: $34.242/31.651 - 50-day EMA / Low May 15
- SUP 3: $30.915/28.351 - Low Apr 11 / 7 and the bear trigger
- SUP 4: $27.686 - Low Sep 6 ‘24
A bull wave in Silver remains in play and the latest pullback is - for now - considered corrective. The metal has recently traded through a resistance at $34.903, the Oct 23 ‘24 high and a key bull trigger. The clear break of it marks an important medium-term bullish development. Sights are on the $38.00 handle next. On the downside, initial support to watch lies at $35.487, the 20-day EMA.