MNI DAILY TECHNICAL ANALYSIS - New Gold Cycle High
Price Signal Summary - New Gold Cycle High
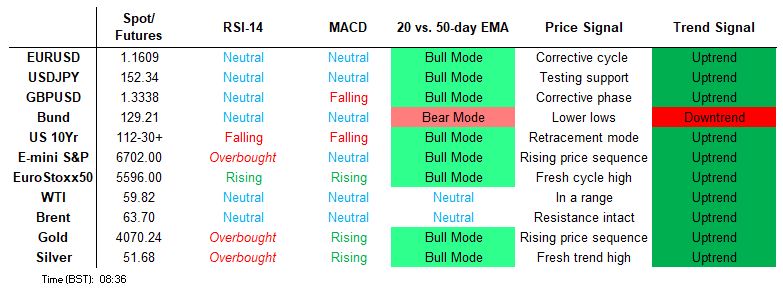
- A sharp sell-off in S&P E-Minis on Friday is - for now - considered corrective. The contract has found support below the 50-day EMA, currently at 6598.55. Friday’s low of 6940.25 has been defined as a key short-term support. The trend condition in Eurostoxx 50 futures is unchanged, the direction is up and the latest pullback is - for now - considered corrective. The key support zone to monitor is 5549.76 - 5474.21, the area between the 20- and 50-day EMAs.
- A short-term bear condition in GBPUSD remains intact and last week’s extension down has strengthened this condition. The pair has breached a key short-term support at 1.3333, the Sep 3 low. The underlying bullish trend condition in USDJPY remains intact and Friday’s pullback is for now, considered corrective. Note that the trend is overbought and a deeper retracement would allow this overbought set-up to unwind. A sharp sell-off in AUDUSD on Friday resulted in a break of 0.6521, the Sep 26 low, and 0.6484, the 76.4% retracement of the Aug 21 - Sep 17 bull leg. This undermines the recent bullish theme and instead signals scope for a deeper retracement.
- A bull cycle in Gold remains intact and today’s fresh cycle marks a bullish start to this week’s session. The move higher maintains the price sequence of higher highs and higher lows. A bearish theme in WTI futures remains intact. Friday’s move down confirmed a resumption of the bear leg - support at $60.40, the Oct 2 low, has been breached.
- Bund futures rallied sharply higher on Friday confirming a resumption of the recovery that started Sep 25. The move higher reinforces a bullish theme and attention is on the next key resistance at 129.44. Gilt futures rallied sharply higher on Friday confirming a resumption of the recovery that started Sep 25. The move higher reinforces a bullish theme and attention is on the next key resistance at 129.44.
[GLOBAL] MNI Tech Trend Monitor - Highlighting Key Longer-Term Trends:
MNI Tech Trend Monitor: https://emedia.marketnews.com/marketnewsintl/MNITechTrendMonitor.pdf
We introduce the MNI Tech Trend Monitor - This document highlights a selection of key longer-term trends that we have identified in markets that could be reaching inflection points, trend reversals/extensions or technically significant levels.
Covering:
- UK Gilt 10y Yield
- UK Gilt 30y Yield
- ICE USD Index
- Europe Banking Stock Index (SX7E)
FOREIGN EXCHANGE
EURUSD TECHS: Corrective Bear Leg Intact
- RES 4: 1.1919 High Sep 17 and a bull trigger
- RES 3: 1.1820 High Sep 23
- RES 2: 1.1779 High Oct 1 and a key short-term resistance
- RES 1: 1.1692 20-day EMA
- PRICE: 1.1618 @ 06:10 BST Oct 13
- SUP 1: 1.1542 Low Oct 9
- SUP 2: 1.1516 76.4% retracement of the Aug 1 - Sep 17 bull leg
- SUP 3: 1.1392 Low Aug 1 and bear trigger
- SUP 4: 1.1313 Low May 30
EURUSD is trading closer to its recent lows. A short-term corrective bear cycle remains intact. Last week’s sell-off resulted in a breach of the 50-day EMA and support at 1.1646, the Sep 25 low, exposing 1.1516, a Fibonacci retracement. Note that MA studies are in a bull-mode position. This continues to highlight a dominant medium-term uptrend. Initial firm resistance is 1.1779, the Oct 1 high. A break of this level would signal a bull reversal.
GBPUSD TECHS: Bearish Condition
- RES 4: 1.3789 High Jul 1 and key resistance
- RES 3: 1.3726 High Sep 17
- RES 2: 1.3661 High Sep 18
- RES 1: 1.3443/3527 20-day EMA / High Oct 1 and a pivot level
- PRICE: 1.3355 @ 06:46 BST Oct 13
- SUP 1: 1.3262 Low Oct 10
- SUP 2: 1.3254 Low Aug 4
- SUP 3: 1.3142 Low Aug 1 and a key support
- SUP 4: 1.3041 Low Apr 14
A short-term bear condition in GBPUSD remains intact and last week’s extension down has strengthened this condition. The pair has breached a key short-term support at 1.3333, the Sep 3 low. The break signals scope for a deeper retracement. A clear break of 1.3280 (pierced), a Fibonacci retracement, would open key support at 1.3142, the Aug 1 low. Initial resistance to watch is 1.3443, the 20-day EMA.
EURGBP TECHS: Support Around The 50-Day EMA Remains Intact
- RES 4: 0.8835 High May 3 2023
- RES 3: 0.8800 Round number resistance
- RES 2: 0.8769 High Jul 28 and the bull trigger
- RES 1: 0.8725/8751 High Oct 10 / High Sep 25
- PRICE: 0.8701 @ 07:23 BST Oct 13
- SUP 1: 0.8675/8656 50-day EMA / Low Aug 10
- SUP 2: 0.8633 Low Sep 15
- SUP 3: 0.8597 Low Aug 14 and key support
- SUP 4: 0.8562 50.0% retracement May 29 - Jul 28 upleg
Recent weakness in EURGBP appears corrective and trend signals remain bullish. Note that the cross has pierced support around the 50-day EMA, at 0.8675. A clear breach of this EMA would signal scope for a deeper retracement and open 0.8633, the Sep 15 low. Key trend support lies at 0.8597, the Aug 14 low. On the upside, key resistance and the bull trigger is unchanged at 0.8769, the Jul 28 high.
USDJPY TECHS: Pullback Appears Corrective
- RES 4: 154.80 High Feb 12
- RES 3: 154.39 76.4% retracement of the Jan 10 - Apr 22 bear leg
- RES 2: 153.82 1.618 proj of the Sep 17 - 26 - Oct 1 price swing
- RES 1: 153.27 High Oct 10
- PRICE: 151.84 @ 07:38 BST Oct 13
- SUP 1: 150.92 High Sep 26
- SUP 2: 149.45 20-day EMA
- SUP 3: 148.34 50-day EMA
- SUP 4: 146.81 Trendline support drawn from the Apr 22 low
The underlying bullish trend condition in USDJPY remains intact and Friday’s pullback is for now, considered corrective. Note that the trend is overbought and a deeper retracement would allow this overbought set-up to unwind. The next important support lies at 149.45, the 20-day EMA. On the upside, a break of Friday’s 153.27 high, would resume the uptrend and open 154.39, a Fibonacci retracement point.
EURJPY TECHS: Trend Needle Points North
- RES 4: 180.00 Psychological round number
- RES 3: 179.81 Top of a bull channel drawn from the Feb 28 low
- RES 2: 178.94 1.236 proj of the Jul 31 - Sep 29 - Oct 2 price swing
- RES 1: 177.94 High Oct 10 and the bull trigger
- PRICE: 176.52 @ 08:02 BST Oct 13
- SUP 1: 175.67 Low Oct 10
- SUP 2: 174.73 20-day EMA
- SUP 3: 173.24 High Oct 3 and a gap low on the daily chart
- SUP 4: 172.27 Low Oct 2 and a key medium-term support
The trend set-up in EURJPY is bullish despite the slippage of last week’s high - a corrective pullback. Key short-term support lies at 172.27, the Oct 2 low. First support to watch lies at 174.73, the 20-day EMA. Last week’s fresh cycle highs strengthen bullish conditions. The cross has cleared resistance at 175.13, the Sep 29 high, to confirm a resumption of the primary uptrend. A resumption of gains would open the 178.94, a Fibonacci projection.
AUDUSD TECHS: Bearish Threat
- RES 4: 0.6726 1.236 proj of the Jun 23 - Jul 24 - Aug 21 price swing
- RES 3: 0.6660/6707 High Sep 18 / 17 and a bull trigger
- RES 2: 0.6629 High Sep 30 & Oct 01 and key short-term resistance
- RES 1: 0.6560 50-day EMA
- PRICE: 0.6513 @ 08:11 BST Oct 13
- SUP 1: 0.6473 Low Oct 10
- SUP 2: 0.6463 Low Aug 27
- SUP 3: 0.6415 Low Aug 21 / 22 and a bear trigger
- SUP 4: 0.6373 Low Jun 23
A sharp sell-off in AUDUSD on Friday resulted in a break of 0.6521, the Sep 26 low, and 0.6484, the 76.4% retracement of the Aug 21 - Sep 17 bull leg. This undermines the recent bullish theme and instead signals scope for a deeper retracement, potentially towards key support at 0.6415, the Aug 21 and 22 low. Initial resistance to watch is 0.6560, the 50-day EMA. Key short-term resistance has been defined at 0.6629, the Sep 30 and Oct 1 high.
USDCAD TECHS: Bullish Trend Structure
- RES 4: 1.4167 50.0% retracement of the Feb 3 - Jun 16 bear leg
- RES 3: 1.4111/39 High Apr 10 / 3.0% Upper Bollinger Band
- RES 2: 1.4072 Bull channel top drawn from the Jul 23 low
- RES 1: 1.4034 High Oct 9 and 10
- PRICE: 1.4002 @ 08:17 BST Oct 13
- SUP 1: 1.3916/3856 20- and 50-day EMA values
- SUP 2: 1.3795 Bull channel base drawn from the Jul 23 low
- SUP 3: 1.3727 Low Aug 29 and a bear trigger
- SUP 4: 1.3689 Low Jul 28
A bull cycle in USDCAD remains intact. Last Thursday’s rally confirmed a recent bull flag on the daily chart and a resumption of the current uptrend. Moving average studies are in a bull-mode position, highlighting a dominant uptrend. Sights are on 1.4111 next, the Apr 10 high, and further out scope is seen for an extension towards 1.4167, a Fibonacci retracement. First key support is at 1.3856, the 50-day EMA.
FIXED INCOME
BUND TECHS: (Z5) Approaching Key Resistance
- RES 4: 130.05 76.4% retracement of the Jun 13 - Sep 3 bear leg
- RES 3: 129.66 High Jul 22
- RES 2: 129.58 61.8% retracement of the Jun 13 - Sep 3 bear leg
- RES 1:129.44 High Sep 10 and key short-term resistance.
- PRICE: 129.17 @ 05:48 BST Oct 13
- SUP 1: 128.64 50-day EMA
- SUP 2: 128.25 Low Oct 7
- SUP 3: 127.88 Low Sep 25
- SUP 4: 127.61 Low Sep 3 and the bear trigger
Bund futures rallied sharply higher on Friday confirming a resumption of the recovery that started Sep 25. The move higher reinforces a bullish theme and attention is on the next key resistance at 129.44. Clearance of this hurdle would pave the way for a climb towards 129.58, a Fibonacci retracement point. Initial support to watch lies at 128.64, the 50-day EMA. A break of this level would instead signal a reversal.
BOBL TECHS: (Z5) Rally Exposes Key Resistance
- RES 4: 118.550 Low Jun 5 (cont.)
- RES 3: 118.455 50.0% of the Apr 7 - Aug 15 bear leg (cont.)
- RES 2: 118.400 High Sep 8 / 10 and key resistance
- RES 1: 118.310 High Oct 10
- PRICE: 118.180 @ 06:13 BST Oct 13
- SUP 1: 117.901 20-day EMA
- SUP 2: 117.710 Low Oct 6
- SUP 3: 117.630 Low Oct 1
- SUP 4: 117.470 Low Sep 25 and a key support
A strong rally in Bobl futures on Friday reinforces the current bull cycle that started Sep 25. The break higher exposes the next key resistance at 118.400, the Sep 8 and 10 high, where a break would also strengthen a bullish condition. On the downside, support lies at 117.901, the 20-day EMA. A breach of this average is required to signal a possible reversal. This would open 117.710, the Oct 6 low.
SCHATZ TECHS: (Z5) Holding On To Its Recent Gains
- RES 4: 107.240 High Aug 4
- RES 3: 107.225 High Aug 27 and a bull trigger
- RES 2: 107.145/190 High Sep 11 / High Sep 5 and 8
- RES 1: 107.125 High Oct 13
- PRICE: 107.095 @ 06:43 BST Oct 13
- SUP 1: 107.026 20-day EMA
- SUP 2: 106.965/920 Low Oct 6 / Low Sep 25 and the bear trigger
- SUP 3: 106.907 1.618 proj of the the Aug 27 - Sep 2 - 8 price swing
- SUP 4: 106.900 Round number support
Schatz futures traded sharply higher Friday and the contract is holding on to its latest gains. A key short-term resistance at 107.050, the Aug 25 and Sep 2 low plus a recent high, has been cleared. The break of this hurdle undermines a recent bearish theme and instead signals scope for a stronger recovery. This opens 107.145, the Sep 11 high. Key support and the bear trigger has been defined at 106.920, the Sep 25 low.
GILT TECHS: (Z5) Remains Above Support
- RES 4: 92.06 High Aug 14
- RES 3: 92.00 Round number resistance
- RES 2: 91.28/82 High Sep 24 / 11 and a key resistance
- RES 1: 91.24 High Oct 10
- PRICE: 91.16 @ Close Oct 10
- SUP 1: 90.26/89.94 Low Sep 26 / 76.4% of the Sep 3 - 11 correction
- SUP 2: 89.36 Low Sep 3 and a key support
- SUP 3: 89.22 1.618 proj of the Aug 21 - 27 - 28 price swing
- SUP 4: 89.00 Round number support
Gilt futures rallied sharply higher on Friday confirming a resumption of the recovery that started Sep 25. The move higher reinforces a bullish theme and attention is on the next key resistance at 129.44. A continuation higher would pave the way for an extension towards key resistance at 91.82, the Sep 11 high. On the downside, price needs to trade below support at 90.26, the Sep 26 low, to reinstate a bearish theme.
BTP TECHS: (Z5) Range Parameters Intact For Now
- RES 4: 122.56 0.764 proj of the Apr 9 - May 8 - 14 price swing (cont)
- RES 3: 121.88 0.618 proj of the Apr 9 - May 8 - 14 price swing (cont)
- RES 2: 121.00 Round number resistance
- RES 1: 120.43/120.74 High Oct 8 & 9 / High Aug 5 and the bull trigger
- PRICE: 120.62 @ Close Oct 10
- SUP 1: 119.85 Low Oct 7
- SUP 2: 119.07 Low Sep 25
- SUP 3: 118.36 Low Sep 3 and key support
- SUP 4: 118.00 Rund number support
BTP futures futures rallied Friday reinforcing a bullish outlook. For now, the contract continues to trade in a range. Key short-term resistance and the bull trigger is 120.74, the Aug 5 high. A break of this hurdle would confirm a resumption of the trend. Initial firm support to watch lies at 119.07, the Sep 25 low. Clearance of this level would allow for a deeper short-term retracement towards key support at 118.36, the Sep 3 low.
EQUITIES
EUROSTOXX50 TECHS: (Z5) Tests Key Support Zone
- RES 4: 5777.41 1.382 proj of the Aug 1 - 22 - Sep 2 price swing
- RES 3: 5727.18 1.236 proj of the Aug 1 - 22 - Sep 2 price swing
- RES 2: 5700.00 Round number resistance
- RES 1: 5689.00 High Oct 2 and the bull trigger
- PRICE: 5568.00 @ 07:14 BST Oct 13
- SUP 1: 5509.00 Low Oct 10
- SUP 2: 5474.21 50-day EMA
- SUP 3: 5423.00 Low Sep 25
- SUP 4: 5366.00 Low Sep 17
The trend condition in Eurostoxx 50 futures is unchanged, the direction is up and the latest pullback is - for now - considered corrective. The key support zone to monitor is 5549.76 - 5474.21, the area between the 20- and 50-day EMAs. A clear break of the 50-day average would highlight a stronger reversal. On the upside, the bull trigger has been defined at 5689.00, the Oct 2 high. Clearance of this hurdle would confirm a resumption of the uptrend.
E-MINI S&P: (Z5) Corrective Pullback
- RES 4: 6850.87 1.618 proj of the Aug 1 - 15 - 20 price swing
- RES 3: 6831.38 2.500 proj of the Aug 20 - 28 - Sep 2 price swing
- RES 2: 6819.25 1.500 proj of the Aug 1 - 15 - 20 price swing
- RES 1: 6705.18/6812.25 20-day EMA / High Sep 9
- PRICE: 6679.50 @ 06:15 BST Oct 13
- SUP 1: 6598.55 50-day EMA
- SUP 2: 6540.25 Low Sep 10 and a key short-term support
- SUP 3: 6506.50 Low Sep 5
- SUP 4: 6427.00 Low Sep 2
A sharp sell-off in S&P E-Minis on Friday is - for now - considered corrective. The contract has found support below the 50-day EMA, currently at 6598.55. Friday’s low of 6940.25 has been defined as a key short-term support. Note that moving average studies remain in a bull-mode position, highlighting a dominant uptrend. The bull trigger is 6812.25, the Sep 9 high. A breach of this hurdle would confirm a resumption of the uptrend.
COMMODITIES
BRENT TECHS: (Z5) Has Cleared Support
- RES 4: $76.82 - 2.382 proj of the Apr 9 - 23 - May 5 price swing
- RES 3: $75.43 - High Jun 23 and a bull trigger
- RES 2: $69.87/71.20 - High Sep 26 / High Jul 30 and key resistance
- RES 1: $66.31 - 50-day EMA
- PRICE: $63.66 @ 07:10 BST Oct 13
- SUP 1: $62.00 - Low Oct 10
- SUP 2: $60.85 - Low May 30
- SUP 3: $58.50 - Low May 5
- SUP 4: $57.88 - Low Apr 9 and a key support
A bearish threat in Brent futures remains present and Friday’s move down reinforces the bearish theme. The break lower confirms a resumption of the downtrend - support at $64.00 has been breached. This also maintains the price sequence of lower lows and lower highs. Sights are on a move towards $60.85, the May 30 low. Initial firm resistance has been defined at $69.87, the Sep 26 high.
WTI TECHS: (X5) Resumes Its Downtrend
- RES 4: $74.79- 2.500 proj of the Apr 9 - 23 - May 5 price swing
- RES 3: $73.39 - High Jun 23 and a bull trigger
- RES 2: $66.42/68.43 - High Sep 29 and key resistance / High Jul 30
- RES 1: $62.75 - 50-day EMA
- PRICE: $59.78 @ 07:22 BST Oct 13
- SUP 1: $58.22 - Low Oct 10
- SUP 2: $57.50 - Low May 30
- SUP 3: $54.89 - Low May 5
- SUP 4: $54.10 - Low Apr 9 and a key support
A bearish theme in WTI futures remains intact. Friday’s move down confirmed a resumption of the bear leg - support at $60.40, the Oct 2 low, has been breached. This highlights an extension of the bearish price sequence of lower lows and lower highs. The move down opens $57.50 next, the May 30 low. On the upside, initial key resistance is at $66.42, the Sep 29 high. Clearance of this level would highlight a reversal.
GOLD TECHS: Fresh Cycle High
- RES 4: $4161.7 - 2.764 proj of the May 15 - Jun 16 - 30 price swing
- RES 3: $4113.5 - 2.618 proj of the May 15 - Jun 16 - 30 price swing
- RES 2: $4100.0 - Round number resistance
- RES 1: $4078.2 - Intraday high
- PRICE: $40777.0 @ 06:42 BST Oct 13
- SUP 1: $3944.9 - Low Oct 9
- SUP 2: $3836.5 - 20-day EMA
- SUP 3: $3717.6 - Low Sep 24
- SUP 4: $3659.9 - 50-day EMA
A bull cycle in Gold remains intact and today’s fresh cycle marks a bullish start to this week’s session. The move higher maintains the price sequence of higher highs and higher lows. Sights are on the $4100.00 handle, and $4113.5, a Fibonacci projection point. Note that the trend is in overbought territory. A move down would be considered corrective and would allow the overbought set-up to unwind. Support to watch is $3836.5, 20-day EMA.
SILVER TECHS: Impulsive Bull Wave Extends
- RES 4: $52.689 - 4.500 proj of the Sep 4 - 16 - 17 price swing
- RES 3: $52.386 - 4.382 proj of the Sep 4 - 16 - 17 price swing
- RES 2: $52.000 - Round number resistance
- RES 1: $51.692 - Intraday high
- PRICE: $51.649 @ 08:23 BST Oct 13
- SUP 1: $46.722 - 20-day EMA
- SUP 2: $42.938 - 50-day EMA
- SUP 3: $41.135 - Low Sep 17
- SUP 4: $40.404 - Low Sep 4
Trend signals in Silver remain bullish. The metal has traded to a fresh cycle high today. Recent gains have resulted in a move above a major resistance area around the $49.00-$50.00 region. This marks a high point from Jan ‘80 and Apr ‘11 and $50.00 represents a key psychological level. A clear break of this zone strengthens a bull theme and paves the way for a climb towards $52.00 next. Support to watch lies at $46.204, the 20-day EMA.