MNI DAILY TECHNICAL ANALYSIS - JPY Corrective Cycle in Play
Price Signal Summary – JPY Corrective Cycle in Play
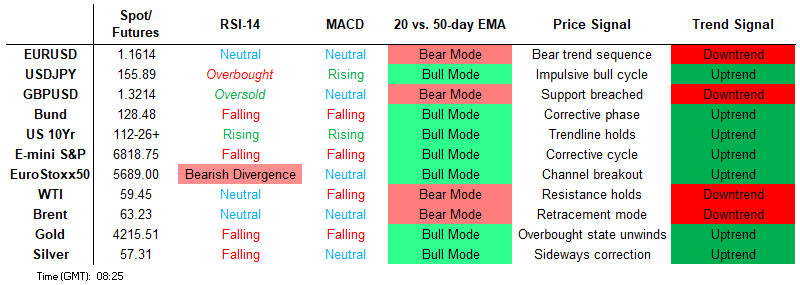
- S&P E-Minis are holding on to their recent gains following the recovery from the Nov 21 low. The climb has resulted in a breach of the 20- and 50- day EMAs. This highlights a bullish development and the likely end of the corrective cycle. Recent gains in EUROSTOXX 50 futures undermines a recent bearish theme and the contract is holding on to its gains. Price has traded above the 20- and 50-day EMAs, signalling scope for a stronger recovery near-term.
- AUDUSD continues to trade above the 20- and 50-day EMAs. The pair has also pierced a short-term trendline resistance at 0.6547, drawn from the Sep 17 high. This undermines a recent bear theme. A bear theme in USDCAD remains intact. Price has traded through the 50-day EMA and attention is to 1.3931, the base of a bull channel drawn from the Jul 23 low. The trend structure in EURUSD remains bearish and the most recent recovery appears corrective. The pair has breached both the 20- and 50-day EMAs.
- Short-term gains in WTI futures are considered corrective. Note that moving average studies are in a bear-mode position, highlighting a dominant downtrend. The trend condition in Gold remains bullish and the bear phase between Oct 20 and 28 appears to have been a correction. Note that the recovery since Oct 28 signals the end of the corrective cycle.
- Bund futures sold off sharply yesterday resulting in a break of key short-term support at 128.37, the Nov 20 low. The breach confirms a resumption of the bear cycle that started on Oct 17. A stronger short-term bullish condition in Gilt futures remains intact following recent gains. A resumption of the bull leg would signal scope for a climb towards resistance at 92.55, the Nov 11 high.
[CROSS ASSET] MNI Tech Trend Monitor - November Refresh
- We refresh our Global Tech Trend Monitor, adding longer-term techs for EURGBP, USDMXN, EURHUF, Bitcoin and the USD Index as well as refreshing levels for Spot Gold, Silver, USDJPY, UK Gilt Yields and the Europe Banking Stock Index (SX7E).
- See full document here: Hidden PDF
FOREIGN EXCHANGE
EURUSD TECHS: Key Short-Term Resistance Intact For Now
- RES 4: 1.1728 High Oct 17
- RES 3: 1.1694 50.0% retracement of the Sep 17 - Nov 5 bear leg
- RES 2: 1.1656 High Nov 13 and key resistance
- RES 1: 1.1652 High Dec 01
- PRICE: 1.1608 @ 06:10 GMT Dec 2
- SUP 1: 1.1547 Low Nov 26
- SUP 2: 1.1491/1469 Low Nov 21 / 5 and the bear trigger
- SUP 3: 1.1425 1.500 proj of the Oct 17 - 22 - 28 price swing
- SUP 4: 1.1392 Low Aug 1 and bear trigger
The trend structure in EURUSD remains bearish and the most recent recovery appears corrective. The pair has breached both the 20- and 50-day EMAs. Key short-term resistance to monitor is 1.1656, the Nov 13 high and a bull trigger. Clearance of this level would highlight a reversal. Yesterday’s gains cancel a doji reversal signal from last Thursday. For bears, a resumption of weakness would open key support at 1.1469, the Nov 5 low.
GBPUSD TECHS: Monitoring Resistance At The 50-Day EMA
- RES 4: 1.3416 High Oct 21
- RES 3: 1.3368 50.0% retracement of the Sep 17 - Nov 4 bear leg
- RES 2: 1.3284 38.2% retracement of the Sep 17 - Nov 4 bear leg
- RES 1: 1.3275 High Dec 01
- PRICE: 1.3209 @ 06:30 GMT Dec 2
- SUP 1: 1.3125 Low Nov 26
- SUP 2: 1.3038/10 Low Nov 20 / Low Nov 4 & 5 and the bear trigger
- SUP 3: 1.2971 1.382 proj of the Sep 17 - 25 - Oct 1 price swing
- SUP 4: 1.2945 50.0% retracement of the Jan 13 - Jul 1 bull leg
The trend theme in GBPUSD is unchanged, it remains bearish and a recovery in November appears corrective. Price has pierced the 50-day EMA, currently at 1.3257. A clear break of the average would highlight a stronger bull theme. Moving average studies are in a bear-mode condition, highlighting a dominant downtrend. 1.3010, the Nov 4 / 5 low, is the trigger for a resumption of the bear leg.
EURGBP TECHS: Trend Structure Remains Bullish
- RES 4: 0.8893 2.000 proj of the Sep 15 - 25 - Oct 8 price swing
- RES 3: 0.8875 High Apr 25
- RES 2: 0.8868 61.8% retracement of the 2022 - 2024 bear leg
- RES 1: 0.8818/65 High Nov 16 / 14
- PRICE: 0.8787 @ 06:44 GMT Dec 2
- SUP 1: 0.8746 Low Nov 27
- SUP 2: 0.8726 Low Oct 28
- SUP 3: 0.8706 76.4% retracement of the Oct 8 - Nov 14 bull leg
- SUP 4: 0.8656 Low Oct 8 and a key support
The trend set-up in EURGBP remains bullish and recent weakness appears corrective. Moving average studies are in a bull-mode position, highlighting a dominant uptrend. Note that the cross has pierced the 50-day EMA, at 0.8753. A clear break of this average would signal scope for a deeper corrective pullback. For bulls, a resumption of gains would open 0.8868, a Fibonacci retracement point.
USDJPY TECHS: Corrective Cycle Still In Play
- RES 4: 158.87 High Jan 10 and a key resistance
- RES 3: 158.29 2.618 projection of the Sep 17 - 26 - Oct 1 price swing
- RES 2: 158.00 Round number resistance
- RES 1: 156.58/157.89 High Nov 28 / 20 and the bull trigger
- PRICE: 155.76 @ 07:08 GMT Dec 2
- SUP 1: 154.67 Low Dec 01
- SUP 2: 154.42 Low Nov 17
- SUP 3: 153.06 50-day EMA
- SUP 4: 151.54 Low Oct 29
The trend set-up in USDJPY is bullish and the latest pullback is considered corrective. Note that a deeper retracement would allow a recent overbought condition to unwind. Support at 155.27, the 20-day EMA, has been breached. A continuation lower would expose the 50-day EMA at 153.16. Moving average studies are in a bull-mode position, highlighting a dominant uptrend. A resumption of the uptrend would open 158.00.
EURJPY TECHS: Flag Formation Reinforces A Bull Theme
- RES 4: 183.58 Bull channel top drawn from the Feb 28 low
- RES 3: 184.34 2.000 proj of the Jul 31 - Sep 29 - Oct 2 price swing
- RES 2: 183.07 1.764 proj of the Jul 31 - Sep 29 - Oct 2 price swing
- RES 1: 182.01 High Nov 20 and the bull trigger
- PRICE: 180.94 @ 07:19 GMT Dec 2
- SUP 1: 179.80 20-day EMA
- SUP 2: 178.98/177.71 Low Nov 14 / 50-day EMA
- SUP 3: 175.71 Low Nov 5
- SUP 4: 175.45 Bull channel support drawn from the Feb 28 low
A bullish theme in EURJPY remains intact and the cross is trading closer to its recent highs. The latest pause appears to be a flag formation - a trend continuation signal that reinforces the bull theme. Recent fresh cycle highs confirm a resumption of the trend and maintain the bullish price sequence of higher highs and higher lows. Sights are on 183.58, the top of a bull channel drawn from the Feb 28 low. First key support lies at 179.73, the 20-day EMA.
AUDUSD TECHS: Testing Resistance
- RES 4: 0.6660 High Sep 18
- RES 3: 0.6640 76.4% retracement of the Sep 17 - Nov 21 bear leg
- RES 2: 0.6618 High Oct 29 and a key near-term resistance
- RES 1: 0.6567/6580 High Dec 01 / High Nov 13
- PRICE: 0.6557 @ 08:00 GMT Dec 2
- SUP 1: 0.6512 20-day EMA
- SUP 2: 0.6466/21 Low Nov 26 / 21
- SUP 3: 0.6415 Low Aug 21 / 22 and a bear trigger
- SUP 4: 0.6404 38.2% retracement of the Apr 9 - Sep 17 bull cycle
AUDUSD continues to trade above the 20- and 50-day EMAs. The pair has also pierced a short-term trendline resistance at 0.6547, drawn from the Sep 17 high. This undermines a recent bear theme. A clear break of the trendline would strengthen a bull theme and highlight a stronger reversal, opening 0.6580, the Nov 13 high. A clear reversal is needed to refocus attention on 0.6415, the Aug 21 / 22 low. First support is at 0.6512, the 20-day EMA.
USDCAD TECHS: Sights Are On The Channel Base
- RES 4: 1.4314 61.8% retracement of the Feb 3 - Jun 16
- RES 3: 1.4207 Channel top drawn from Jul 23 low
- RES 2: 1.4140/67 High Nov 5 / 50.0% of the Feb 3 - Jun 16 bear leg
- RES 1: 1.4036/1.4131 20-day EMA / High Nov 21
- PRICE: 1.3994 @ 08:09 GMT Dec 2
- SUP 1: 1.3939 Low Nov 28
- SUP 2: 1.3931 Bull channel base drawn from the Jul 23 low
- SUP 3: 1.3888 Low Oct 29 and a key support
- SUP 4: 1.3833 Low Sep 24
A bear theme in USDCAD remains intact. Price has traded through the 50-day EMA and attention is to 1.3931, the base of a bull channel drawn from the Jul 23 low. A clear break of the channel base would highlight a stronger bear cycle. On the upside, a reversal higher is required to refocus attention on 1.4140, the Nov 5 high and key resistance. Initial resistance is 1.4036, 20-day EMA.
FIXED INCOME
BUND TECHS: (Z5) Resumes Its Downtrend
- RES 4: 130.07 High Oct 24
- RES 3: 129.74 61.8% retracement of the Oct 17 - Nov 20 bear leg
- RES 2: 129.40 High Nov 13
- RES 1: 128.72/129.21 Low Nov 24 / High Nov 26 and key resistance
- PRICE: 128.34 @ 05:49 GMT Dec 2
- SUP 1: 128.24 Low Dec 1
- SUP 2: 127.88 Low Sep 25 and key support
- SUP 3: 127.61 Low Sep 3 and a key M/T support
- SUP 4: 127.45 Low Mar 18 (cont.)
Bund futures sold off sharply yesterday resulting in a break of key short-term support at 128.37, the Nov 20 low. The breach confirms a resumption of the bear cycle that started on Oct 17. The move down sets the scene for an extension towards 127.88, the Sep 28 low and the next important support. MA studies have recently crossed to highlight a bear-mode condition. Key short-term resistance has been defined at 129.21, the Nov 26 high.
BOBL TECHS: (Z5) Fresh Bear Cycle Low
- RES 4: 118.360 High Oct 28
- RES 3: 118.270 High Nov 5
- RES 2: 118.066/180 50-day EMA / High Nov 21
- RES 1: 117.910 Low Nov 24
- PRICE: 117.680 @ 05:54 GMT Dec 2
- SUP 1: 117.650 Low Dec 1
- SUP 2: 117.630 Low Oct 1
- SUP 3: 117.470 Low Sep 15 and a key support
- SUP 4: 117.427 76.4% retracement of the Aug 15 - Oct 17 bull cycle
The short-term trend theme in Bobl futures remains bearish and Monday’s sell-off reinforces current conditions. The contract has traded through the bear trigger at 117.790, the Nov 20 low. This confirms a resumption of the downtrend that started Oct 17. The break paves the way for an extension towards 117.470, the Sep 15 low and the next key support. Key short-term resistance is at 118.066, the 50-day EMA.
SCHATZ TECHS: (Z5) Trades Through Support
- RES 4: 107.175 High Oct 24
- RES 3: 107.095 High Oct 28 / 31
- RES 2: 107.044 50-day EMA
- RES 1: 107.001 20-day EMA
- PRICE: 106.920 @ 14:52 GMT Dec 1
- SUP 1: 106.904 61.8% retracement of the Mar 6 - Apr 7 bull cycle
- SUP 2: 106.900 Round number support
- SUP 3: 106.830 Low Mar 27 (cont.)
- SUP 4: 106.805 High Mar 24 (cont.)
A sharp sell-off on Schatz futures on Monday confirms a resumption of the downtrend that started mid-October. The contract has breached 106.945, the Nov 17 low and pierced 106.920, the Sep 25 low and key support. A clear break of the latter would open 106.904 next, a Fibonacci retracement on the continuation chart. Initial firm resistance to watch is at the 50-day EMA, at 107.044.
GILT TECHS: (H6) Bullish Theme
- RES 4: 92.55 High Nov 11
- RES 3: 92.31 High Nov 12
- RES 2: 92.00 Round number resistance
- RES 1: 91.93 High Nov 27
- PRICE: 91.23 @ Close Dec 1
- SUP 1: 90.99/90.53 Low Dec 1 / Low Nov 25
- SUP 2: 90.28 Low Nov 21
- SUP 3: 90.00 Round number support
- SUP 4: 89.86 Low Nov 19 and the bear trigger
A stronger short-term bullish condition in Gilt futures remains intact following recent gains. A resumption of the bull leg would signal scope for a climb towards resistance at 92.55, the Nov 11 high. A gap in the daily chart has been filled and initial resistance to watch is 91.93, the Nov 27 high. For bears, a stronger reversal would instead refocus attention on the first important support at 90.53, the Nov 26 low.
BTP TECHS: (Z5) Trading Above Support
- RES 4: 123.14 1.764 proj of the Sep 3 - 11 - 25 price swing
- RES 3: 122.81 1.618 proj of the Sep 3 - 11 - 25 price swing
- RES 2: 122.53 1.500 proj of the Sep 3 - 11 - 25 price swing
- RES 1: 121.70/94 High Nov 13 / High Oct 17 / 22 and the bull trigger
- PRICE: 120.78 @ Close Dec 1
- SUP 1: 120.48 Low Nov 20 and key short-term support
- SUP 2: 120.15 50.0% retracement of the Sep 3 - Oct 17 bull leg
- SUP 3: 119.73 61.8% retracement of the Sep 3 - Oct 17 bull leg
- SUP 4: 119.07 Low Sep 25
The trend set-up in BTP futures is bullish and the sell-off yesterday appears corrective - for now. Key short-term support to watch has been defined at 120.48, the Nov 20 low. A clear breach of this level would resume a recent bear leg. Note that the moving average studies are in a bull-mode position, highlighting a dominant uptrend. A resumption of gains would expose the bull trigger at 121.94, the Oct 17 and 22 high.
EQUITIES
EUROSTOXX50 TECHS: (Z5) Bullish Short-Term Set-Up Intact
- RES 4: 5825.00 High Nov 13 and a key resistance
- RES 3: 5742.40 76.4% retracement of the Nov 13 - 21 bear leg
- RES 2: 5708.00 High Nov 17
- RES 1: 5695.00 High Dec 1
- PRICE: 5676.00 @ 06:37 GMT Dec 2
- SUP 1: 5605.76/5475.00 50-day EMA / Low Nov 21 and bear trigger
- SUP 2: 5427.01 61.8% retracement of the Aug 1 - Nov 13 bull cycle
- SUP 3: 5383.00 Low Sep 18
- SUP 4: 5366.00 Low Sep 17
Recent gains in EUROSTOXX 50 futures undermines a recent bearish theme and the contract is holding on to its gains. Price has traded above the 20- and 50-day EMAs, signalling scope for a stronger recovery near-term. A continuation would open 5742.40, a Fibonacci retracement point. For bears, a reversal lower would instead expose the key short-term support and bear trigger at 5475.00, the Nov 21 low.
E-MINI S&P: (Z5) Holding On To Its Recent Gains
- RES 4: 6953.75 High Oct 30 and bull trigger
- RES 3: 6900.50 High Nov 12
- RES 2: 6852.56 76.4% retracement of the Oct 30 - Nov 21 bear leg
- RES 1: 6864.50 High Dec 1
- PRICE: 6823.25 @ 07:25 GMT Dec 2
- SUP 1: 6674.50/6525.00 Low Nov 25 / 21
- SUP 2: 6500.00 Round number support
- SUP 3: 6476.62 23.6% retracement of the Apr 7 - Oct 30 uptrend
- SUP 4: 6427.00 Low Sep 2
S&P E-Minis are holding on to their recent gains following the recovery from the Nov 21 low. The climb has resulted in a breach of the 20- and 50- day EMAs. This highlights a bullish development and the likely end of the corrective cycle between Oct 30 and Nov 21. A continuation higher would signal scope for a move towards the key resistance and bull trigger at 6953.75, the Oct 30 high. Key support lies at 6525.00, the Nov 21 low.
COMMODITIES
BRENT TECHS: (G6) Bear Theme Remains Intact
- RES 4: $70.86 - 76.4% retracement of the Jun 23 - Oct 17 bear leg
- RES 3: $70.33 - High Jul 30
- RES 2: $68.86 - High Sep 26 and a key resistance
- RES 1: $65.25 - High Oct 24
- PRICE: $63.19 @ 07:16 GMT Dec 2
- SUP 1: $59.93 - Low Nov 20 and the bear trigger
- SUP 2: $58.92 - Low May 5
- SUP 3: $58.11 - Low Apr 9 and a key support
- SUP 4: $56.22 - 2.00 proj of the Jul 30 - Aug 13 - Sep 26 price swing
The move down in Brent futures since Nov 11, continues to highlight a bearish theme. A resumption of weakness would expose key support and the bear trigger at $59.93, Oct 20 low. Clearance of this level would confirm a continuation of the bear cycle. Key short-term resistance to watch is $65.25, the Oct 24 high. A breach of this level would instead signal scope for a stronger correction.
WTI TECHS: (F6) Support Remains Exposed
- RES 4: $71.38 - High Jun 23 and a key medium-term resistance
- RES 3: $67.16 - High Jul 30
- RES 2: $65.33 - High Sep 26 and key resistance
- RES 1: $61.84 - High Oct 24
- PRICE: $59.47 @ 07:22 GMT Dec 2
- SUP 1: $55.99 - Low Oct 20 and bear trigger
- SUP 2: $55.33 - Low May 1
- SUP 3: $54.72 - Low Apr 9 and a key support
- SUP 4: $53.53 - 1.764 proj of the Jul 30 - Aug 13 - Sep 26 price swing
Short-term gains in WTI futures are considered corrective. Note that moving average studies are in a bear-mode position, highlighting a dominant downtrend. A resumption of the bear leg would open the key support and the bear trigger at $55.99, the Oct 20 low. Clearance of this level would resume the downtrend. Key short-term resistance to watch is $61.84, the Oct 24 high. A clear break of this hurdle would signal scope for a stronger correction.
GOLD TECHS: Bullish Structure
- RES 4: $4404.9 - 3.500 proj of the May 15 - Jun 16 - 30 price swing
- RES 3: $4400.0 - Round number resistance
- RES 2: $4381.5 - High Oct 20 and bull trigger
- RES 1: $4264.7 - 76.4% retracement of the Oct 20 - 28 correction
- PRICE: $4218.3 @ 07:28 GMT Dec 2
- SUP 1: $4116.7/4001.1 - 20- and 50-day EMA values
- SUP 2: $3886.6 - Low Oct 28 and a reversal trigger
- SUP 3: $3800.00 Round number support
- SUP 4: $3760.9 - Low Sep 29
The trend condition in Gold remains bullish and the bear phase between Oct 20 and 28 appears to have been a correction. Note that the recovery since Oct 28 signals the end of the corrective cycle. Key support to watch lies at the 50-day EMA, at $4001.1. Clearance of this EMA would signal scope for a deeper retracement. Sights are on key resistance and the bull trigger at $4381.5, the Oct 20 high.
SILVER TECHS: Northbound
- RES 4: $60.852 - 1.382 proj of the Oct 28 - Nov 13 - 21 price swing
- RES 3: $60.000 - Psychological round number
- RES 2: $59.563 - 1.236 proj of the Oct 28 - Nov 13 - 21 price swing
- RES 1: $57.843 - High Dec 1
- PRICE: $57.317 @ 08:14 GMT Dec 2
- SUP 1: $51.989 - 20-day EMA
- SUP 2: $49.221/45.557 - 50-day EMA / Low Oct 28
- SUP 3: $41.135 - Low Sep 17
- SUP 4: $38.087 - Low Aug 27
Trend signals in Silver remain bullish - price traded to a fresh all-time high yesterday, starting the week on a firm bullish note. This confirms a resumption of the uptrend and maintains the bullish price sequence of higher highs and higher lows. The move above $55.00 signals scope for a climb towards $59.563 next, a Fibonacci projection. Sights are also on the $60.00 psychological handle. Initial support lies at $51.989, the 20-day EMA.