MNI DAILY TECHNICAL ANALYSIS - JPY 50d EMA Key at the Close
Price Signal Summary – 50-day EMA in USD/JPY Key at the Close
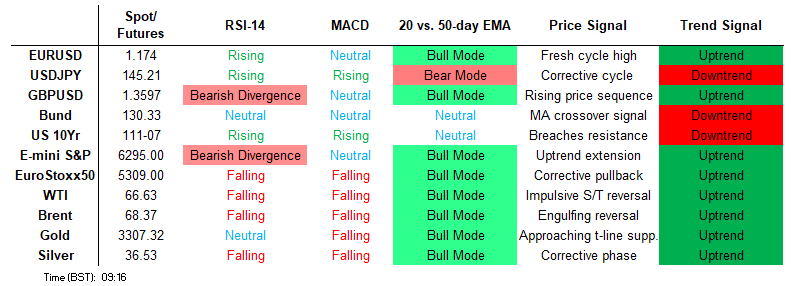
- The trend condition in S&P E-Minis is unchanged, it remains bullish. Resistance at 6128.75, the Jun 11 high, has recently been breached. The break confirmed a resumption of the uptrend that started Apr 7. Short-term trend signals in Eurostoxx 50 futures remain bearish, however, the recovery from the Jun 23 low still appears to be a reversal and the contract is holding on to its most recent gains. Price has pierced both the 20- and 50-day EMAs.
- A bull cycle in GBPUSD remains in play and the latest pullback appears to be a correction. Support to watch is1.3602, the 20-day EMA. A clear break of it would signal scope for a deeper correction towards the 50-day EMA at 1.3462. USDJPY is holding on to its latest gains. The pair has pierced the 50-day EMA, however a close above it is needed to highlight a stronger reversal. For now, gains are considered corrective and a bear threat remains present. The trend needle in USDCAD continues to point south and last week’s move down reinforces current conditions. S/T gains between Jun 16 - 23 appear to have been corrective. Sights are on key support and the bear trigger at 1.3540, Jun 16 low.
- Recent weakness in Gold resulted in a breach of the 50-day EMA, and a trendline drawn from the Dec 30 ‘24 low and connected to the Feb 28 low. A clear break of both trend tools would signal scope for a deeper correction, and open $3245.5, May 29 low. WTI futures maintain a softer tone following the reversal from the Jun 23 high. Recent gains appear corrective. Support to watch is the 50-day EMA, at $64.84. It has been pierced, a clear break of it would signal scope for a deeper retracement.
- Bund futures are trading above last week’s low. The bounce resulted in a print above 130.52, the 50-day EMA. A clear break of it would highlight a possible reversal. The next important resistance is 131.33, the Jun 20 high. Gilt futures faced strong selling pressure on Jul 2. The move down has cancelled a recent bullish theme - price breached the 20-day EMA and traded through a key support at 92.23, the Jun 16 low.
FOREIGN EXCHANGE
EURUSD TECHS: Trend Needle Points North
- RES 4: 1.1954 2.0% 10-dma envelope
- RES 3: 1.1923 2.000 proj of the Feb 28 - Mar 18 - 27 price swing
- RES 2: 1.1851 High Sep 10 2021
- RES 1: 1.1829 High Jul 01
- PRICE: 1.1767 @ 06:15 BST Jul 7
- SUP 1: 1.1708 Low Jun 30
- SUP 2: 1.1630 20-day EMA
- SUP 3: 1.1575 Low Jun 24
- SUP 4: 1.1447 50-day EMA
The trend condition in EURUSD remains bullish with price trading closer to its recent highs. Moving average studies are in a bull-mode position highlighting a clear uptrend and note too that corrections, when they do occur, have been shallow. This reinforces the trend condition. A resumption of gains would signal scope for a climb towards 1.1851, the Sep 10 2021 high. Key short-term support to watch lies at 1.1630, the 20-day EMA.
GBPUSD TECHS: Corrective Cycle
- RES 4: 1.3852 1.764 proj of the Feb 28 - Apr 3 - 7 price swing
- RES 3: 1.3835 High Oct 20 2021
- RES 2: 1.3800 Round number resistance
- RES 1: 1.3789 High Jul 01
- PRICE: 1.3616 @ 06:37 BST Jul 7
- SUP 1: 1.3602/63 20-day EMA / Low Jul 02
- SUP 2: 1.3462 50-day EMA
- SUP 3: 1.3369 Trendline support drawn from the Jan 13 low
- SUP 4: 1.3140 Low May 12 and key support
A bull cycle in GBPUSD remains in play and the latest pullback appears to be a correction. Support to watch is1.3602, the 20-day EMA. A clear break of it would signal scope for a deeper correction towards the 50-day EMA at 1.3462. Key resistance and the bull trigger has been defined at 1.3789, the Jul 1 high. A break of it would resume the uptrend. Note that MA studies are in a bull-mode position - this suggests the M/T uptrend remains intact.
EURGBP TECHS: Bull Cycle Still Intact
- RES 4: 0.8781 2.236 pro of the Mar 3 - 11 - 28 price swing
- RES 3: 0.8738 High Apr 11 high and a key resistance
- RES 2: 0.8694 High Apr 14
- RES 1: 0.8670 High Jul 02
- PRICE: 0.8642 @ 06:43 BST Jul 7
- SUP 1: 0.8606 Low Jul 3
- SUP 2: 0.8550/8503 20- and 50-day EMA values
- SUP 3: 0.8459 Low Jun 11
- SUP 4: 0.8407 Low Jun 4
The trend condition in EURGBP is unchanged, it remains bullish and last week’s gains reinforce current conditions. Moving average studies are in a bull-mode position - highlighting a dominant uptrend. 0.8648, 76.4% of the Apr 11 - May 29 downleg, has been pierced. A continuation higher would open 0.8738, the Apr 11 high and a key resistance. Support to watch lies at 0.8541, the 20-day EMA.
USDJPY TECHS: Corrective Bounce
- RES 4: 148.65 High May 12 and a reversal trigger
- RES 3: 148.03 High Jun 23
- RES 2: 146.19/146.77 High Jun 24 / 76.4% of Jun 23 - Jul1 bear leg
- RES 1: 145.23 High Jul 3
- PRICE: 145.08 @ 07:08 BST Jul 7
- SUP 1: 142.68 Low Jul 1
- SUP 2: 142.12 Low May 27 and a key short-term support
- SUP 3: 141.96 76.4% retracement of the Apr 22 - May 12 upleg
- SUP 4: 141.49 Low Apr 23
USDJPY is holding on to its latest gains. The pair has pierced the 50-day EMA, however a close above it is needed to highlight a stronger reversal. For now, gains are considered corrective and a bear threat remains present. Moving average studies are in a bear-mode position, highlighting a dominant downtrend. A resumption of weakness would signal scope for an extension towards 142.12, the May 27 low and a key short-term support.
EURJPY TECHS: Fresh Cycle High
- RES 4: 171.88 High Jul 19 ‘24
- RES 3: 171.28 1.382 proj of the Feb 28 - Mar 18 - Apr 7 price swing
- RES 2: 171.09 High Jul 23 ‘24
- RES 1: 170.73 Intraday high
- PRICE: 170.63 @ 07:19 BST Jul 07
- SUP 1: 169.32 Low Jul 03
- SUP 2: 168.09 20-day EMA
- SUP 3: 167.13 Low Jun 20
- SUP 4: 165.84 50-day EMA
A bull cycle in EURJPY remains intact and the cross is starting the week on a firm note, trading to a fresh cycle high. 170.47, 76.4% of the Jul 11 - Aug 5 sell-off, has been breached. The break strengthens bullish conditions and signals scope for extension towards 171.28 next, a Fibonacci projection. The trend is overbought, a pullback would unwind this condition. Support lies at 168.09, the 20-day EMA.
AUDUSD TECHS: Pullback Appears Corrective
- RES 4: 0.6700 76.4% retracement of the Sep 30 ‘24 - Apr 9 bear leg
- RES 3: 0.6688 High Nov 7 ‘24
- RES 2: 0.6603 High Nov 11 ‘24
- RES 1: 0.6590 High Jul 01
- PRICE: 0.6508 @ 08:03 BST Jul 07
- SUP 1: 0.6500 Intraday low
- SUP 2: 0.6471/6373 50-day EMA / Low Jun 23 and a reversal trigger
- SUP 3: 0.6357 Low May 12
- SUP 4: 0.6275 Low Apr 14
The trend set-up in AUDUSD remains bullish and the latest pullback appears corrective - for now. Recent gains maintain the bullish price sequence of higher highs and higher lows, the definition of an uptrend. Note too that moving average studies are in a bull-mode position, highlighting a dominant uptrend. Sights are on 0.6603 next, the Nov 11 2024 high. Initial firm support to watch is 0.6471, the 50-day EMA.
USDCAD TECHS: Trend Structure Remains Bearish
- RES 4: 1.3920 High May 21
- RES 3: 1.3862 High May 29
- RES 2: 1.3798 High Jun 23
- RES 1: 1.3667/3769 20- and 50-day EMA values
- PRICE: 1.3649 @ 08:09 BST Jul 7
- SUP 1: 1.3557 Low Jul 03
- SUP 2: 1.3540 Low Jun 16 and the bear trigger
- SUP 3: 1.3503 1.618 proj of the Feb 3 - 14 - Mar 4 price swing
- SUP 4: 1.3473 Low Oct 2 2024
The trend needle in USDCAD continues to point south and last week’s move down reinforces current conditions. S/T gains between Jun 16 - 23 appear to have been corrective. Sights are on key support and the bear trigger at 1.3540, Jun 16 low. Clearance of this level would resume the downtrend and open 1.3503, a Fibonacci projection. Pivot resistance is at the 50-day EMA, at 1.3769. A clear break of it would signal scope for a stronger recovery.
FIXED INCOME
BUND TECHS: (U5) Monitoring Resistance At The 50-Day EMA
- RES 4: 132.42 2.000 proj of the May 14 - 20 - 22 price swing
- RES 3: 132.00 Round number resistance
- RES 2: 131.95 High Jun 13 and the bull trigger
- RES 1: 130.76/131.33 High Jul 4 / High Jun 20
- PRICE: 130.50 @ 05:55 BST Jul 7
- SUP 1: 129.77 Low Jul 3 and the bear trigger
- SUP 2: 129.67 76.4% retracement of the May 14 - Jun 13 bull leg
- SUP 3: 129.30 Low May 22
- SUP 4: 128.97 Low May 14 and a reversal trigger
Bund futures are trading above last week’s low. The bounce resulted in a print above 130.52, the 50-day EMA. A clear break of it would highlight a possible reversal. The next important resistance is 131.33, the Jun 20 high. For bears, a resumption of weakness would refocus attention on support at 129.77, the Jul 3 low. Clearance of this support would open 129.30, the May 22 low.
BOBL TECHS: (U5) Trading Above Support
- RES 4: 118.649 1.382 proj of the May 21 - Jun 3 - Jun 5 swing
- RES 3: 118.531 1.236 proj of the May 21 - Jun 3 - Jun 5 swing
- RES 2: 118.390 High Jun 13 and a bull trigger
- RES 1: 118.060 High Jun 20
- PRICE: 117.870 @ 06:06 BST Jul 7
- SUP 1: 117.500 Low Jul 2
- SUP 2: 117.411 0.764 proj of the Jun 13 - 16 - 20 price swing
- SUP 3: 117.210 1.000 proj of the Jun 13 - 16 - 20 price swing
- SUP 4: 117.009 1.236 proj of the Jun 13 - 16 - 20 price swing
A bull cycle in Bobl futures remains intact. Key short-term support at 117.530, the Jun 5 low has recently been pierced but for now, remains intact. A clear break of it would highlight a stronger reversal and cancel the bull theme. This would open 117.470, the May 21 low. Key short-term resistance has been defined at 118.390, the Jun 13 high. Initial firm resistance is 118.060, the Jun 20 high. A breach of this hurdle would be a bullish development.
SCHATZ TECHS: (U5) Resistance Remains Exposed
- RES 4: 107.690 High Apr 30
- RES 3: 107.610 High May 23 and a key near-term resistance
- RES 2: 107.430/475 High Jun 13 / High May 27
- RES 1: 107.365 Intraday high
- PRICE: 107.340 @ 06:14 BST Jul 7
- SUP 1: 107.195/180 Low Jun 6 / 23
- SUP 2: 107.125 Low May 12 and a key support
- SUP 3: 107.000 Round number support
- SUP 4: 106.890 2.000 proj of the May 23 - 29 - 30 price swing
Schatz futures remain inside a range and price continues to trade below the Jun 13 high. Support to watch is 107.195, the Jun 6 low. It has been pierced, a clear break of it would reinstate a bearish threat and signal scope for an extension towards 107.125, the May 12 low. On the upside, clearance of 107.470, the May 30 high, is required to strengthen a bullish condition. Initial firm resistance is 107.430, the Jun 13 high.
GILT TECHS: (U5) Monitoring Resistance
- RES 4: 93.76 High Jul 1 and key resistance
- RES 3: 93.41 High Jul 2
- RES 2: 93.26 76.4% retracement of the Jul 1 -2 sell-off
- RES 1: 92.79 High Jul 4
- PRICE: 92.38 @ Close Jul 4
- SUP 1: 92.12/91.63 Low Jul 3 / 2
- SUP 2: 91.50 61.8% retracement of the May 22 - Jul 1 bull leg
- SUP 3: 91.16 Low Feb 2
- SUP 4: 90.97 76.4% retracement of the May 22 - Jul 1 bull leg
Gilt futures faced strong selling pressure on Jul 2. The move down has cancelled a recent bullish theme - price breached the 20-day EMA and traded through a key support at 92.23, the Jun 16 low. The break suggests potential for an extension towards 91.50 next, a Fibonacci retracement. Price action is volatile. Initial resistance to watch is 92.79, the Jul 4 high. A resumption of gains would open the 93.41 high instead.
BTP TECHS: (U5) Bullish Trend Structure
- RES 4: 122.71 2.764proj of the May 14 - 20 - 21 price swing
- RES 3: 122.35 2.500 proj of the May 14 - 20 - 21 price swing
- RES 2: 122.00 Round number resistance
- RES 1: 121.73 High Jun 13 and the bull trigger
- PRICE: 121.26 @ Close Jul 4
- SUP 1: 120.09 Low Jun 23
- SUP 2: 119.48 Low May 26
- SUP 3: 118.87 Low May 21
- SUP 4: 118.51 Low May 14 and key support
The trend condition in BTP futures remains bullish and short-term phases of weakness appear corrective - for now. Gains in June reinforce a bull theme and maintain the price sequence of higher highs and higher lows. Sights are on the 122.00 handle next. Key support to watch is unchanged at 118.51, the May 14 low. A clear break of this level would highlight a reversal. First support is 120.09, the Jun 23 low.
EQUITIES
EUROSTOXX50 TECHS: (U5) Support Remains Intact
- RES 4: 5486.00 High May 20 and a key bull trigger
- RES 3: 5456.00 High Jun 11
- RES 2: 5403.00 High Jun 12
- RES 1: 5366.00 High Jun 30
- PRICE: 5314.00 @ 06:43 BST Jul 7
- SUP 1: 5194.00 Low Jun 23 and a bear trigger
- SUP 2: 5182.00 Low May 2
- SUP 3: 5100.94 38.2% retracement of the Apr 7 - May 20 bull leg
- SUP 4: 5078.00 Low Apr 30
Short-term trend signals in Eurostoxx 50 futures remain bearish, however, the recovery from the Jun 23 low still appears to be a reversal and the contract is holding on to its most recent gains. Price has pierced both the 20- and 50-day EMAs. A clear break of both averages would strengthen a reversal theme. This would open 5486.00, the May 20 high and bull trigger. On the downside, a breach of 5194.00, the Jun 23 low, reinstates a bearish theme.
E-MINI S&P: (U5) Bulls Remain In The Driver’s Seat
- RES 4: 6402.44 1.382 proj of the May 23 - Jun 11 - 23 price swing
- RES 3: 6381.00 1.764 proj of the Apr 7 - 10 - 21 price swing
- RES 2: 6356.12 1.236 proj of the May 23 - Jun 11 - 23 price swing
- RES 1: 6333.25 High Jul 3
- PRICE: 6293.00 @ 07:25 BST Jul 7
- SUP 1: 6235.50 Low Jul 2
- SUP 2: 6138.46/6000.73 20- and 50-day EMA values
- SUP 3: 5811.50 Low May 23
- SUP 4: 5645.75 Low May 7
The trend condition in S&P E-Minis is unchanged, it remains bullish. Resistance at 6128.75, the Jun 11 high, has recently been breached. The break confirmed a resumption of the uptrend that started Apr 7. This has been followed by a breach of key resistance and a bull trigger at 6277.50, the Feb 21 high. Sights are on 6356.12, a Fibonacci projection. Key support is at the 50-day EMA - at 6000.73.
COMMODITIES
BRENT TECHS: (U5) Bear Threat Remains Present
- RES 4: $85.00 - Round number resistance
- RES 3: $81.99 - 2.764 proj of the Apr 9 - 23 - May 5 price swing
- RES 2: $80.72 - 2.618 proj of the Apr 9 - 23 - May 5 price swing
- RES 1: $72.66/79.40 - 50.0% of the Jun 23-30 range / High Jun 23
- PRICE: $68.07 @ 07:13 BST Jul 7
- SUP 1: $65.92 - Low Jun 30
- SUP 2: $61.39 - Low May 30
- SUP 3: $58.00 - Low May 5
- SUP 4: $57.70 - Low Apr 9 and a key support
Short-term conditions in Brent futures are unchanged, the outlook remains bearish. The contract traded sharply lower on Jun 23, and for now, this sell-off continues to highlight a bearish theme. The 50-day EMA has been breached and note too that $66.17, 61.8% of the May 5 - Jun 23 bull leg, has been pierced. A continuation lower would expose $61.39 next, the May 30 low. Initial resistance to watch is $72.66, a Fibonacci retracement point.
WTI TECHS: (Q5) Gains Appear Corrective For Now
- RES 4: $82.62 - 3.000 proj of the Apr 9 - 23 - May 5 price swing
- RES 3: $80.43 - 2.764 proj of the Apr 9 - 23 - May 5 price swing
- RES 2: $80.00 - Psychological round number
- RES 1: $71.20/78.40 - 50.0% of the Jun 23-24 range / High Jun 23
- PRICE: $66.27 @ 07:21 BST Jul 7
- SUP 1: $64.74/00 - 50-day EMA / Low Jun 24
- SUP 2: $58.87 - Low May 30
- SUP 3: $54.81 - Low May 5
- SUP 4: $54.13 - Low Apr 9 and a key support
WTI futures maintain a softer tone following the reversal from the Jun 23 high. Recent gains appear corrective. Support to watch is the 50-day EMA, at $64.84. It has been pierced, a clear break of it would signal scope for a deeper retracement. This would expose $58.87, the May 30 low. Initial resistance to watch is $71.20, the 50.0% retracement of the Jun 23 - 24 high-low range. Key resistance is at $78.40, the Jun 23 high.
GOLD TECHS: Monitoring Support
- RES 4: $3547.9 - 1.764 proj of the Feb 28 - Apr 3 - Apr 7 price swing
- RES 3: $3500.1 - High Apr 22 and bull trigger
- RES 2: $3395.1/3451.3 - High Jun 23 / 16
- RES 1: $3365.8 - High Jul 3
- PRICE: $3311.2 @ 07:28 BST Jul 7
- SUP 1: $3248.7 - Low Jun 30 and the bear trigger
- SUP 2: $3204.7 - Low May 20
- SUP 3: $3121.0 - Low May 15 and key support
- SUP 4: $3085.0 - 76.4% retracement of the Apr 7 - 22 bull leg
Recent weakness in Gold resulted in a breach of the 50-day EMA, and a trendline drawn from the Dec 30 ‘24 low and connected to the Feb 28 low. A clear break of both trend tools would signal scope for a deeper correction, and open $3245.5, May 29 low. Note that the latest recovery highlights a possible false trendline break. A resumption of gains would refocus attention $3451.3, the Jun 16 high. The bear trigger is $3248.7, the Jun 30 low.
SILVER TECHS: Trend Signals Remain Bullish
- RES 4: $39.026 - 1.382 proj of the Apr 7 - 25 - May 15 swing
- RES 3: $38.246 - 1.236 proj of the Apr 7 - 25 - May 15 swing
- RES 2: $38.000 - Round number resistance
- RES 1: $37.317 - High Jun 18 and the bull trigger
- PRICE: $36.584 @ 08:13 BST Jul 7
- SUP 1: $36.072 - 20-day EMA
- SUP 2: $34.944/31.651 - 50-day EMA / Low May 15
- SUP 3: $30.915/28.351 - Low Apr 11 / 7 and the bear trigger
- SUP 4: $27.686 - Low Sep 6 ‘24
A bull cycle in Silver remains intact. The metal has recently traded through resistance at $34.903, the Oct 23 ‘24 high and a key bull trigger. The break of it marks an important medium-term bullish development. Sights are on the $38.00 handle next. On the downside, initial support to watch lies at $36.072, the 20-day EMA. It has been pierced, a clear break of it would open $34.944, the 50-day EMA.