MNI DAILY TECHNICAL ANALYSIS - Gold Ends Corrective Phase
Price Signal Summary – Gold Gains Signal End of Corrective Phase
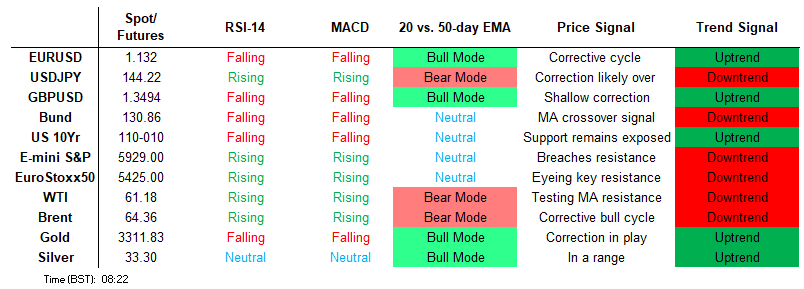
- A bullish trend condition in S&P E-Minis remains intact and the latest pullback appears to have been a correction. Last Friday’s sell-off resulted in a print below the 20-day EMA, at 5794.26. The trend cycle in Eurostoxx 50 futures remains bullish and the recent pullback appears corrective. Moving average studies are in a bull-mode position, highlighting a clear uptrend.
- The trend needle in GBPUSD continues to point north and the latest pullback is considered corrective. The pair has recently cleared 1.3444, the Apr 28 / 29 high. The break confirms a resumption of the uptrend and sights are on 1.3605. Despite yesterday’s strong bounce, a downtrend in USDJPY remains intact and short-term gains are considered corrective. Support at 142.36, the May 6 low, has been pierced. A downtrend in USDCAD remains intact despite Tuesday’s strength and the latest move down reinforces this theme. The pair has traded through support at 1.3751, the May 6 low. This confirms a resumption of the downtrend and maintains the sequence of lower lows and lower highs.
- Recent gains in Gold signals the end of the corrective phase between Apr 22 - May 15. Medium-term trend signals are unchanged, they remain bullish. Note that moving average studies are in a bull-mode position, highlighting a dominant uptrend. WTI futures traded to a fresh S/T cycle high last Wednesday before finding resistance. The recovery since Apr 9, appears corrective. Key resistance to watch is $62.63, the 50-day EMA. It has been pierced, a clear break of it would highlight a stronger reversal.
- Recent gains in Bund futures suggest the move down between Apr 22 - May 15, has been a correction. A stronger resumption of gains would strengthen the reversal and signal scope for a climb towards 132.03, the Apr 7 high. A bear cycle in Gilt futures remains in play and last week’s move lower reinforces the bearish theme. The contract has recovered from its recent lows - gains are considered corrective and this is allowing a short-term oversold condition to unwind.
FOREIGN EXCHANGE
EURUSD TECHS: Corrective Pullback
- RES 4: 1.1625 1.500 proj of the Feb 28 - Mar 18 - 27 price swing
- RES 3: 1.1608 High Nov 9 2021
- RES 2: 1.1573 High Apr 21 and the bull trigger
- RES 1: 1.1453 76.4% retracement of the Apr 21 - May 12 bear leg
- PRICE: 1.1303 @ 06:13 BST May 28
- SUP 1: 1.1277 20-day EMA
- SUP 2: 1.1151/1.1065 50-day EMA and a pivot level / Low May 12
- SUP 3: 1.1026 38.2% retracement of the Feb 3 - Apr 21 bull cycle
- SUP 4: 1.0943 Low Apr 10
Trend conditions in EURUSD are bullish and MA studies are in a bull mode position, highlighting a dominant uptrend. The latest pullback is corrective. The Apr 21 - May 12 bear leg also appears to have been a correction. A resumption of gains would open 1.1453, a Fibonacci retracement. Key support is 1.1151, the 50-day EMA. A clear break of the average would highlight a stronger reversal and signal scope for a deeper retracement.
GBPUSD TECHS: Trend Structure Remains Bullish
- RES 4: 1.3913 High Sep 14 2021
- RES 3: 1.3681 1.500 proj of the Feb 28 - Apr 3 - 7 price swing
- RES 2: 1.3605 1.382 proj of the Feb 28 - Apr 3 - 7 price swing
- RES 1: 1.3593 High May 26
- PRICE: 1.3464 @ 06:25 BST May 28
- SUP 1: 1.3444/3366 High Apr 28 and 29 / 20-day EMA
- SUP 2: 1.3201 50-day EMA
- SUP 3: 1.3140 Low May 12 and key support
- SUP 4: 1.3041 Low Apr 14
The trend needle in GBPUSD continues to point north and the latest pullback is considered corrective. The pair has recently cleared 1.3444, the Apr 28 / 29 high. The break confirms a resumption of the uptrend and sights are on 1.3605, a Fibonacci retracement. Medium-term trend signals highlight a dominant uptrend - moving average studies remain in a bull-mode position. First key support lies at 1.3366, the 20-day EMA.
EURGBP TECHS: Fresh Short-Term Cycle Low
- RES 4: 0.8557 High Apr 28
- RES 3: 0.8541 High May 2
- RES 2: 0.8493 High May 9
- RES 1: 0.8447 50-day EMA and a key near-term resistance
- PRICE: 0.8389 @ 06:43 BST May 28
- SUP 1: 0.8373 Low May 27
- SUP 2: 0.8359 1.236 proj of the Apr 11 - 16 - 21 price swing
- SUP 3: 0.8316 Low Mar 28 and a key support
- SUP 4: 0.8277 1.618 proj of the Apr 11 - 16 - 21 price swing
A bear cycle in EURGBP remains in play and a fresh cycle low yesterday reinforces this theme. Resistance to watch is at the 50-day EMA at 0.8447. A clear break of this average is required to highlight a stronger reversal and shift attention to resistance at 0.8541, the May 2 high. On the downside, a resumption of the downtrend would pave the way for a move towards 0.8359, a Fibonacci projection.
USDJPY TECHS: Trend Needle Points
- RES 4: 150.49 High Apr 2
- RES 3: 149.28 High Apr 3
- RES 2: 148.65 High May 12 and a key resistance
- RES 1: 144.77/145.68 Intraday high / 50-day EMA
- PRICE: 144.28 @ 07:04 BST May 28
- SUP 1: 142.12 Low May 27
- SUP 2: 141.96 76.4% retracement of the Apr 22 - May 12 bull leg
- SUP 3: 139.89 Low Apr 22 and a bear trigger
- SUP 4: 138.82 1.50 proj of the Feb 12 - Mar 11 - 28 price swing
Despite yesterday’s strong bounce, a downtrend in USDJPY remains intact and short-term gains are considered corrective. Support at 142.36, the May 6 low, has been pierced. A clear break of it would open 139.89, the Apr 22 low and the next key support. On the upside, key short-term resistance has been defined at 148.65, the May 12 high. Initial firm resistance to watch is 145.68, the 50-day EMA.
EURJPY TECHS: Remains ABove Support
- RES 4: 166.69 High Oct 31 2024 and a key resistance
- RES 3: 166.10 High Nov 6
- RES 2: 165.21/43 High May 13 / High Nov 8 2024
- RES 1: 164.07 High May 15
- PRICE: 163.37 @ 17:06 BST May 27
- SUP 1: 161.09 Low May 23
- SUP 2: 160.99 Low Apr 22
- SUP 3: 160.01 50% Retracement Feb’25 - May’25 Upleg
- SUP 4: 159.48 Low Apr 9
EURJPY has recovered from its lows and for now, this undermines the recent bearish theme and signals the end of the recent corrective leg between May 13 - 23, and a likely resumption of the uptrend. Key short-term support has been defined at 161.09, the May 23 low, where a break is required to suggest scope for a deeper correction. A continuation higher would expose 165.21, the May 13 high and bull trigger.
AUDUSD TECHS: Corrective Pullback
- RES 4: 0.6603 High Nov 11 ‘24
- RES 3: 0.6582 High Nov 12 ‘24
- RES 2: 0.6550 61.8% retracement of the Sep 30 ‘24 - Apr 9 bear leg
- RES 1: 0.6537 High May 26
- PRICE: 0.6433 @ 08:06 BST May 28
- SUP 1: 0.6425 20-day EMA
- SUP 2: 0.6376/57 50-day EMA / Low May 12
- SUP 3: 0.6275 Low Apr 14
- SUP 4: 0.6181 Low Apr 11
AUDUSD trend signals remain bullish and the latest pullback is considered corrective. The pair has cleared a key short-term resistance at 0.6515, the May 7 high. This confirms a triangle breakout and marks a resumption of the uptrend. Sights are on 0.6550, a Fibonacci retracement. Key support lies at 0.6379, the 50-day EMA. A clear break of this average is required to signal a potential short-term reversal.
USDCAD TECHS: Trend Remains Bearish And Gains Appear Corrective
- RES 4: 1.4200 Round number resistance
- RES 3: 1.4111 High Apr 4
- RES 2: 1.3977/1.4016 50-day EMA / High May 12 and 13
- RES 1: 1.3875 20-day EMA
- PRICE: 1.3777 @ 07:58 BST May 27
- SUP 1: 1.3686 Low May 26
- SUP 2: 1.3643 Low Oct 9 ‘24
- SUP 3: 1.3579 1.500 proj of the Feb 3 - 14 - Mar 4 price swing
- SUP 4: 1.3503 1.618 proj of the Feb 3 - 14 - Mar 4 price swing
A downtrend in USDCAD remains intact and short-term gains are considered corrective. The pair has recently traded through support at 1.3751, the May 6 low. This confirmed a resumption of the downtrend and has maintained the sequence of lower lows and lower highs. Scope is seen for an extension towards the 1.3600 handle while further out, the move down opens 1.3420, the Sep 25 ‘24 low. Initial resistance is 1.3875, the 20-day EMA.
FIXED INCOME
BUND TECHS: (M5) Outlook Bullish
- RES 4: 132.56 High Feb 28 and a key resistance
- RES 3: 132.03 High Apr 7 and the bull trigger
- RES 2: 131.72 High May 7
- RES 1: 131.22 High May 27
- PRICE: 130.76 @ 05:47 BST May 28
- SUP 1: 130.46 50-day EMA
- SUP 2: 129.49/13 Low May 22 / 15 and key short-term support
- SUP 3: 129.02 Low Apr 10
- SUP 4: 128.60 Low Apr 9 and a key support
Recent gains in Bund futures suggest the move down between Apr 22 - May 15, has been a correction. A stronger resumption of gains would strengthen the reversal and signal scope for a climb towards 132.03, the Apr 7 high. This week’s climb reinforces a bullish theme. Key short-term support to watch is 129.13, the May 15 low. A break would be bearish and mark a resumption of the recent bear cycle.
BOBL TECHS: (M5) Bull Cycle Intact
- RES 4: 119.960 High Apr 7 and the bull trigger
- RES 3: 119.780 High Apr 22
- RES 2: 119.600 High May 7
- RES 1: 119.250 High May 23
- PRICE: 118.950 @ 06:01 BST May 28
- SUP 1: 118.717/390 50-day EMA / Low May 22
- SUP 2: 118.060 Low May 14 and 15 and the bear trigger
- SUP 3: 117.680 Low Apr 9 and a key support
- SUP 4: 117.600 Low Mar 28
The recovery since May 14 in Bobl futures signals a reversal and the end of the Apr 22 - May 15 corrective cycle. A continuation higher would pave the way for a move towards 119.600, the May 7 high. Further out, scope would be for an extension towards 119.960, the Apr 7 high and a key resistance. On the downside, key support and the bear trigger lies at 118.060, the May 14 / 15 low.
SCHATZ TECHS: (M5) Bull Cycle Still In Play
- RES 4: 107.812 0.618 proj of the Mar 6 - Apr 7 - 9 price swing
- RES 3: 107.775 High Apr 7 and the bull trigger
- RES 2: 107.600 High Apr 30
- RES 1: 107.550 High May 7 and last Friday’s high
- PRICE: 107.340 @ 06:12 BST May 28
- SUP 1: 107.195/070 Low May 22 / 13 and the bear trigger
- SUP 2: 106.965 Low Apr 9 and a key support
- SUP 3: 106.928 61.8% retracement of the Mar 6 - Apr 7 bull cycle
- SUP 4: 106.830 Low Mar 27
The current bull cycle in Schatz futures remains intact. Resistance at 107.335, the May 12 / 20 high, has been cleared. The break signals a stronger reversal and exposes 107.550, the May 7 high. A clear breach of this level would strengthen a bullish theme. For bears, a resumption of the recent bear leg would instead signal scope for an extension towards 106.965, the Apr 9 low. The bear trigger has been defined at 107.070, the May 13 low.
GILT TECHS: (U5) Monitoring Resistance
- RES 4: 92.53 High May 8 (cont)
- RES 3: 92.40 Low May 8
- RES 2: 92.00 Round number resistance
- RES 1: 91.87/89 High May 20 / 27 and key near-term resistance
- PRICE: 91.27 @ Close May 27
- SUP 1: 91.08/90.46 Low May 27 / 23
- SUP 2: 90.11 Low May 22 and the bear trigger
- SUP 3: 90.00 Round number support
- SUP 4: 89.68 Low Jan 15 (cont)
A bear cycle in Gilt futures remains in play and last week’s move lower reinforces the bearish theme. The contract has recovered from its recent lows - gains are considered corrective and this is allowing a short-term oversold condition to unwind. The bear trigger has been defined at 90.11, the May 22 low. Key short-term resistance to watch is 91.87, the May 20 high. It has been pierced, a clear break of this level is required to highlight a stronger reversal.
BTP TECHS: (M5) Resumes Its Uptrend
- RES 4: 122.00 Round number resistance
- RES 3: 121.93 76.4% of the Dec 5 ‘24 - Mar 14 bear leg (cont)
- RES 2: 121.43 1.618 proj of the Mar 14 - Apr 4 - 9 price swing
- RES 1: 121.00 High Feb 7 (cont) and a key resistance
- PRICE: 120.76 @ Close May 27
- SUP 1: 119.93 20-day EMA
- SUP 2: 119.40/00 50-day EMA / Low May 14
- SUP 3: 118.76/09 Low Apr 15 / 14
- SUP 4: 117.28 Low Apr 10
A bull cycle in BTP futures remains intact and this week’s gains reinforce current conditions. Key support to watch lies at 119.40, the 50-day EMA. A clear break of the average would signal scope for a deeper retracement, and open 118.76 initially, the Apr 15 low. On the upside, key resistance and the bull trigger at 120.72, the May 8 high, has been breached. This confirms a resumption of the uptrend and opens the 121.00 handle next.
EQUITIES
EUROSTOXX50 TECHS: (M5) Key Resistance Remains Exposed
- RES 4: 5600.00 Round number resistance
- RES 3: 5565.23 1.618 proj of the Apr 7 - 9 - 10 price swing
- RES 2: 5516.00 High Mar 3 and the key bull trigger
- RES 1: 5475.00 High May 20
- PRICE: 5421.00 @ 06:23 BST May 28
- SUP 1: 5324.51 20-day EMA
- SUP 2: 5238.48 50-day EMA and a key support
- SUP 3: 5142.00 Low May 2
- SUP 4: 5055.00 Low Apr 30
The trend cycle in Eurostoxx 50 futures remains bullish and the recent pullback appears corrective. Moving average studies are in a bull-mode position, highlighting a clear uptrend and recent gains maintain the sequence of higher highs and higher lows. Sights are on 5516.00, the Mar 3 high and the key bull trigger. Key support to watch lies at 5238.48, the 50-day EMA. Clearance of this average would signal a possible reversal.
E-MINI S&P: (M5) Bulls Remain In The Driver’s Seat
- RES 4: 6080.75 High Feb 26
- RES 3: 6057.00 High Mar 3
- RES 2: 6000.00 Round number resistance
- RES 1: 5993.50 High May 20 and the bull trigger
- PRICE: 5931.25 @ 07:23 BST May 28
- SUP 1: 5756.50/5728.00 Low May 23 / 50-day EMA and key support
- SUP 2: 5596.00 Low May 7
- SUP 3: 5455.50 Low Apr 30
- SUP 4: 5355.25 Low Apr 24
A bullish trend condition in S&P E-Minis remains intact and the latest pullback appears to have been a correction. Last Friday’s sell-off resulted in a print below the 20-day EMA, at 5794.26. A key support lies at 5728.00, the 50-day EMA. A clear break of this average is required to highlight a stronger reversal and signal scope for a deeper retracement. Sights are on the bull trigger at 5993.50, the May 20 high.
COMMODITIES
BRENT TECHS: (N5) Trading Closer To Its Recent Highs
- RES 4: $75.81 - High Feb 20
- RES 3: $74.63 - High Apr 2 and a bull trigger
- RES 2: $68.28 - 61.8% retracement of the Apr 2 - 9 sell-off
- RES 1: $66.05/81 - 50-day EMA / High May 13
- PRICE: $64.26 @ 07:07 BST May 28
- SUP 1: $58.00 - Low April 9 and the bear trigger
- SUP 2: $56.29 - 2.236 proj of the Feb 20 - Mar 5 - Apr 2 price swing
- SUP 3: $55.10 - 2.382 proj of the Feb 20 - Mar 5 - Apr 2 price swing
- SUP 4: $54.00 - Round number support
Brent futures are in consolidation mode and continue to trade closer to their recent highs. The medium-term trend condition is bearish and recent gains appear corrective. Attention is on $66.05, the 50-day EMA. It has been pierced. A clear break of the EMA would highlight a stronger bull cycle and expose $68.28, a Fibonacci retracement. A reversal lower would open $58.00, the Apr 9 low.
WTI TECHS: (N5) Shooting Star Reversal Signal
- RES 4: $72.12 - High Feb 20
- RES 3: $71.10 - High Apr 2 and key resistance
- RES 2: $65.82 - High Apr 4 2 and key resistance
- RES 1: $62.63/64.19 - 50-day EMA / High May 21
- PRICE: $61.06 @ 07:17 BST May 28
- SUP 1: $54.33 - Low April 9 and the bear trigger
- SUP 2: $53.30 - 2.236 proj of the Feb 20 - Mar 5 - Apr 2 price swing
- SUP 3: $52.14 - 2.382 proj of the Jan 15 - Feb 4 - 11 price swing
- SUP 4: $50.00 - Psychological round number
WTI futures traded to a fresh S/T cycle high last Wednesday before finding resistance. The recovery since Apr 9, appears corrective. Key resistance to watch is $62.63, the 50-day EMA. It has been pierced, a clear break of it would highlight a stronger reversal and open $65.82, Apr 4 high. For bears a reversal lower would refocus attention on $54.33, the Apr 9 low and bear trigger. The price pattern on May 21 is a shooting star - a bearish signal.
GOLD TECHS: MA Studies Still Highlight A Dominant Uptrend
- RES 4: $3578.0 - 2.000 proj of the Dec 19 - Feb 24 - Feb 28 swing
- RES 3: $3547.9 - 1.764 proj of the Feb 28 - Apr 3 - Apr 7 price swing
- RES 2: $3435.6/3500.1 - High May 7 / High Apr 22 and bull trigger
- RES 1: $3365.9 - High May 23
- PRICE: $3302.4 @ 07:21 BST May 28
- SUP 1: $3284.6/3202.9 - 20- and 50-day EMA values
- SUP 2: $3121.0 - Low May 15 and key support
- SUP 3: $3085.0 - 61.8% retracement of the Apr 7 - Apr 22 upleg
- SUP 4: $3100.0 - Round number support
Recent gains in Gold signals the end of the corrective phase between Apr 22 - May 15. Medium-term trend signals are unchanged, they remain bullish. Note that moving average studies are in a bull-mode position, highlighting a dominant uptrend. A continuation higher would open $3435.6 next, the May 7 high. Key support and the bear trigger has been defined at $3121.0, the May 15 low.
SILVER TECHS: Trend Structure Remains Bullish
- RES 4: $36.000 - Round number resistance
- RES 3: $34.903 - High Oct 23 ‘24 and the bull trigger
- RES 2: $34.590 - High Mar 28
- RES 1: $33.686/700 - High Apr 25 / Intraday high
- PRICE: $33.292 @ 08:12 BST May 28
- SUP 1: $31.651 - Low May 15
- SUP 2: $30.915/28.351 - Low Apr 11 / 7 and the bear trigger
- SUP 3: $27.686 - Low Sep 6 ‘24
- SUP 4: $27.180 - Low Aug 14 ‘24
A bullish theme in Silver remains intact and recent gains reinforce this condition. Key short-term support has been defined at $31.651, the May 15 low. A clear break of this level would signal scope for a deeper retracement and open $30.915, the Apr 11 low. For bulls, resistance to watch is $33.686, the Apr 25 high. It has been pierced, a clear break of it would confirm a resumption of the uptrend.