MNI DAILY TECHNICAL ANALYSIS - Gold Continues to Benefit
Price Signal Summary - Gold Continues to Benefit
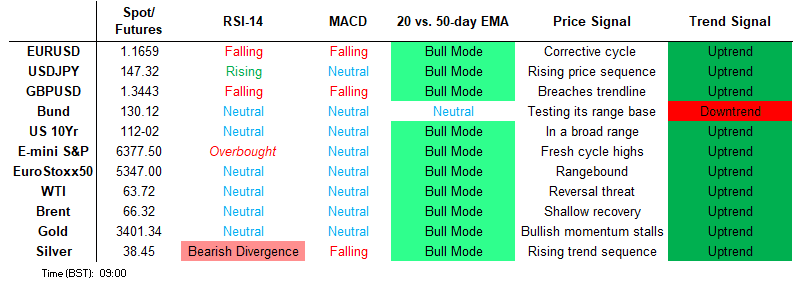
- While the e-mini S&P faded into the Thursday close, the bulk of the bounce off the NFP low is holding firm, keeping the underlying uptrend intact for now. The index holds above support at the 20-day EMA, at 6336.50. The bounce off post-NFP lows in global equity indices persists, with the Eurostoxx 50 future recovering back above the 50-day EMA into the Thursday close.
- EURUSD edged higher to a new recovery high Thursday, before fading into the close. Price has cleared the post-NFP high to keep the recovery off the late July pullback low intact. EURGBP corrected lower Thursday on the BoE rate decision, which sent prices through the weekly low. Despite the intraday weakness, support to watch remains out of reach for now at the 0.8606 50-day EMA. AUDUSD rallied well off the week’s lowest levels last week on broad USD weakness. Last week, the pair traded through both the 20- and 50-day EMAs. This undermined the recent bullish theme and signals the likely start of a corrective cycle.
- Gold continues to benefit from the soft NFP print on Friday and broad USD weakness across the week. This returns prices toward the top-end of the recent range and supports the view that short-term weakness is corrective. WTI futures trade poorly early Friday, having cracked the 50-day EMA and extended losses on the week. This keeps S/T momentum pointed lower. Support at the 50-day EMA has been cleared.
- Bund futures traded sharply higher to close last week - and the constructive theme persists. While prices have faded since, the 50-day EMA of 130.12 has been pierced, reinforcing a bullish theme. Gilt futures traded higher again mid-week - holding firm for much of Wednesday trade. This builds on the gains posted through Friday’s sharp rally. This marks an acceleration of the current bull cycle - with prices breaching resistance at 92.15.
FOREIGN EXCHANGE
EURUSD TECHS: Making Further Progress
- RES 4: 1.1851 High Sep 10 2021
- RES 3: 1.1829 High Jul 01 and the bull trigger
- RES 2: 1.1789 High Jul 24
- RES 1: 1.1699 High Aug 7
- PRICE: 1.1663 @ 08:38 BST Aug 8
- SUP 1: 1.1401 Low Jul 30 and a bear trigger
- SUP 2: 1.1373 Low Jun 10
- SUP 3: 1.1313 Low May 30
- SUP 4: 1.1184 38.2% retracement of the Feb 3 - Jul 1 bull cycle
Prices edged higher to a new recovery high Thursday, before fading into the close. Price has cleared the post-NFP high to keep the recovery off the late July pullback low intact. This works against the bearish backdrop that’s dominated the pullback from 1.1829. The break of firm resistance into 1.1607, the 20-day EMA, is signaling greater odds of a further reversal higher. Major support below rests at 1.1373 next, the Jun 10 low.
GBPUSD TECHS: Tops 50-day EMA on Hawkish BoE
- RES 4: 1.3681 High Jul 4
- RES 3: 1.3620 High Jul 10
- RES 2: 1.3589 High Jul 24
- RES 1: 1.3453 Low Aug 8
- PRICE: 1.3448 @ 08:42 BST Aug 8
- SUP 1: 1.3144 38.2% retracement of the Jan 13 - Jul 1 bull cycle
- SUP 2: 1.3041 Low Apr 14
- SUP 3: 1.3000 Round number support
- SUP 4: 1.2945 50.0% retracement of the Jan 13 - Jul 1 bull cycle
Prices rallied again overnight, building on the gains posted after the break of the 50-day EMA on the hawkish turnout to the August BoE rate decision. This firms the speed of the recovery off the 1.3142 pullback low and signals a greater probability of a bullish reversal. For now, S/T momentum is still pointed higher, with the Jul 24 high of 1.3589 the next notable upside level. While the bounce off the pullback low persists, the more medium-term trend remains bearish - but the risk of a return to recent lows has fallen.
EURGBP TECHS: Returns Lower, But Support Out of Reach
- RES 4: 0.8835 High May 3 2023
- RES 3: 0.8800 Round number resistance
- RES 2: 0.8781 2.236 pro of the Mar 3 - 11 - 28 price swing
- RES 1: 0.8735/8769 High Aug 3 / High Jul 27 and the bull trigger
- PRICE: 0.8674 @ 08:44 BST Aug 8
- SUP 1: 0.8611 Low Jul 31
- SUP 2: 0.8597 50-day EMA
- SUP 3: 0.8540 Low Jun 30
- SUP 4: 0.8508 Low Jun 27
EUR/GBP corrected lower Thursday on the BoE rate decision, which sent prices through the weekly low. Despite the intraday weakness, support to watch remains out of reach for now at the 0.8606 50-day EMA. A clear break of it would strengthen a bear threat. More broadly, the trend set-up is bullish. Moving average studies remain in a bull-mode position highlighting a clear uptrend. Key resistance and the bull trigger is at 0.8769, the Jul 27 high.
USDJPY TECHS: Cracks Support
- RES 4: 152.31 High Feb 19
- RES 3: 151.62 61.8% retracement of the Jan 10 - Apr 22 bear leg
- RES 2: 151.21 High Mar 28
- RES 1: 150.92 High Aug 1
- PRICE: 147.33 @ 08:46 BST Aug 7
- SUP 1: 146.65 50-day EMA
- SUP 2: 146.64 1.0% 10-dma envelope
- SUP 3: 146.62 Low Aug 5
- SUP 4: 145.86 Low Jul 24
USDJPY reversed sharply from Friday’s intraday high and this is allowing a short-term overbought condition to unwind. While the pullback in prices Friday may have been corrective, the break and close below 147.57, the 20-day EMA, is a concern. A clear break of this support zone would undermine the recent bull theme. A break of last week’s 150.92 high would resume the uptrend.
EURJPY TECHS: Trend Structure Remains Bullish
- RES 4: 177.08 2.000 proj of the Feb 28 - Mar 18 - Apr 7 price swing
- RES 3: 175.43 High Jul 11 ‘24 and a key medium-term resistance
- RES 2: 174.86 1.764 proj of the Feb 28 - Mar 18 - Apr 7 price swing
- RES 1: 173.97 High Jul 28 and the bull trigger
- PRICE: 171.73 @ 08:48 BST Aug 8
- SUP 1: 169.73/45 Low Jul 31 / 23.6% of the Feb 28 - Jul 28 bull leg
- SUP 2: 169.52 50-day EMA
- SUP 3: 168.46 Low Jul 1
- SUP 4: 167.46 Low Jun 23
A bullish trend condition in EURJPY remains intact and for now the recent move down is considered corrective. Key support to watch lies at the 50-day EMA at 169.52. A clear break of the EMA is required to highlight a stronger short-term bearish threat. Moving average studies remain in a bull-mode position highlighting an uptrend. A break of the Jul 28 high of 173.97, would resume the bull cycle.
AUDUSD TECHS: Consolidation Mode
- RES 4: 0.6700 76.4% retracement of the Sep 30 ‘24 - Apr 9 bear leg
- RES 3: 0.6688 High Nov 7 ‘24
- RES 2: 0.6677 0.764 proj of the Jun 23 - Jul 11 - 17 price swing
- RES 1: 0.6541/6625 High Aug 7 / 24 and the bull trigger
- PRICE: 0.6529 @ 08:49 BST Aug 8
- SUP 1: 0.6419 Low Aug 1
- SUP 2: 0.6373 Low Jun 23 and a bear trigger
- SUP 3: 0.6354 38.2% retracement of the Apr 9 - Jul 24 upleg
- SUP 4: 0.6323 Low Apr 16
AUDUSD rallied well off the week’s lowest levels last week on broad USD weakness. Last week, the pair traded through both the 20- and 50-day EMAs. This undermined the recent bullish theme and signals the likely start of a corrective cycle. Note that support 0.6455 the Jul 17 low, has also been cleared. The breach strengthens a bearish threat and signals scope for an extension towards 0.6373, the Jun 23 low. Key resistance has been defined at 0.6625 the Jul 24 high. It also represents the bull trigger.
USDCAD TECHS: Shallow Bounce Off Lows
- RES 4: 1.4111 High Apr 10
- RES 3: 1.4019 38.2% retracement of the Feb 3 - Jun 16 bear leg
- RES 2: 1.3920 High May 21
- RES 1: 1.3879 High Aug 1
- PRICE: 1.3734 @ 08:51 BST Aug 8
- SUP 1: 1.3557 Low Jul 03
- SUP 2: 1.3540 Low Jun 16 and the bear trigger
- SUP 3: 1.3503 1.618 proj of the Feb 3 - 14 - Mar 4 price swing
- SUP 4: 1.3473 Low Oct 2 2024
USDCAD remains subdued, despite the shallow bounce off the Thursday low. The pair remains notably lower on the week on the back of last Friday’s USD weakness. Initial firm support has been breached at the 1.3733 20-day EMA, a break below which would resume the correction off the early August high at 1.3879. On the recent run higher, price traded through the 50-day EMA at 1.3743, which aided the rally. This week’s price action, however, has cancelled that bullish threat and returned focus lower. The 100-dma becomes a key pivot point at 1.3835 last.
FIXED INCOME
BUND TECHS: (U5) Tops 50-day EMA
- RES 4: 131.33 High Jun 20
- RES 3: 130.85 61.8% retracement of the Jun 13 - Jul 14 bear leg
- RES 2: 130.76 High Jul 22
- RES 1: 130.60 High Aug 5
- PRICE: 130.14 @ 07:09 BST Aug 8
- SUP 1: 128.84 Low Jul 25 and the bear trigger
- SUP 2: 128.40 Low Apr 9
- SUP 3: 128.19 Low Mar 27 (cont)
- SUP 4: 127.83 76.4% retracement of the Mar 11 - Apr 7 bull leg (cont)
Bund futures traded sharply higher to close last week - and the constructive theme persists. While prices have faded since, the 50-day EMA of 130.12 has been pierced, reinforcing a bullish theme. A continuation higher would open 130.76, the Jul 22 high. The sell-off on Jul 25, resulted in a test of the base of a 3.5-month range at the 129.00 handle. Price has recovered and this key support remains intact, for now. A hammer candle formation on Jul 25 followed by a bullish engulfing candle on Jul 28 signals a potential reversal. Key support to watch is 128.84, the Jul 25 low.
BOBL TECHS: (U5) Tops First Resistance
- RES 4: 118.390 High Jun 13
- RES 3: 118.030 High Jul 22 and a key resistance
- RES 2: 117.627 50-day EMA
- RES 1: 117.710 High Aug 5
- PRICE: 117.510 @ 07:10 BST Aug 8
- SUP 1: 116.970 Low Jul 25 and a bear trigger
- SUP 2: 116.840 Low Mar 18 (cont)
- SUP 3: 116.800 Low Mar 17 (cont)
- SUP 4: 116.637 76.4% retracement of the Mar 6 - Apr 7 bull leg (cont)
Following the early August rally, prices have faded slightly off the weekly high but are holding the bulk of the recent strength. Bobl futures have pierced first resistance of 117.627 (the 50-day EMA), improving the short-term outlook. The bullish candle pattern on Jul 25 and 28 - a hammer formation followed by an engulfing signal - highlights a potential base. A continuation higher would open 118.030, the Jul 22 high. The bear trigger lies at 116.970, the Jul 25 low.
SCHATZ TECHS: (U5) Support Remains Intact For Now
- RES 4: 107.430 High Jun 13
- RES 3: 107.360 High Jul 22 and a key resistance
- RES 2: 107.229 50-day EMA
- RES 1: 107.168 20-day EMA
- PRICE: 107.100 @ 07:13 BST Aug 8
- SUP 1: 107.010 Low Jul 25 and a bear trigger
- SUP 2: 107.993 1.500 proj of the Jul 7 - 11 - 22 price swing
- SUP 3: 106.964 1.618 proj of the Jul 7 - 11 - 22 price swing
- SUP 4: 106.928 1.764 proj of the Jul 7 - 11 - 22 price swing
The sell-off in Schatz futures between Jul 23 - 25, resulted in a break of key short-term support at 107.120, the Jul 11 low and a bear trigger. However, the contract has recovered from the Jul 25 low and recent price patterns highlight a potential base. A resumption of gains would expose resistance at the 20-day EMA, at 107.168. The 50-day EMA is at 107.229. On the downside, key support and the bear trigger has been defined at 107.010, the Jul 25 low.
GILT TECHS: (U5) Bull Cycle Holds
- RES 4: 93.13 76.4% retracement of the Jul 1 - 18 bear leg
- RES 3: 93.08 1.0% 10-dma envelope
- RES 2: 93.00 Round number resistance
- RES 1: 92.84 High Aug 5
- PRICE: 92.40 @ Close Aug 7
- SUP 1: 92.11 20-day EMA
- SUP 2: 91.44/08 Low Aug 1 / 18 and the bear trigger
- SUP 3: 90.97 76.4% retracement of the May 22 - Jul 1 bull leg
- SUP 4: 90.59 Low May 29
Gilt futures traded higher again mid-week - holding firm for much of Wednesday trade. This builds on the gains posted through Friday’s sharp rally. This marks an acceleration of the current bull cycle - with prices breaching resistance at 92.15, the Jul 22 high as well as 92.74, the 61.8% retracement of the Jul 1 - 18 bear leg. The 76.4% retracement is at 93.13. On the downside, key support and the bear trigger has been defined at 91.08, the Jul 18 low.
BTP TECHS: (U5) Resistance Remains Exposed
- RES 4: 122.35 2.500 proj of the May 14 - 20 - 21 price swing
- RES 3: 122.00 Round number resistance
- RES 2: 121.73 High Jun 13 and the bull trigger
- RES 1: 121.70 High Aug 5
- PRICE: 121.35 @ 07:22 BST Aug 8
- SUP 1: 119.59 Low Jul 25 and key short-term support
- SUP 2: 119.48 Low May 26
- SUP 3: 118.87 Low May 21
- SUP 4: 118.51 Low May 14 and key support
The primary trend condition in BTP futures is unchanged, it remains bullish and weakness into the late July lows appears to have been corrective. A doji candle on Jul 25 highlights a potential bullish reversal. A continuation higher would open 121.73, the Jul 13 high and a bull trigger. Clearance of this latter level would confirm a resumption of the uptrend. Key short-term support has been defined at 119.59, the Jul 25 low.
EQUITIES
EUROSTOXX50 TECHS: (U5) Recovery Firms
- RES 4: 5575.00 High Mar 3 and a major resistance (cont)
- RES 3: 5526.00 High Mar 19 / 20 (cont)
- RES 2: 5486.00/88.00 High May 20 and a bull trigger / High Jul 10
- RES 1: 5449.00 High Jul 27
- PRICE: 5359.00 @ 07:29 BST Aug 8
- SUP 1: 5166.00 Low Aug 1
- SUP 2: 5155.65 3.0% 10-dma envelope
- SUP 3: 5138.00 High Apr 30
- SUP 4: 5078.00 Low Apr 30
The bounce off post-NFP lows in global equity indices persists, with the Eurostoxx 50 future recovering back above the 50-day EMA into the Thursday close. A further resumption of gains would refocus attention on 5486.00, the May 20 high. It has recently been pierced, a clear breach of it would resume the bull cycle. To the downside, last Friday’s weakness did result in a temporary breach of the bear trigger - this makes the April 30 hi/lo range at 5078-5138 the area of downside interest.
E-MINI S&P: (U5) Bounce Holds
- RES 4: 6523.63 1.764 proj of the May 23 - Jun 11 - 23 price swing
- RES 3: 6500.00 Round number resistance
- RES 2: 6477.31 1.618 proj of the May 23 - Jun 11 - 23 price swing
- RES 1: 6468.50 High Jul 31 and the bull trigger
- PRICE: 6378.75 @ 07:25 BST Aug 8
- SUP 1: 6239.50 Low Aug 1
- SUP 2: 6238.83 2.0% 10-dma Envelope
- SUP 3: 6216.34 50-day EMA
- SUP 4: 6213.75 50% retracement of Jun - Aug Upleg
While prices faded into the Thursday close, the bulk of the bounce off the NFP low is holding firm, keeping the underlying uptrend intact for now. The index holds above support at the 20-day EMA, at 6336.50. Through the sell-off, the 50-day EMA at 6216.34, has held as support. Clearance of this average is required to signal a stronger reversal. The primary trend remains up, leaving key short-term resistance and the bull trigger at 6468.50, the Jul 31 high.
COMMODITIES
BRENT TECHS: (V5) Fresh Lows
- RES 4: $83.02 - 3.000 proj of the Apr 9 - 23 - May 5 price swing
- RES 3: $81.07 - 2.764 proj of the Apr 9 - 23 - May 5 price swing
- RES 2: $79.86 - 2.618 proj of the Apr 9 - 23 - May 5 price swing
- RES 1: $72.89/77.73 - 61.8% of the Jun 23-30 downleg / High Jun 23
- PRICE: $65.84 @ 07:47 BST Aug 8
- SUP 1: $65.80/65.06 - Low Aug 8 / Jun 30
- SUP 2: $60.96 - Low May 30
- SUP 3: $58.18 - Low May 5
- SUP 4: $57.74 - Low Apr 9 and a key support
Weakness across Brent futures persists early Friday, with fresh pullback lows through the European open. This extends the spell of weakness posted off the break of $71.40, the 50.0% retracement of the Jun 23 - 50 downleg. A further reversal would refocus attention on key support and the bear trigger at $65.06, the Jun 30 low. A break of this level would resume the recent bearish theme. The next resistance to watch remains $72.89, the 61.8% retracement point.
WTI TECHS: (U5) Cracks 50-day EMA Support
- RES 4: $81.12 - 3.000 proj of the Apr 9 - 23 - May 5 price swing
- RES 3: $80.00 - Psychological round number
- RES 2: $77.75 - 2.618 proj of the Apr 9 - 23 - May 5 price swing
- RES 1: $70.96/75.98 - 61.8% of the Jun 23-24 downleg / High Jun 23
- PRICE: $63.22 @ 07:48 BST Aug 8
- SUP 1: $62.84 - Low Jun 24 and bear trigger
- SUP 2: $58.17 - Low May 30
- SUP 3: $54.66 - Low May 5
- SUP 4: $54.01 - Low Apr 9 and a key support
WTI futures trade poorly early Friday, having cracked the 50-day EMA and extended losses on the week. This keeps S/T momentum pointed lower. Support at the 50-day EMA has been cleared - a bearish signal. The clear break exposes $58.17, the May 30 low. Gains early last week marked an extension of a corrective cycle - which may now have concluded. $69.41 marks the 50.0% retracement of the Jun 23-24 downleg - an important level at the close. A continuation higher would open $70.96 next, the 61.8% retracement point.
GOLD TECHS: Returns Higher
- RES 4: $3547.9 - 1.764 proj of the Feb 28 - Apr 3 - Apr 7 price swing
- RES 3: $3500.1 - High Apr 22 and bull trigger
- RES 2: $3451.3 - High Jun 16
- RES 1: $3409.2/3439.0 - High Aug 8 / 23
- PRICE: $3394.7 @ 08:00 BST Aug 8
- SUP 1: $3268.2 - Low Jul 30
- SUP 2: $3248.7 - Low Jun 30 and the bear trigger
- SUP 3: $3204.7 - Low May 20
- SUP 4: $3121.0 - Low May 15 and key support
Gold continues to benefit from the soft NFP print on Friday and broad USD weakness across the week. This returns prices toward the top-end of the recent range and supports the view that short-term weakness is corrective - for now - and a bull cycle that started Jun 30 remains intact. However, the yellow metal has traded through support at $3329.9, the 50-day EMA. A clear break of this level continues to signal scope for a deeper retracement and exposes the next key support at $3248.7, the Jun 30 low. Key near-term resistance is $3439.0, the Jul 23 high.
SILVER TECHS: Recovers Off Support
- RES 4: $41.064 - 1.764 proj of the Apr 7 - 25 - May 15 swing
- RES 3: $40.285 - 1.618 proj of the Apr 7 - 25 - May 15 swing
- RES 2: $40.000 - Psychological round number
- RES 1: $39.655 - 1.500 proj of the Apr 7 - 25 - May 15 swing
- PRICE: $38.353 @ 08:03 BST Aug 8
- SUP 1: $36.216 - Low Jul 31
- SUP 2: $35.285 - Low Jun 24
- SUP 3: $33.940 - 50.0% retracement of the Apr 7 - Jul 23 bull leg
- SUP 4: $32.958 - Low Jun 2
Trend signals in Silver remain bullish despite the unconstructive price action into the end of July. The pullback off the late July highs is considered corrective - particularly as prices have recovered off support at the $36.760 50-day EMA. It has been pierced, but a clear break of it is needed to strengthen a short-term bearish threat and allow for a deeper retracement. This would open $35.285, the Jun 24 low. For bulls, a resumption of gains would refocus attention on the next objective at $39.655 a Fibonacci projection.