MNI DAILY TECHNICAL ANALYSIS - Gold Bounces, Ends Correction
Price Signal Summary – Gold Bounce May Suggest Correction is Over
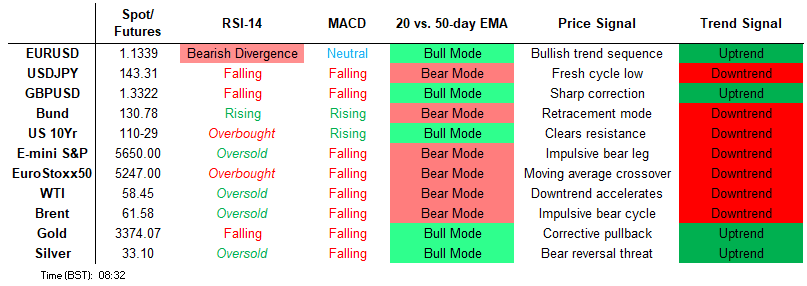
- The latest recovery in the e-mini S&P reinforces current bullish conditions.The contract has breached the 50-day EMA, at 5622.87. A continuation of the bull phase would expose 5837.25 next, the Mar 25 high and a bull trigger. Eurostoxx 50 futures maintain a positive tone and the contract is holding on to its latest gains. Price has recently cleared both the 20- and 50-day EMAs, and attention is on 5263.01, 76.4% of the Mar 3 - Apr 7 bear leg.
- The latest pullback in GBPUSD appears corrective. A tweezer top formation on the daily candle chart last Monday/Tuesday highlights a short-term top. Firm support at 1.3232, the 20-day EMA, remains intact. The trend direction in USDJPY remains bearish and gains since Apr 22 are considered corrective. Price remains below resistance at the 50-day EMA, at 146.49. A clear break of this average would highlight a possible reversal. AUDUSD traded higher Monday and a bullish theme remains intact. The recent breach of 0.6450, the Apr 29 high, marks the end of the recent pause in the bull cycle and confirms a resumption of the uptrend.
- Gold has recovered from its recent lows and this suggests the correction between Apr 22 - May 1, is over. A continuation higher would refocus attention on key resistance and the bull trigger at $3500.1, the Apr 22 high. A medium-term bearish trend in WTI futures remains intact and short-term gains are considered corrective. The move down that started Apr 23 signals the end of the correction between Apr 9 - 23.
- Bund futures continue to trade below their recent highs. Despite the latest move down, a bull cycle is in play and the sell-off between Apr 7 - 9 is considered corrective. A bull cycle in Gilt futures remains intact and short-term weakness is - for now - considered corrective. Today’s low print has resulted in a test of support at the 50-day EMA, at 92.46. A clear break of this average would signal scope for a deeper retracement.
FOREIGN EXCHANGE
EURUSD TECHS: Monitoring Support At The 20-Day EMA
- RES 4: 1.1696 1.618 proj of the Feb 28 - Mar 18 - 27 price swing
- RES 3: 1.1625 1.500 proj of the Feb 28 - Mar 18 - 27 price swing
- RES 2: 1.1608 High Nov 9 2021
- RES 1: 1.1440/1573 High Apr 23 / 21 and the bull trigger
- PRICE: 1.1324 @ 05:51 BST May 6
- SUP 1: 1.1269 20-day EMA and a key support
- SUP 2: 1.1144 High APr 3
- SUP 3: 1.1047 50-day EMA and a pivot level
- SUP 4: 1.0805 Low Apr 3
Recent weakness in EURUSD appears corrective. The trend structure remains bullish - moving average studies are in a bull-mode position signalling a dominant uptrend. The latest move down has also allowed an overbought condition to unwind. A resumption of gains would open 1.1608, the Nov 9 2021 high. Initial key support to watch is the 20-day EMA, at 1.1269. A break of this average would signal scope for a deeper pullback.
GBPUSD TECHS: Corrective Cycle
- RES 4: 1.3605 1.236 proj of the Feb 28 - Apr 3 - 7 price swing
- RES 3: 1.3550 High Feb 24 ‘22
- RES 2: 1.3510 1.236 proj of the Feb 28 - Apr 3 - 7 price swing
- RES 1: 1.3444 High Apr 28 / 29
- PRICE: 1.3302 @ 06:06 BST May 6
- SUP 1: 1.3257 Low May 5
- SUP 2: 1.3232 20-day EMA
- SUP 3: 1.3041/3045 Low Apr 14 / 50-day EMA
- SUP 4: 1.2968 Low Apr 11
The latest pullback in GBPUSD appears corrective. A tweezer top formation on the daily candle chart last Monday/Tuesday, highlights a short-term top. Firm support at 1.3232, the 20-day EMA, remains intact. A break of this level would signal scope for a deeper retracement. Note that moving average studies are in a bull-mode position, signalling a dominant underlying uptrend. A resumption of gains would open 1.3510, a Fibonacci projection.
EURGBP TECHS: Trading Closer To Its Recent Lows
- RES 4: 0.8781 2.236 proj of the Mar 3 - 11 - 28 price swing
- RES 3: 0.8768 High Nov 20 ‘23
- RES 2: 0.8624/0.8738 High Apr 21/ High Apr 11 and the bull trigger
- RES 1: 0.8557 High Apr 28
- PRICE: 0.8514 @ 06:13 BST May 6
- SUP 1: 0.8480 Low May 1
- SUP 2: 0.8477/67 61.8% of the Mar 28 - Apr 11 rally / 50-day EMA
- SUP 3: 0.8415 76.4% retracement of the Mar 28 - Apr 11 rally
- SUP 4: 0.8316 Low Mar 28 and a key support
EURGBP is trading closer to its recent lows and a short-term bear cycle remains in play, for now. The next support to watch is 0.8477, a Fibonacci retracement point where a break would strengthen a bearish theme. Support at the 50-day EMA, lies at 0.8467. It is still possible the move down that started Apr 11, is a correction. A clear reversal would open 0.8738, the Apr 11 high and bull trigger. First key resistance is 0.8624, the Apr 21 high.
USDJPY TECHS: Trend Needle Points South
- RES 4: 149.28 High Apr 3
- RES 3: 148.27 High Apr 9
- RES 2: 146.49 50-day EMA and key resistance
- RES 1: 145.92 High May 2
- PRICE: 143.79 @ 06:44 BST May 6
- SUP 1: 142.88/141.97 Low May 1 / Apr 29
- SUP 2: 139.79 1.382 proj of the Feb 12 - Mar 11 - 28 price swing
- SUP 3: 138.82 1.500 proj of the Feb 12 - Mar 11 - 28 price swing
- SUP 4: 138.07 Low Jul 28 ‘23
The trend direction in USDJPY remains bearish and gains since Apr 22 are considered corrective. Price remains below resistance at the 50-day EMA, at 146.49. A clear break of this average would highlight a possible reversal. Moving average studies remain in a bear-mode position highlighting a dominant downtrend. A resumption of the trend would open 139.79 next, a Fibonacci projection. First key support to watch is 141.97, the Apr 29 low.
EURJPY TECHS: Resistance Remains Exposed
- RES 4: 165.92 2.0% 10-dma envelope
- RES 3: 165.43 High Nov 8
- RES 2: 164.90 High Dec 30 ‘24 and a key medium-term resistance
- RES 1: 164.63 High Mar 18 and the bull trigger
- PRICE: 162.84 @ 07:15 GMT May 6
- SUP 1: 162.38 Intraday low
- SUP 2: 161.69 50-day EMA
- SUP 3: 160.99 Low Apr 22
- SUP 4: 159.48 Low Apr 9
A bullish theme in EURJPY remains intact despite the pullback from last Friday’s high. The recent print above key resistance at 164.19, the Mar 18 high, is a positive development for bulls. A clear break of this hurdle would confirm a resumption of the upleg that started Feb 28. This would open 164.90 next, the Dec 30 ‘24 high. First key support to watch is 161.69, the 50-day EMA. Clearance of this level would undermine the bull cycle.
AUDUSD TECHS: Bulls Remain In The Driver’s Seat
- RES 4: 0.5682 High Nov 12 ‘24
- RES 3: 0.6550 61.8% retracement of the Sep 30 ‘24 - Apr 9 bear leg
- RES 2: 0.6528 High Nov 29 ‘24
- RES 1: 0.6494 High May 05
- PRICE: 0.6456 @ 07:58 BST May 6
- SUP 1: 0.6366/6327 20- and 50-day EMA values
- SUP 2: 0.6275 Low Apr 14
- SUP 3: 0.6181 Low Apr 11
- SUP 4: 0.6116 Low Apr 10
AUDUSD traded higher Monday and a bullish theme remains intact. The recent breach of 0.6450, the Apr 29 high, marks the end of the recent pause in the bull cycle and confirms a resumption of the uptrend. Note that moving average studies are in a bull-mode position, highlighting an uptrend. Sights are on 0.6528, the Nov 29 ‘24 high. Initial key support to monitor is 0.6327, the 50-day EMA.
USDCAD TECHS: Southbound
- RES 4: 1.4415 High Apr 1
- RES 3: 1.4296 High Apr 7
- RES 2: 1.4066 50-day EMA
- RES 1: 1.3914 20-day EMA
- PRICE: 1.3821 @ 08:04 BST May 6
- SUP 1: 1.3760 Low May 2 and the bear trigger
- SUP 2: 1.3744 76.4% retracement of Sep 25 ‘24 - Feb 3 bull run
- SUP 3: 1.3696 Low Oct 10 2024
- SUP 4: 1.3643 Low Oct 9 ‘24
Bearish conditions in USDCAD remain intact. A fresh cycle low last Friday reinforces the bearish theme signalling scope for a continuation, near-term. Potential is seen for a move towards 1.3744, a Fibonacci retracement. Note that Moving average studies are in a bear mode position, highlighting a dominant downtrend. On the upside, first resistance to watch is 1.3914, the 20-day EMA.
FIXED INCOME
BUND TECHS: (M5) Pullback Considered Corrective
- RES 4: 133.90 1.236 proj of the Mar 25 - Apr 7- 9 price swing
- RES 3: 133.00 round number resistance
- RES 2: 132.56 High Feb 28 and a key resistance
- RES 1: 132.03 High Apr 7 and the bull trigger
- PRICE: 130.83 @ 05:28 BST May 6
- SUP 1: 130.52/129.92 50-day EMA / Low Apr 11
- SUP 2: 129.02 Low Apr 10
- SUP 3: 128.60 Low Apr 9 and a key support
- SUP 4: 128.47 Low Mar 28
Bund futures continue to trade below their recent highs. Despite the latest move down, a bull cycle is in play and the sell-off between Apr 7 - 9 is considered corrective. Sights are on resistance at 132.03, the Apr 7 high and a bull trigger. Clearance of this level would confirm a resumption of the uptrend and open 132.56, the Feb 28 high. Firm support lies at 128.60, the Apr 9 low. A break of this level would alter the picture.
BOBL TECHS: (M5) Pierces The 20-Day EMA
- RES 4: 120.20 High Dec 12 ‘24 (cont)
- RES 3: 120.000 Psychological round number
- RES 2: 119.960 High Apr 7 and the bull trigger
- RES 1: 119.780 High Apr 22
- PRICE: 119.150 @ 05:32 BST May 6
- SUP 1: 119.010 Low May 5
- SUP 2: 118.647 50-day EMA
- SUP 3: 118.060 Low Apr 10
- SUP 4: 117.680 Low Apr 9 and a key support
A bull cycle in Bobl futures remains in play and the recent steep sell-off between Apr 7 - 9 is considered corrective. Gains in early April rally resulted in a break of key resistance at 119.040, the Feb 28 high, strengthening bullish conditions. Sights are on the 120.000 handle next. On the downside, firm support lies at 117.680, the Apr 9 low. The 20-day EMA, an important S/T support, at 119.088, has been pierced. The 50-day EMA is at 118.647.
SCHATZ TECHS: (M5) MA Studies Highlight An Uptrend
- RES 4: 107.812 0.618 proj of the Mar 6 - Apr 7 - 9 price swing
- RES 3: 107.800 Round number resistance
- RES 2: 107.775 High Apr 7 and the bull trigger
- RES 1: 107.600/735 High Apr 30 / 22
- PRICE: 107.410 @ 06:12 BST May 6
- SUP 1: 107.370 Low Apr 17
- SUP 2: 107.252 38.2% retracement of the Mar 6 - Apr 7 bull cycle
- SUP 3: 107.125 Low Apr 10
- SUP 4: 106.965 Low Apr 9 and a key support
A bull cycle in Schatz futures remains in play and the latest pullback appears corrective. Attention is on resistance at 107.775, the Apr 7 high and bull trigger. Clearance of this level would confirm a resumption of the uptrend and open 107.812, a Fibonacci projection. Moving average studies remain in a bull-mode position, highlighting a dominant uptrend. Initial support to watch lies at 107.370, the Apr 17 low.
GILT TECHS: (M5) Tests Support At The 50-Day EMA
- RES 4: 94.75 76.4% of the Dec 3 ‘24 - Jan 13 bear leg (cont)
- RES 3: 94.50 High Apr 7 and key resistance
- RES 2: 94.00 Round number resistance
- RES 1: 92.88/93.93 Intraday high / High May 2
- PRICE: 92.70 @ 08:09 BST May 6
- SUP 1: 92.45 Intraday low
- SUP 2: 91.73/91.43 Low Apr 17 / 15
- SUP 3: 90.47/89.99 Low Apr 11 / 9
- SUP 4: 89.68 Low Jan 15 (cont)
A bull cycle in Gilt futures remains intact and short-term weakness is - for now - considered corrective. Today’s low print has resulted in a test of support at the 50-day EMA, at 92.46. A clear break of this average would signal scope for a deeper retracement and expose 91.73, the Apr 17 low. On the upside, a resumption of gains would open 94.50, the Apr 7 high and a key resistance. Initial firm resistance to monitor is 93.93, the May 2 high.
BTP TECHS: (M5) Trend Structure Remains Bullish
- RES 4: 121.93 76.4% of the Dec 5 ‘24 - Mar 14 bear leg (cont)
- RES 3: 121.43 1.618 proj of the Mar 14 - Apr 4 - 9 price swing
- RES 2: 121.00 High Feb 7 (cont) and a key resistance
- RES 1: 120.65 1.382 proj of the Mar 14 - Apr 4 - 9 price swing
- PRICE: 120.10@ Close May 5
- SUP 1: 119.60/119.33 Low Apr 23 / 20-day EMA
- SUP 2: 118.09 Low Apr 14
- SUP 3: 117.28 Low Apr 10
- SUP 4: 116.06 Low Apr 9
BTP futures remain in consolidation mode. A bull cycle is intact and the contract is holding on to the bulk of its latest gains. The recent break of a key resistance at 120.39, the Feb 28 high, reinforces a bullish theme. Sights are on 120.65 next, a Fibonacci projection. Firm support to watch lies at 119.33, the 20-day EMA. The contract is overbought, a pullback would unwind this trend condition.
EQUITIES
EUROSTOXX50 TECHS: (M5) Pierces Resistance
- RES 4: 5516.00 High Mar 3 and the key bull trigger
- RES 3: 5471.00 High Mar 19 / 20
- RES 2: 5341.00 High Mar 27
- RES 1: 5263.01/66.00 76.4% of Mar 3 - Apr 7 bear leg / High May 5
- PRICE: 5242.00 @ 06:20 BST May 6
- SUP 1: 5067.15 20-day EMA
- SUP 2: 4959.00/4812.00 Low Apr 23 / 16 and a key support
- SUP 3: 4664.00 Low Apr 10
- SUP 4: 4444.00 Low Apr 7 and the bear trigger
Eurostoxx 50 futures maintain a positive tone and the contract is holding on to its latest gains. Price has recently cleared both the 20- and 50-day EMAs, and attention is on 5263.01, 76.4% of the Mar 3 - Apr 7 bear leg. It has been pierced, a clear break of it would pave the way for a climb towards 5341.00, the Mar 27 high. Initial support to watch lies at 5067.15, the 20-day EMA. Clearance of this level would signal a possible reversal.
E-MINI S&P: (M5) Remains Above The 50-Day EMA
- RES 4: 5864.93 200-dma
- RES 3: 5837.25 High Mar 25 and a bull trigger
- RES 2: 5773.25 High Apr 2
- RES 1: 5724.75 High May 2
- PRICE: 5651.75 @ 07:22 BST May 6
- SUP 1: 5511.99 20-day EMA
- SUP 2: 5355.25/5127.25 Low Apr 24 / 21 and a key support
- SUP 3: 4996.43 76.4% retracement of the Apr 7 - 10 bounce
- SUP 4: 4832.00 Low Apr 7 and the bear trigger
The latest recovery in the e-mini S&P reinforces current bullish conditions.The contract has breached the 50-day EMA, at 5622.87. A continuation of the bull phase would expose 5837.25 next, the Mar 25 high and a bull trigger. It is still possible that the entire rally since Apr 7 is a correction. A reversal lower would signal the end of this corrective phase and expose initially, support at 5127.25, the Apr 21 low.
COMMODITIES
BRENT TECHS: (N5) Bearish Outlook
- RES 4: $78.10 - High Jan 15
- RES 3: $75.81 - High Feb 20
- RES 2: $74.63 - High Apr 2 and a bull trigger
- RES 1: $64.46/67.38 - 20- and 50-day EMA values
- PRICE: $59.43 @ 06:44 BST May 5
- SUP 1: $58.00 -Low April 9 and the bear trigger
- SUP 2: $56.29 - 2.236 proj of the Feb 20 - Mar 5 - Apr 2 price swing
- SUP 3: $55.10 - 2.382 proj of the Feb 20 - Mar 5 - Apr 2 price swing
- SUP 4: $54.00 - Round number support
A bearish theme in Brent futures remains intact and recent weakness reinforces current conditions. Last week’s price action confirms recent gains between Apr 9 - 23 as corrective that allowed an oversold condition to unwind. Sights are on $56.29 a Fibonacci projection. On the upside, key resistance to monitor is at the 50-day EMA, at $67.38. Initial resistance is at $64.46, the 20-day EMA.
WTI TECHS: (M5) Bear Threat Remains Present
- RES 4: $75.51 - High Jan 15 and a key resistance
- RES 3: $72.56 - High Feb 20
- RES 2: $71.76 - High Apr 2 and key resistance
- RES 1: $61.49/64.32 - 20- and 50-day EMA values
- PRICE: $58.20 @ 07:18 BST May 6
- SUP 1: $54.67 - Low April 9 and bear trigger
- SUP 2: $53.72 - 2.236 proj of the Feb 20 - Mar 5 - Apr 2 price swing
- SUP 3: $52.54 - 2.382 proj of the Jan 15 - Feb 4 - 11 price swing
- SUP 4: $50.00 - Psychological round number
A medium-term bearish trend in WTI futures remains intact and short-term gains are considered corrective. The move down that started Apr 23 signals the end of the correction between Apr 9 - 23. That cycle higher allowed an oversold condition to unwind. Attention is on $54.67, the Apr 9 low and a bear trigger. Clearance of this level would resume the downtrend and open $53.72, a Fibonacci projection. Resistance to watch is $64.32, the 50-day EMA.
GOLD TECHS: Recovers From Its Recent Lows
- RES 4: $3600.0 - Round number resistance
- RES 3: $3578.0 - 2.000 proj of the Dec 19 - Feb 24 - Feb 28 swing
- RES 2: $3547.9 - 1.764 proj of the Feb 28 - Apr 3 - Apr 7 price swing
- RES 1: $3387.1/3500.1 - Intraday high / High Apr 22 and bull trigger
- PRICE: $3366.2 @ 07:23 BST May 6
- SUP 1: $3252.1/3202.0 - 20-day EMA / Low May 1
- SUP 2: $3167.8 - High Apr 3 and a recent breakout level
- SUP 3: $3164.3 - 61.8% retracement Apr 7 - Apr 22 upleg
- SUP 4: $3115.1 - 50-day EMA
Gold has recovered from its recent lows and this suggests the correction between Apr 22 - May 1, is over. A continuation higher would refocus attention on key resistance and the bull trigger at $3500.1, the Apr 22 high. Clearance of this level would confirm a resumption of the primary uptrend. Key short-term support has been defined at $3202.0, the May 1 low. A break of this level is required to signal scope for a deeper retracement.
SILVER TECHS: Support Remains Intact
- RES 4: $36.000 - Round number resistance
- RES 3: $34.903 - High Oct 23 ‘24 and the bull trigger
- RES 2: $34.590 - High Mar 28
- RES 1: $33.686 - High Apr 25
- PRICE: $33.050 @ 08:10 BST May 6
- SUP 1: $31.668 - Low May 1
- SUP 2: $30.915/28.351 - Low Apr 11 / 7 and the bear trigger
- SUP 3: $27.686 - Low Sep 6 ‘24
- SUP 4: $27.180 - Low Aug 14 ‘24
A strong rally in Silver on Apr 23 reinforced the current bullish theme. This suggests the latest pullback that started Apr 25, is a correction. Key short-term support has been defined at $31.668, the May 1 low. A break of this level would signal scope for a deeper retracement and open $30.915, the Apr 11 low. For bulls, resistance to watch is $33.686, the Apr 24 high. Clearance of this level would confirm a resumption of the uptrend.