MNI DAILY TECHNICAL ANALYSIS - Gilts Remain Pressured
Price Signal Summary – Gilts Remain Pressured
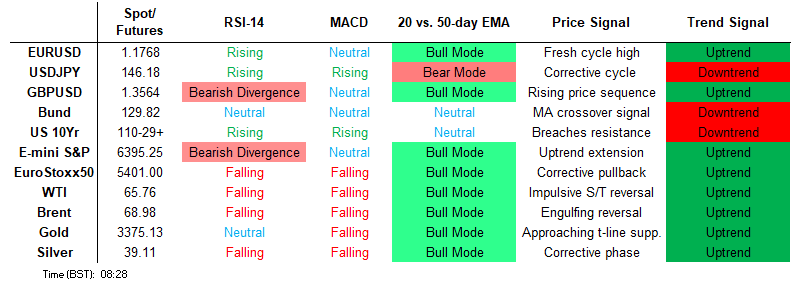
- S&P E-Minis have once again traded to a fresh cycle high this week. The climb confirms a resumption of the uptrend and maintains the price sequence of higher highs and higher lows. Note that moving average studies are in a bull-mode position highlighting a clear dominant uptrend. The trend condition in Eurostoxx 50 futures remains bullish and recent weakness appears to have been a correction. Support at 5281.00, the Jul 1 / 4 low, remains intact.
- EURUSD continues to appreciate and maintains a firmer tone having recovered from 1.1557, the Jul 17 low. Recent weakness between Jul 1 - 17 appears to have been a correction. Support to watch lies at the 50-day EMA , at 1.1543. The trend set-up in EURGBP is unchanged, it remains bullish and the cross continues to trade closer to its recent highs. A bullish price sequence of higher highs and higher lows is intact and note too that moving average studies are in a bull-mode position. AUDUSD remains firm and this week’s fresh cycle highs reinforce current bullish conditions. Gains have resulted in a print above key short-term resistance at 0.6595, the Jul 11 high and bull trigger.
- A bull cycle in Gold that started Jun 30 remains intact, and the latest pullback is - for now - considered corrective. Resistance at $3395.1, the Jun 23 high, has been cleared. A continuation higher would open $3451.3, the Jun 16 high. A bearish theme in WTI futures remains intact and the recovery since Jun 24 still appears corrective. The sharp reversal from the Jun 23 high continues to highlight scope for an extension lower.
- Bund futures traded in a volatile manner yesterday and the contract has pulled back from Tuesday’s high. This week’s early gains resulted in a move above the 50-day EMA, at 130.25. Gilt futures traded sharply higher on Tuesday, and for now the contract remains above its recent lows. Price has breached the 20-day EMA. A resumption of gains would signal scope for a climb towards 92.42 next, a Fibonacci retracement.
FOREIGN EXCHANGE
EURUSD TECHS: Maintains A Firmer Tone
- RES 4: 1.1923 2.000 proj of the Feb 28 - Mar 18 - 27 price swing
- RES 3: 1.1907 2.0% 10-dma envelope
- RES 2: 1.1851 High Sep 10 2021
- RES 1: 1.1790/1829 High Jul 7 / 01 and the bull trigger
- PRICE: 1.1775 @ 06:22 BST Jul 24
- SUP 1: 1.1671/1557 20-day EMA / Low Jul 17
- SUP 2: 1.1543 50-day EMA
- SUP 3: 1.1446 Low Jun 19
- SUP 4: 1.1405 Low Jun 11
EURUSD continues to appreciate and maintains a firmer tone having recovered from 1.1557, the Jul 17 low. Recent weakness between Jul 1 - 17 appears to have been a correction. Support to watch lies at the 50-day EMA , at 1.1543. A clear break of this average is required to signal a stronger reversal. Note that trend indicators continue to highlight a dominant uptrend. Sights are on 1.1829, the Jul 1 high and the bull trigger.
GBPUSD TECHS: Holding On To This Week’s Gains
- RES 4: 1.3789 High Jul 01 and the bull trigger
- RES 3: 1.3689 76.4% retracement of the Jul 1 - 16 bear leg
- RES 2: 1.3627 61.8% retracement of the Jul 1 - 16 bear leg
- RES 1: 1.3589 Intraday high
- PRICE: 1.3580 @ 06:35 BST Jul 24
- SUP 1: 1.3477/3365 50-day EMA / Low Jul 16 and a bear trigger
- SUP 2: 1.3335 Low May 20
- SUP 3: 1.3245 Low May 19
- SUP 4: 1.3144 38.2% retracement of the Jan 13 - Jul 1 bull cycle
GBPUSD is holding on to this week’s gains. The latest bounce highlights a possible false break of a trendline breached on Jul 15. The trendline is drawn from the Jan 13 low. Note that medium-term trend signals continue to highlight an uptrend - moving average studies are in a bull mode position. The next resistance to watch is 1.3627, a Fibonacci retracement. The bear trigger is 1.3365, Jul 16 low. A break would resume a bear theme.
EURGBP TECHS: Bullish Trend Set-Up
- RES 4: 0.8800 Round number resistance
- RES 3: 0.8781 2.236 pro of the Mar 3 - 11 - 28 price swing
- RES 2: 0.8738 High Apr 11 high and a key resistance
- RES 1: 0.8698 High Jul 16
- PRICE: 0.8671 @ 06:44 BST Jul 24
- SUP 1: 0.8630 20- day EMA
- SUP 2: 0.8597 Low Jul 7
- SUP 3: 0.8565 50-day EMA
- SUP 4: 0.8508 Low Jun 27
The trend set-up in EURGBP is unchanged, it remains bullish and the cross continues to trade closer to its recent highs. A bullish price sequence of higher highs and higher lows is intact and note too that moving average studies are in a bull-mode position, highlighting a dominant uptrend. A resumption of gains would open key resistance at 0.8738, the Apr 11 high. Support to watch is 0.8630, the 20-day EMA.
USDJPY TECHS: Testing Support At The 50-Day EMA
- RES 4: 151.21 High Mar 28
- RES 3: 150.49 High Apr 2
- RES 2: 149.38 50.0% retracement of the Jan 10 - Apr 22 bear leg
- RES 1: 147.95/149.18 High Jul 22 / 16 and the bull trigger
- PRICE: 146.01 @ 06:57 BST Jul 24
- SUP 1: 145.90/86 50-day EMA / Intraday low
- SUP 2: 145.16 61.8% retracement of the Jul 1 - 16 bull cycle
- SUP 3: 144.21 76.4% retracement of the Jul 1 - 16 bull cycle
- SUP 4: 143.63 Trendline support drawn from the Apr 22 low
A bull cycle in USDJPY remains in place, however, a corrective phase has resulted in a retracement from recent highs. Short-term pivot support to monitor is 145.90, the 50-day EMA. It has been pierced, a clear break of this average would highlight a stronger reversal and open 145.16, a Fibonacci retracement. For bulls, a breach of 149.18, the Jul 16 high, is required to resume the recent uptrend.
EURJPY TECHS: Bullish Trend Sequence Intact
- RES 4: 175.43 High Jul 11 ‘24 and a key medium-term resistance
- RES 3: 174.86 1.764 proj of the Feb 28 - Mar 18 - Apr 7 price swing
- RES 2: 173.43 High Jul 12 ‘24
- RES 1: 173.24 High Jul 15
- PRICE: 171.99 @ 07:10 BST Jul 24
- SUP 1: 171.11 20-day EMA
- SUP 2: 169.77 Low Jul 3
- SUP 3: 168.40 50-day EMA
- SUP 4: 167.46 Low Jun 23
EURJPY is in consolidation mode. The trend set-up remains bullish and recent fresh cycle highs reinforce this theme. A price sequence of higher highs and higher lows highlights a dominant uptrend and note that moving average studies are in a bull-mode position. Sights are on 173.43, the Jul 12 ‘24 high. Support to watch lies at 171.11, the 20-day EMA. A clear breach of this average would signal scope for a corrective pullback.
AUDUSD TECHS: Northbound
- RES 4: 0.6700 76.4% retracement of the Sep 30 ‘24 - Apr 9 bear leg
- RES 3: 0.6688 High Nov 7 ‘24
- RES 2: 0.6677 0.764 proj of the Jun 23 - Jul 11 - 17 price swing
- RES 1: 0.6625 Intraday high
- PRICE: 0.6611 @ 08:00 BST Jul 24
- SUP 1: 0.6536 20-day EMA
- SUP 2: 0.6498/6455 50-day EMA / Low Jul 17
- SUP 3: 0.6373 Low Jun 23 and a bear trigger
- SUP 4: 0.6357 Low May 12
AUDUSD remains firm and this week’s fresh cycle highs reinforce current bullish conditions. Gains have resulted in a print above key short-term resistance at 0.6595, the Jul 11 high and bull trigger. This resumes the uptrend and sights are on 0.6688, the Nov 7’ 24 high. Support to watch is around the 50-day EMA, at 0.6498. A clear break of this EMA would highlight a stronger reversal. Support at the 20-day EMA lies at 0.6536.
USDCAD TECHS: Sights Are On The Bear Trigger
- RES 4: 1.3920 High May 21
- RES 3: 1.3862 High May 29
- RES 2: 1.3798 High Jun 23
- RES 1: 1.3733/74 50-day EMA / High Jul 17
- PRICE: 1.3613 @ 08:05 BST Jul 24
- SUP 1: 1.3557 Low Jul 03
- SUP 2: 1.3540 Low Jun 16 and the bear trigger
- SUP 3: 1.3503 1.618 proj of the Feb 3 - 14 - Mar 4 price swing
- SUP 4: 1.3473 Low Oct 2 2024
The trend needle in USDCAD continues to point south and a move down this week reinforces the bearish theme. Resistance at 1.3733, the 50-day EMA, remains intact for now. A clear break of this average is required to highlight a possible stronger short-term reversal. For bears, sights are on key support at 1.3540, the Jun 16 low. Clearance of this level would confirm a resumption of the downtrend.
FIXED INCOME
BUND TECHS: (U5) Monitoring Support
- RES 4: 131.95 High Jun 13 and the bull trigger
- RES 3: 131.33 High Jun 20
- RES 2: 130.85 61.8% retracement of the Jun 13 - Jul 14 bear leg
- RES 1: 130.25/76 50-day EMA / High Jul 22
- PRICE: 129.87 @ 05:48 BST Jul 24
- SUP 1: 129.73/08 Low Jul 21 / 14 and a key support
- SUP 2: 128.97 Low May 14 and a reversal trigger
- SUP 3: 128.90 Low Apr 10
- SUP 4: 128.40 Low Apr 9
Bund futures traded in a volatile manner yesterday and the contract has pulled back from Tuesday’s high. This week’s early gains resulted in a move above the 50-day EMA, at 130.25. The clear break of the EMA undermines a recent bear theme and highlights a possible reversal. A resumption of gains would signal scope for a climb towards 130.85, a Fibonacci retracement. First support to watch is 129.73, the Jul 21 low. A break would be bearish.
BOBL TECHS: (U5) Remains Above Support For Now
- RES 4: 118.390 High Jun 13 and a key resistance
- RES 3: 118.109 76.4% retracement of the Jun 13 - Jul 11 bear leg
- RES 2: 118.060 High Jun 20 and a key near-term resistance
- RES 1: 117.830/118.030 Low Jul 22 / High Jul 22
- PRICE: 117.580 @ 05:59 BST Jul 24
- SUP 1: 117.530 Low Jul 23
- SUP 2: 117.450 Low Jul 18
- SUP 3: 117.200 Low Jul 11 and the bear trigger
- SUP 4: 117.000 Round number support
Bobl futures traded in a volatile manner yesterday and the contract has pulled back from its recent highs. Gains earlier this week strengthened a S/T bullish condition. Sights are on key near-term resistance at 118.060, the Jun 20 high. A break of this hurdle would be bullish and signal scope for an extension towards 118.390, the Jun 13 high. Initial firm support is seen at 117.450, the Jul 18 low. Clearance of this level would expose 117.200, the Jul 11 low.
SCHATZ TECHS: (U5) Trading Inside Its Range
- RES 4: 107.610 High May 23
- RES 3: 107.475 High May 27
- RES 2: 107.430 High Jun 13
- RES 1: 107.365 High Jun 7 and key short-term resistance
- PRICE: 107.220 @ 06:03 BST Jul 24
- SUP 1: 107.200/120 Low Jul 15 and 16 / Low Jul 11 and bear trigger
- SUP 2: 107.112 1.236 proj of the May 23 - 29 - 30 price swing
- SUP 3: 107.000 Round number support
- SUP 4: 106.890 2.000 proj of the May 23 - 29 - 30 price swing
Schatz futures have faced resistance at this week’s highs and the contract has pulled back, to remain inside its current range. Trend indicators continue to highlight a bear cycle and if correct, this suggests that short-term gains are corrective. Resistance to watch is 107.365, the Jun 7 high. A break would strengthen a bull theme. On the downside, a continuation lower would refocus attention on 107.120, the Jul 11 low and bear trigger.
GILT TECHS: (U5) Remains Above Key Support For Now
- RES 4: 93.00 Round number resistance
- RES 3: 92.74 61.8% retracement of the Jul 1 - 18 bear leg
- RES 2: 92.42 50.0% retracement of the Jul 1 - 18 bear leg
- RES 1: 91.96/92.15 20-day EMA / High Jul 22
- PRICE: 91.38 @ 08:02 BST Jul 24
- SUP 1: 91.29/91.08 Low Jul 21 / 18 and the bear trigger
- SUP 2: 90.97 76.4% retracement of the May 22 - Jul 1 bull leg
- SUP 3: 90.59 Low May 29
- SUP 4: 90.46 Low May 23
Gilt futures traded sharply higher on Tuesday, and for now the contract remains above its recent lows. Price has breached the 20-day EMA. A resumption of gains would signal scope for a climb towards 92.42 next, a Fibonacci retracement. On the downside, key support and the bear trigger has been defined at 91.08, the Jul 18 low. A break of this level would resume the bear cycle that started Jul 1.
BTP TECHS: (U5) Bull Trigger Remains Exposed
- RES 4: 122.71 2.764proj of the May 14 - 20 - 21 price swing
- RES 3: 122.35 2.500 proj of the May 14 - 20 - 21 price swing
- RES 2: 122.00 Round number resistance
- RES 1: 121.46/121.73 High Jul 22 / High Jun 13 and the bull trigger
- PRICE: 120.80 @ 07:08 BST Jul 24
- SUP 1: 120.72/119.84 20-day EMA / Low Jul 14 and key S/T support
- SUP 2: 119.48 Low May 26
- SUP 3: 118.87 Low May 21
- SUP 4: 118.51 Low May 14 and key support
The primary trend condition in BTP futures remains bullish and gains earlier this week reinforces this theme. Key short-term support has been defined at 119.84, the Jul 14 low. A break of this level is required to reinstate a short-term bearish threat. On the upside, resistance and the bull trigger to watch is 121.73, the Jun 13 high. Clearance of this level would resume the uptrend.
EQUITIES
EUROSTOXX50 TECHS: (U5) Trading Above Support
- RES 4: 5575.00 High Mar 3 and a major resistance (cont)
- RES 3: 5526.00 High Mar 19 / 20 (cont)
- RES 2: 5486.00/88.00 High May 20 and a bull trigger / High Jul 10
- RES 1: 5441.00 Intraday high
- PRICE: 5434.00 @ 06:32 BST Jul 24
- SUP 1: 5292.00 Low Jul 22
- SUP 2: 5281.00/5194.00 Low Jul 1 & 4 / Low Jun 23 and bear trigger
- SUP 3: 5138.00 High Apr 30
- SUP 4: 5078.00 Low Apr 30
The trend condition in Eurostoxx 50 futures remains bullish and recent weakness appears to have been a correction. Support at 5281.00, the Jul 1 / 4 low, remains intact. A clear break of this level would strengthen a bearish threat. Sights are on key resistance and bull trigger at 5486.00, the May 20 high. It has recently been pierced, a clear breach of it would resume the bull cycle and open 5500.00.
E-MINI S&P: (U5) Fresh Cycle High
- RES 4: 6500.00 Round number resistance
- RES 3: 6477.31 1.618 proj of the May 23 - Jun 11 - 23 price swing
- RES 2: 6439.88 1.500 proj of the May 23 - Jun 11 - 23 price swing
- RES 1: 6407.25 High Jul 23
- PRICE: 6401.25 @ 07:08 BST Jul 24
- SUP 1: 6318.75 Low Jul 22
- SUP 2: 6277.23/6131.47 20- and 50-day EMA values
- SUP 3: 6075.25 Low Jun 24
- SUP 4: 5959.00 Low Jun 23
S&P E-Minis have once again traded to a fresh cycle high this week. The climb confirms a resumption of the uptrend and maintains the price sequence of higher highs and higher lows. Note that moving average studies are in a bull-mode position highlighting a clear dominant uptrend. With the 6400.00 handle cleared, sights are on 6439.88, a Fibonacci projection. Key support is at the 50-day EMA, at 6131.47. Support at the 20-day EMA is at 6277.23.
COMMODITIES
BRENT TECHS: (U5) Bear Threat Remains Present
- RES 4: $85.00 - Round number resistance
- RES 3: $81.99 - 2.764 proj of the Apr 9 - 23 - May 5 price swing
- RES 2: $80.72 - 2.618 proj of the Apr 9 - 23 - May 5 price swing
- RES 1: $72.66/79.40 - 50.0% of the Jun 23-30 range / High Jun 23
- PRICE: $68.97 @ 07:10 BST Jul 24
- SUP 1: $65.92 - Low Jun 30
- SUP 2: $61.39 - Low May 30
- SUP 3: $58.00 - Low May 5
- SUP 4: $57.70 - Low Apr 9 and a key support
The technical set-up in Brent futures is unchanged. A bearish theme remains present and the July recovery appears corrective. The sell-off on Jun 23 continues to highlight a bearish threat. Recent weakness has resulted in a print below the 50-day EMA and note too that $66.17, 61.8% of the May 5 - Jun 23 bull leg, has been pierced. A resumption of the bear leg would expose $61.39, May 30 low. Initial resistance to watch is $72.66, a Fibonacci point.
WTI TECHS: (U5) Still Looking For Weakness
- RES 4: $81.12 - 3.000 proj of the Apr 9 - 23 - May 5 price swing
- RES 3: $80.00 - Psychological round number
- RES 2: $77.75 - 2.618 proj of the Apr 9 - 23 - May 5 price swing
- RES 1: $69.41/75.98 - 50.0% of the Jun 23-24 range / High Jun 23
- PRICE: $65.95 @ 07:20 BST Jul 24
- SUP 1: $64.70/62.84 - 50-day EMA / Low Jun 24
- SUP 2: $58.17 - Low May 30
- SUP 3: $54.66 - Low May 5
- SUP 4: $54.01 - Low Apr 9 and a key support
A bearish theme in WTI futures remains intact and the recovery since Jun 24 still appears corrective. The sharp reversal from the Jun 23 high continues to highlight scope for an extension lower. Support to watch is the 50-day EMA, at $64.70. The average has been pierced, a clear break of it would expose $58.17, the May 30 low. On the u[side, Initial resistance to monitor is $69.41, the 50.0% retracement of the Jun 23 - 24 high-low range.
GOLD TECHS: Corrective Pullback
- RES 4: $3547.9 - 1.764 proj of the Feb 28 - Apr 3 - Apr 7 price swing
- RES 3: $3500.1 - High Apr 22 and bull trigger
- RES 2: $3451.3 - High Jun 16
- RES 1: $3439.0 - High Jul 23
- PRICE: 3375.4 @ 07:27 BST Jul 24
- SUP 1: $3354.3 - 20-day EMA
- SUP 2: $3282.8/3248.7 - Low Jul 9 / Low Jun 30 and the bear trigger
- SUP 3: $3204.7 - Low May 20
- SUP 4: $3121.0 - Low May 15 and key support
A bull cycle in Gold that started Jun 30 remains intact, and the latest pullback is - for now - considered corrective. Resistance at $3395.1, the Jun 23 high, has been cleared. A continuation higher would open $3451.3, the Jun 16 high. Note that moving average studies are in a bull-mode position highlighting a dominant uptrend. The bear trigger is $3248.7, the Jun 30 low. An initial firm support to watch is 3282.8, the Jul 9 low.
SILVER TECHS: Bulls Remain In The Driver’s Seat
- RES 4: $41.064 - 1.764 proj of the Apr 7 - 25 - May 15 swing
- RES 3: $40.285 - 1.618 proj of the Apr 7 - 25 - May 15 swing
- RES 2: $40.000 - Psychological round number
- RES 1: $39.655 - 1.500 proj of the Apr 7 - 25 - May 15 swing
- PRICE: $39.095 @ 08:07 BST Jul 24
- SUP 1: $37.635 - 20-day EMA
- SUP 2: $36.197 - 50-day EMA
- SUP 3: $35.285 - Low Jun 24
- SUP 4: $33.967 - Low Jun 3
Trend signals in Silver are unchanged and continue to point north. This week’s gains reinforce bullish conditions - the metal has traded above resistance at $39.132, the Jul 14 high. The break confirms a resumption of the uptrend and maintains the price sequence of higher highs and higher lows. Sights are on $39.655 next, a Fibonacci projection. On the downside, initial support to watch lies at $37.635, the 20-day EMA.