MNI DAILY TECHNICAL ANALYSIS - Gilts Hold Budget Bounce
Price Signal Summary – Gilts Hold Budget Bounce
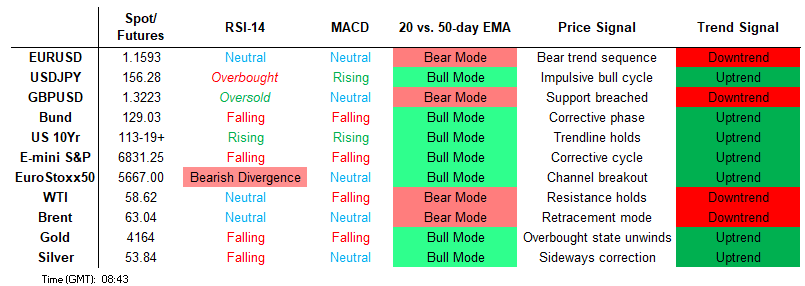
- S&P E-Minis are holding on to their latest gains following the recovery from the Nov 21 low. The climb has resulted in a breach of the 20- and 50- day EMAs. The move higher in EUROSTOXX 50 futures this week, undermines a recent bearish theme. The contract has traded above the 20- and 50-day EMAs and this signals scope for a stronger recovery near-term.
- The trend theme in GBPUSD is bearish and short-term gains are for now, considered corrective. However, the pair has breached the 20-day EMA and pierced the 50-day EMA, at 1.3261. The trend set-up in USDJPY is bullish and the latest shallow pullback appears corrective. The pair has recently entered overbought territory. A deeper retracement would allow this condition to unwind. A bearish theme in AUDUSD remains intact, however, the pair has traded through both the 20- and 50-day EMAs. This exposes a short-term trendline resistance at 0.6556, drawn from the Sep 17 high.
- The trend condition in Gold is unchanged; it remains bullish and the bear phase between Oct 20 and 28 appears to have been a correction. This allowed a recent overbought condition to unwind. The move down in Brent futures since Nov 11, highlights a bearish theme. A stronger resumption of weakness would expose key support and the bear trigger at $59.93, the Oct 20 low.
- Short-term gains in Bund futures appear corrective - for now. However, the contract has traded through the 50-day EMA, at 129.04, and is holding on to its latest gains. A clear break of the average would signal scope for a stronger recovery. A volatile spike higher in Gilt futures yesterday resulted in a breach of some important short-term resistance points. This strengthens a bullish theme and a continuation higher would signal scope for a climb towards resistance.
FOREIGN EXCHANGE
EURUSD TECHS: Resistance Remains Intact
- RES 4: 1.1728 High Oct 17
- RES 3: 1.1694 50.0% retracement of the Sep 17 - Nov 5 bear leg
- RES 2: 1.1656 High Nov 13 and key resistance
- RES 1: 1.1613 Intraday high
- PRICE: 1.1603 @ 06:15 GMT Nov 27
- SUP 1: 1.1491/1469 Low Nov 21 / 5 and the bear trigger
- SUP 2: 1.1425 1.500 proj of the Oct 17 - 22 - 28 price swing
- SUP 3: 1.1392 Low Aug 1 and bear trigger
- SUP 4: 1.1313 Low May 30
The trend structure in EURUSD remains bearish and this week’s recovery appears corrective - for now. The pair has breached both the 20- and 50-day EMAs. Key short-term resistance to monitor is 1.1656, the Nov 13 high and a bull trigger. Clearance of this level would highlight a reversal. For bears, a resumption of weakness would open key support at 1.1469, the Nov 5 low. Clearance of this level resumes the downtrend.
GBPUSD TECHS: Testing Resistance
- RES 4: 1.3416 High Oct 21
- RES 3: 1.3368 50.0% retracement of the Sep 17 - Nov 4 bear leg
- RES 2: 1.3284 38.2% retracement of the Sep 17 - Nov 4 bear leg
- RES 1: 1.3269 Intraday high
- PRICE: 1.3253 @ 06:30 GMT Nov 27
- SUP 1: 1.3125 Low Nov 26
- SUP 2: 1.3038/10 Low Nov 20 / Low Nov 4 & 5 and the bear trigger
- SUP 3: 1.2971 1.382 proj of the Sep 17 - 25 - Oct 1 price swing
- SUP 4: 1.2945 50.0% retracement of the Jan 13 - Jul 1 bull leg
The trend theme in GBPUSD is bearish and short-term gains are for now, considered corrective. However, the pair has breached the 20-day EMA and pierced the 50-day EMA, at 1.3261. A clear break of the 50-day average would highlight a stronger bull theme. Moving average studies are in a bear-mode condition, highlighting a dominant downtrend. 1.3010, the Nov 4 / 5 low, is the trigger for a resumption of the bear leg.
EURGBP TECHS: Corrective Pullback Extends
- RES 4: 0.8893 2.000 proj of the Sep 15 - 25 - Oct 8 price swing
- RES 3: 0.8875 High Apr 25
- RES 2: 0.8868 61.8% retracement of the 2022 - 2024 bear leg
- RES 1: 0.8818/65 High Nov 16 / 14
- PRICE: 0.8752 @ 06:45 GMT Nov 27
- SUP 1: 0.8746 Intraday low
- SUP 2: 0.8726 Low Oct 28
- SUP 3: 0.8706 76.4% retracement of the Oct 8 - Nov 14 bull leg
- SUP 4: 0.8656 Low Oct 8 and a key support
The trend set-up in EURGBP remains bullish and the latest pullback appears corrective - for now. Moving average studies are in a bull-mode position, highlighting a dominant uptrend. However, note that the cross has pierced the 50-day EMA, at 0.8751. A clear break of this average would signal scope for a deeper corrective pullback. For bulls, a resumption of gains would refocus attention on 0.8868, a Fibonacci retracement point.
USDJPY TECHS: Corrective Cycle
- RES 4: 158.87 High Jan 10 and a key resistance
- RES 3: 158.29 2.618 projection of the Sep 17 - 26 - Oct 1 price swing
- RES 2: 158.00 Round number resistance
- RES 1: 157.89 High Nov 20
- PRICE: 156.15 @ 07:06 GMT Nov 27
- SUP 1: 155.04 20-day EMA
- SUP 2: 153.62 Low Nov 14
- SUP 3: 152.80 50-day EMA
- SUP 4: 151.54 Low Oct 29
The trend set-up in USDJPY is bullish and the latest shallow pullback appears corrective. The pair has recently entered overbought territory. A deeper retracement would allow this condition to unwind. Support to watch is 155.04, the 20-day EMA. Moving average studies remain in a bull-mode position, highlighting a dominant uptrend. A resumption of the trend would open 158.00.
EURJPY TECHS: Trend Needle Points North
- RES 4: 184.34 2.000 proj of the Jul 31 - Sep 29 - Oct 2 price swing
- RES 3: 183.27 Bull channel top drawn from the Feb 28 low
- RES 2: 183.07 1.764 proj of the Jul 31 - Sep 29 - Oct 2 price swing
- RES 1: 182.01 High Nov 20 and the bull trigger
- PRICE: 181.01 @ 07:21 GMT Nov 27
- SUP 1: 179.77 Low Nov 21
- SUP 2: 179.40/177.29 20- and 50-day EMA values
- SUP 3: 175.71 Low Nov 5
- SUP 4: 175.14 Bull channel support drawn from the Feb 28 low
A bull cycle in EURJPY remains intact and the cross is holding on to the bulk of latest gains. Recent fresh cycle highs confirm a resumption of the trend and maintain the bullish price sequence of higher highs and higher lows. Sights are on 183.27, the top of a bull channel drawn from the Feb 28 low. First key support lies at 179.40, the 20-day EMA. A pullback would be considered corrective.
AUDUSD TECHS: Recovery Exposes Trendline Resistance
- RES 4: 0.6660 High Sep 18
- RES 3: 0.6640 76.4% retracement of the Sep 17 - Nov 21 bear leg
- RES 2: 0.6618 High Oct 29 and a key near-term resistance
- RES 1: 0.6556/6580 T-line drawn from the Sep 17 high / High Nov 13
- PRICE: 0.6532 @ 08:03 GMT Nov 27
- SUP 1: 0.6421 Low Nov 21
- SUP 2: 0.6415 Low Aug 21 / 22 and a bear trigger
- SUP 3: 0.6404 38.2% retracement of the Apr 9 - Sep 17 bull cycle
- SUP 4: 0.6373 Low Jun 23
A bearish theme in AUDUSD remains intact, however, the pair has traded through both the 20- and 50-day EMAs. This exposes a short-term trendline resistance at 0.6556, drawn from the Sep 17 high. A clear break of this line would highlight a stronger reversal. On the downside, a resumption of weakness would refocus attention on 0.6415, the Aug 21 / 22 low and the trigger for a stronger downleg.
USDCAD TECHS: Support Remains Exposed
- RES 4: 1.4200 Round number resistance
- RES 3: 1.4196 Channel top drawn from Jul 23 low
- RES 2: 1.4140/67 High Nov 5 / 50.0% of the Feb 3 - Jun 16 bear leg
- RES 1: 1.4131 High Nov 21
- PRICE: 1.4039 @ 08:14 GMT Nov 27
- SUP 1: 1.4029/3993 Intraday low / 50-day EMA
- SUP 2: 1.3920 Bull channel base drawn from the Jul 23 low
- SUP 3: 1.3888 Low Oct 29 and a key support
- SUP 4: 1.3833 Low Sep 24
The move lower in USDCAD yesterday once again highlights a short-term bear threat. Attention is on support at the 50-day EMA, at 1.3993. A clear breach of the average would strengthen a bear theme and expose the base of a bull channel at 1.3920. The channel is drawn from the Jul 23 low. On the upside, a resumption of gain would open 1.4140, the Nov 5 high and the next key resistance.
FIXED INCOME
BUND TECHS: (Z5) Breaches The 50-Day EMA
- RES 4: 130.07 High Oct 24
- RES 3: 129.74 61.8% retracement of the Oct 17 - Nov 20 bear leg
- RES 2: 129.40 High Nov 13
- RES 1: 129.21 High Nov 26
- PRICE: 129.12 @ 05:53 GMT Nov 27
- SUP 1: 128.72/37 Low Nov 24 / 20 and the short-term bear trigger
- SUP 2: 128.25 Low Oct 7
- SUP 3: 127.88 Low Sep 25 and key support
- SUP 4: 127.61 Low Sep 3 and a key M/T support
Short-term gains in Bund futures appear corrective - for now. However, the contract has traded through the 50-day EMA, at 129.04, and is holding on to its latest gains. A clear break of the average would signal scope for a stronger recovery and open 129.40, the Nov 13 high. Key short-term support and the bear trigger lies at 128.37, the Nov 20 low. Clearance of this level would instead resume the bear leg and open 128.25, the Oct 7 low.
BOBL TECHS: (Z5) Monitoring Resistance At The 50-Day EMA
- RES 4: 118.600 High Oct 24
- RES 3: 118.360 High Oct 28
- RES 2: 118.270 High Nov 5
- RES 1: 118.090/180 50-day EMA / High Nov 21
- PRICE: 118.080 @ 03:51 GMT Nov 27
- SUP 1: 117.790 Low Nov 20 and the bear trigger
- SUP 2: 117.710 Low Oct 6
- SUP 3: 117.630 Low Oct 1
- SUP 4: 117.470 Low Sep 15 and a key support
The short-term trend theme in Bobl futures remains bearish and short-term gains appear corrective - for now. Recent weakness resulted in a breach of 118.043, 61.8% of the Sep 25 - Oct 17 bull cycle. Note that 117.824, the 76.4% retracement, has been pierced. A resumption of the downleg would open 117.630, the Oct 1 low. Initial firm resistance is at 118.090, the 50-day EMA (pierced). A clear break of it is required to signal a potential reversal.
SCHATZ TECHS: (Z5) Bear Trend Intact
- RES 4: 107.175 High Oct 24
- RES 3: 107.095 High Oct 28 / 31
- RES 2: 107.055 50-day EMA
- RES 1: 107.017 20-day EMA
- PRICE: 106.995 @ 04:47 GMT Nov 27
- SUP 1: 106.945 Low Nov 17
- SUP 2: 106.920 Low Sep 25 and a key support
- SUP 3: 106.900 Round number support
- SUP 4: 106.830 Low Mar 27 (cont.)
The short-term trend condition in Schatz futures remains bearish and the latest bounce is considered corrective. Recent weakness paves the way for an extension towards 106.920, the Sep 25 low and a key support. Clearance of this level would strengthen a bear theme. Initial firm resistance to watch is at the 50-day EMA, at 107.055. A clear break of this average would highlight a potential reversal.
GILT TECHS: (H6) Rally Strengthens A Bull Theme
- RES 4: 92.55 High Nov 11
- RES 3: 92.31 High Nov 12
- RES 2: 92.00 Round number resistance
- RES 1: 91.93 Intraday high
- PRICE: 91.76 @ 08:11 GMT Nov 27
- SUP 1: 90.53 Low Nov 25
- SUP 2: 90.28 Low Nov 21
- SUP 3: 90.00 Round number support
- SUP 4: 89.86 Low Nov 19 and the bear trigger
A volatile spike higher in Gilt futures yesterday resulted in a breach of some important short-term resistance points. This strengthens a bullish theme and a continuation higher would signal scope for a climb towards resistance at 92.55, the Nov 11 high. A gap in the daily chart has been filled. A reversal lower would refocus attention on the first important support at 90.53, the Nov 26 low.
BTP TECHS: (Z5) Trend Structure Bullish
- RES 4: 123.14 1.764 proj of the Sep 3 - 11 - 25 price swing
- RES 3: 122.81 1.618 proj of the Sep 3 - 11 - 25 price swing
- RES 2: 122.53 1.500 proj of the Sep 3 - 11 - 25 price swing
- RES 1: 121.70/94 High Nov 13 / High Oct 17 / 22 and the bull trigger
- PRICE: 121.43 @ Close Nov 26
- SUP 1: 120.48 Low Nov 20 and key short-term support
- SUP 2: 120.15 50.0% retracement of the Sep 3 - Oct 17 bull leg
- SUP 3: 119.73 61.8% retracement of the Sep 3 - Oct 17 bull leg
- SUP 4: 119.07 Low Sep 25
The trend set-up in BTP futures is bullish and the latest pullback appears to have been a correction. A strong rally this week reinforces a bull theme. Note that the MA studies are in a bull-mode position, highlighting a dominant uptrend. A continuation higher would expose the bull trigger at 121.94, the Oct 17 and 22 high. Key short-term support has been defined at 120.48, the Nov 20 low. A clear breach of this level would resume the recent bear leg.
EQUITIES
EUROSTOXX50 TECHS: (Z5) Recovery Undermines A Recent Bear Theme
- RES 4: 5825.00 High Nov 13 and a key resistance
- RES 3: 5742.40 76.4% retracement of the Nov 13 - 21 bear leg
- RES 2: 5691.30 61.8% retracement of the Nov 13 - 21 bear leg
- RES 1: 5671.00 High Nov 26
- PRICE: 5653.00 @ 06:47 GMT Nov 27
- SUP 1: 5597.61/5475.00 50-day EMA / Low Nov 21 and bear trigger
- SUP 2: 5427.01 61.8% retracement of the Aug 1 - Nov 13 bull cycle
- SUP 3: 5383.00 Low Sep 18
- SUP 4: 5366.00 Low Sep 17
The move higher in EUROSTOXX 50 futures this week, undermines a recent bearish theme. The contract has traded above the 20- and 50-day EMAs and this signals scope for a stronger recovery near-term. A continuation would open 5691.30 and 5742.40, Fibonacci retracement points. For bears, a reversal lower would instead expose the key short-term support and bear trigger at 5475.00, the Nov 21 low.
E-MINI S&P: (Z5) Bullish Recovery
- RES 4: 6953.75 High Oct 30 and bull trigger
- RES 3: 6900.50 High Nov 12
- RES 2: 6852.56 76.4% retracement of the Oct 30 - Nov 21 bear leg
- RES 1: 6846.75 High Nov 26
- PRICE: 6828.50 @ 08:14 GMT Nov 27
- SUP 1: 6674.50/6525.00 Low Nov 25 / 21
- SUP 2: 6500.00 Round number support
- SUP 3: 6476.62 23.6% retracement of the Apr 7 - Oct 30 uptrend
- SUP 4: 6427.00 Low Sep 2
S&P E-Minis are holding on to their latest gains following the recovery from the Nov 21 low. The climb has resulted in a breach of the 20- and 50- day EMAs. This highlights a bullish development and the likely end of the corrective cycle between Oct 30 and Nov 21. A continuation higher would signal scope for a move towards the key resistance and bull trigger at 6953.75, the Oct 30 high. Key support lies at 6525.00, the Nov 21 low.
COMMODITIES
BRENT TECHS: (G6) Bearish Theme
- RES 4: $70.86 - 76.4% retracement of the Jun 23 - Oct 17 bear leg
- RES 3: $70.33 - High Jul 30
- RES 2: $68.86 - High Sep 26 and a key resistance
- RES 1: $65.25 - High Oct 24
- PRICE: $62.43 @ 07:19 GMT Nov 27
- SUP 1: $59.93 - Low Nov 20 and the bear trigger
- SUP 2: $58.92 - Low May 5
- SUP 3: $58.11 - Low Apr 9 and a key support
- SUP 4: $56.22 - 2.00 proj of the Jul 30 - Aug 13 - Sep 26 price swing
The move down in Brent futures since Nov 11, highlights a bearish theme. A stronger resumption of weakness would expose key support and the bear trigger at $59.93, the Oct 20 low. Clearance of this level would confirm a continuation of the bear cycle. Note, it is still possible that a bullish corrective cycle is in play. A move above resistance at $65.25, the Oct 24 high, would signal scope for a stronger recovery near-term.
WTI TECHS: (F6) Trading Below Resistance
- RES 4: $71.38 - High Jun 23 and a key medium-term resistance
- RES 3: $67.16 - High Jul 30
- RES 2: $65.33 - High Sep 26 and key resistance
- RES 1: $61.84 - High Oct 24
- PRICE: $58.59 @ 07:20 GMT Nov 27
- SUP 1: $55.99 - Low Oct 20 and bear trigger
- SUP 2: $55.33 - Low May 1
- SUP 3: $54.72 - Low Apr 9 and a key support
- SUP 4: $53.53 - 1.764 proj of the Jul 30 - Aug 13 - Sep 26 price swing
Recent weakness in WTI futures highlights a bearish theme. A stronger resumption of the bear leg would pave the way for a move towards key support and the bear trigger at $55.99, the Oct 20 low. Clearance of this level would resume the downtrend. Note that it is still possible a bullish corrective cycle remains in play. Resistance to watch is $61.84, the Oct 24 high. A clear break of this hurdle would signal scope for a stronger correction.
GOLD TECHS: Bullish Trend Structure
- RES 4: $4404.9 - 3.500 proj of the May 15 - Jun 16 - 30 price swing
- RES 3: $4381.5 - High Oct 20 and bull trigger
- RES 2: $4264.7 - 76.4% retracement of the Oct 20 - 28 correction
- RES 1: $4245.2 - High Nov 13
- PRICE: $4158.7 @ 07:34 GMT Nov 27
- SUP 1: $3974.4 - 50-day EMA
- SUP 2: $3886.6 - Low Oct 28 and a reversal trigger
- SUP 3: $3800.00 Round number support
- SUP 4: $3760.9 - Low Sep 29
The trend condition in Gold is unchanged, it remains bullish and the bear phase between Oct 20 and 28 appears to have been a correction. This allowed a recent overbought condition to unwind. Key support to watch lies at the 50-day EMA, at $3974.4. Clearance of this EMA would signal scope for a deeper retracement. The first short-term bull trigger has been defined at $4245.23, the Nov 13 high.
SILVER TECHS: Approaching The Bull Trigger
- RES 4: $56.153 2.500 proj of the Aug 20 - Sep 16 - 17 price swing
- RES 3: $55.444 2.382 proj of the Aug 20 - Sep 16 - 17 price swing
- RES 2: $55.000 Round number resistance
- RES 1: $54.480 - High Oct 17 and the bull trigger
- PRICE: $53.835 @ 08:29 GMT Nov 27
- SUP 1: $50.545 - 20-day EMA
- SUP 2: $48.353/45.557 - 50-day EMA / Low Oct 28
- SUP 3: $41.135 - Low Sep 17
- SUP 4: $38.087 - Low Aug 27
Trend signals in Silver remain bullish. Support to watch lies at the 50-day EMA, at $48.353. A clear breach of this average would signal scope for a deeper retracement. On the upside, attention is on key resistance and the bull trigger at $54.480, the Oct 17 high. Clearance of this level would confirm a resumption of the primary uptrend and open $55.444, a Fibonacci projection.