MNI DAILY TECHNICAL ANALYSIS - EURGBP Trades a New Cycle Low
Price Signal Summary – EURGBP Trades a New Pullback Low
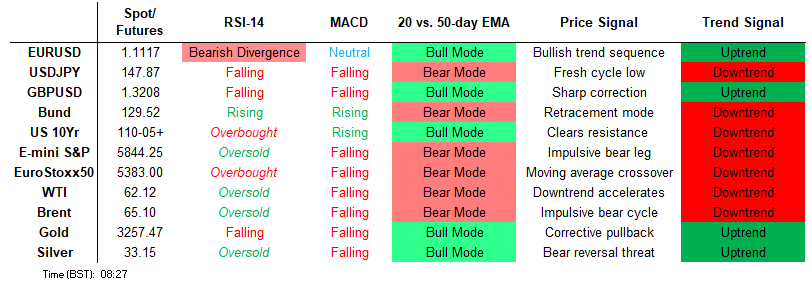
- A bullish trend condition in S&P E-Minis remains intact and Monday’s strong gains reinforce bullish conditions. The contract has pierced an important resistance at 5837.25, the Mar 25 high and a bull trigger. Strong gains in the Eurostoxx 50 futures contract on Monday reinforce current bullish conditions. The contract is extending the recent breach of 5263.01, 76.4% of the Mar 3 - Apr 7 bear leg.
- EURUSD maintains a softer tone and the pair traded sharply lower Monday. Recent weakness appears corrective and key trend signals remain bullish. However, the pair has breached the 20-day EMA and pierced 1.1082. EURGBP traded to a fresh, short-term cycle low Monday. This strengthens the current bearish theme. Note too that the cross has cleared support at 0.8468, the 50-day EMA, signalling scope for a continuation lower. AUDUSD continues to trade below the May 7 high. The trend condition is bullish and the latest move down is considered corrective. The recent breach of 0.6450, the Apr 29 high, confirmed a resumption of the uptrend.
- The latest pullback in Gold appears corrective. Key short-term support to watch is $3202.0, the May 1 low. A clear break of this level would undermine the short-term bullish theme and signal scope for a deeper retracement. A downtrend in WTI futures remains intact and short-term gains are considered corrective. For now, the corrective cycle remains in play and price has traded through the 20-day EMA.
- For now, the latest move down in Bund futures is considered corrective. This correction remains intact and the contract has traded through support at the 50-day EMA, at 130.57. The latest pullback in Gilt futures appears corrective. However, the contract has traded through support at the 50-day EMA, at 92.49. The breach signals scope for a deeper retracement and yesterday’s move down resulted in a print below 91.73.
FOREIGN EXCHANGE
EURUSD TECHS: Pierces The 50-Day EMA
- RES 4: 1.1625 1.500 proj of the Feb 28 - Mar 18 - 27 price swing
- RES 3: 1.1608 High Nov 9 2021
- RES 2: 1.1440/1573 High Apr 23 / 21 and the bull trigger
- RES 1: 1.1256/1381 20-day EMA / High May 2 - 6
- PRICE: 1.1110 @ 05:55 BST May 13
- SUP 1: 1.1082/65 50-day EMA and a pivot level / Low May 12
- SUP 2: 1.1026 38.2% retracement of the Feb 3 - Apr 21 bull cycle
- SUP 3: 1.0943 Low Apr 10
- SUP 4: 1.0857 50.0% retracement of the Feb 3 - Apr 21 bull cycle
EURUSD maintains a softer tone and the pair traded sharply lower Monday. Recent weakness appears corrective and key trend signals remain bullish. However, the pair has breached the 20-day EMA and pierced 1.1082, the 50-day EMA. A clean break of the average would strengthen a bear threat. A key resistance to watch is 1.1381, the May 2 - 6 high. Clearance of this level would signal the end of the correction.
GBPUSD TECHS: Monitoring Support At The 50-Day EMA
- RES 4: 1.3550 High Feb 24 ‘22
- RES 3: 1.3510 1.236 proj of the Feb 28 - Apr 3 - 7 price swing
- RES 2: 1.3402/3444 High May 6 / High Apr 28 / 29 and the bull trigger
- RES 1: 1.3323 High May 9
- PRICE: 1.3198 @ 06:06 BST May 13
- SUP 1: 1.3140 Low May 12
- SUP 2: 1.3087 50-day EMA
- SUP 3: 1.3041 Low Apr 14
- SUP 4: 1.2968 Low Apr 11
GBPUSD traded lower Monday as the pair extended the correction that started Apr 29. The 20-day EMA has been breached. Furthermore, a minor head and shoulders formation on the daily chart highlights a reversal and reinforces the likelihood of a corrective pullback near-term. Key support to watch is 1.3087, the 50-day EMA. The bull trigger is unchanged at 1.3444, the Apr 28 / 29 high. A break of this level would resume the uptrend.
EURGBP TECHS: Maintains A Bearish Tone
- RES 4: 0.8768 High Nov 20 ‘23
- RES 3: 0.8624/0.8738 High Apr 21/ High Apr 11 and the bull trigger
- RES 2: 0.8541/8557 High May 2 / High Apr 28
- RES 1: 0.8468 50-day EMA
- PRICE: 0.8419 @ 06:37 BST May 13
- SUP 1: 0.8405 Low May 12
- SUP 2: 0.8400 Round number support
- SUP 3: 0.8359 1.236 proj of the Apr 11 - 16 - 21 price swing
- SUP 4: 0.8316 Low Mar 28 and a key support
EURGBP traded to a fresh, short-term cycle low Monday. This strengthens the current bearish theme. Note too that the cross has cleared support at 0.8468, the 50-day EMA, signalling scope for a continuation lower. Sights are on 0.8415 next, a Fibonacci retracement. This level has been pierced, a clear break of it would open 0.8400 and below. Key near-term resistance is 0.8541, the May 2 high. A break of this level is required to signal a potential reversal.
USDJPY TECHS: Impulsive Rally Intact
- RES 4: 151.21 High Mar 28 and a key resistance
- RES 3: 150.49 High Apr 2
- RES 2: 149.28 High Apr 3
- RES 1: 148.54/65 76.4% of Mar 28 - Apr 22 bear leg / High May 12
- PRICE: 147.73@ 06:56 BST May 13
- SUP 1: 146.28/144.66 50- and 20-day EMA
- SUP 2: 142.36 Low May 6
- SUP 3: 141.97 Low Apr 29
- SUP 4: 139.89 Low Apr 22 and a bear trigger
The primary trend condition in USDJPY is bearish and gains since Apr 22 appear corrective. This corrective cycle remains in play, for now. Resistance at the 50-day EMA, at 146.28, has been cleared, strengthening a bullish theme. The move high has exposed 148.54, a Fibonacci retracement (pierced). On the downside, a reversal lower would refocus attention on 142.36, May 6 low. A break of it would signal the end of the correction.
EURJPY TECHS: Bull Cycle Remains Intact
- RES 4: 167.40 61.8% retracement of the Jul 11 - Aug ‘24 sell-off
- RES 3: 166.69 High Oct 31 2024 and a key resistance
- RES 2: 166.14 2.0% 10-dma envelope
- RES 1: 164.92/65.43 High May 12 / High Nov 8 2024
- PRICE: 164.28 @ 07:36 GMT May 13
- SUP 1: 162.80 20-day EMA
- SUP 2: 161.99/60 50-day EMA / Low May 6
- SUP 3: 160.99 Low Apr 22
- SUP 4: 159.48 Low Apr 9
A bullish theme in EURJPY remains intact. Monday’s gains reinforce this condition and the rally resulted in a move above the 164.63, the Mar 18 high. A clear break of this hurdle would confirm a resumption of the uptrend and pave the way for a climb towards 165.43, the Nov 8 ‘24 high. Moving average studies are in a bull mode position, highlighting a dominant uptrend. Support to watch is 161.99, the 50-day EMA.
AUDUSD TECHS: Trend Conditions Remain Bullish
- RES 4: 0.5682 High Nov 12 ‘24
- RES 3: 0.6550 61.8% retracement of the Sep 30 ‘24 - Apr 9 bear leg
- RES 2: 0.6528 High Nov 29 ‘24
- RES 1: 0.6515 High May 7
- PRICE: 0.6416 @ 07:58 BST May 13
- SUP 1: 0.6371/6339 Intraday low / 50-day EMA
- SUP 2: 0.6275 Low Apr 14
- SUP 3: 0.6181 Low Apr 11
- SUP 4: 0.6116 Low Apr 10
AUDUSD continues to trade below the May 7 high. The trend condition is bullish and the latest move down is considered corrective. The recent breach of 0.6450, the Apr 29 high, confirmed a resumption of the uptrend. Note that moving average studies remain in a bull-mode position, highlighting an uptrend. A resumption of the trend would open 0.6528, the Nov 29 ‘24 high. Key support to monitor is 0.6344, the 50-day EMA.
USDCAD TECHS: Short-Term Bounce Extends
- RES 4: 1.4296 High Apr 7
- RES 3: 1.4111 High Apr 4
- RES 2: 1.4035 50-day EMA
- RES 1: 1.4016 High May 12
- PRICE: 1.3973 @ 08:07 BST May 13
- SUP 1: 1.3814/3751 Low May 8 / 6 and the bear trigger
- SUP 2: 1.3744 76.4% retracement of Sep 25 ‘24 - Feb 3 bull run
- SUP 3: 1.3696 Low Oct 10 2024
- SUP 4: 1.3643 Low Oct 9 ‘24
USDCAD continues to trade above its recent lows. Despite the latest gains, the trend condition remains bearish and the move higher is considered corrective. A fresh cycle low last week reinforces the bearish theme. Potential is seen for a move towards 1.3744, a Fibonacci retracement. Note that moving average studies are in a bear mode position, highlighting a dominant downtrend. Key resistance is seen at 1.4035, the 50-day EMA.
FIXED INCOME
BUND TECHS: (M5) Bear Cycle Extends
- RES 4: 133.00 round number resistance
- RES 3: 132.56 High Feb 28 and a key resistance
- RES 2: 131.72/132.03 High May 7 / High Apr 7 and the bull trigger
- RES 1: 130.57/85 50- and 20-day EMA values
- PRICE: 129.60 @ 05:31 BST May 13
- SUP 1: 129.59 Low May 12
- SUP 2: 129.28 50.0% retracement of the Mar 11 - Apr 7 rally
- SUP 3: 129.02 Low Apr 10
- SUP 4: 128.60 Low Apr 9 and a key support
For now, the latest move down in Bund futures is considered corrective. This correction remains intact and the contract has traded through support at the 50-day EMA, at 130.57. This signals scope for a deeper retracement and Monday’s extension strengthens the current bearish threat. A continuation lower would open 129.28, a Fibonacci retracement. Initial resistance to watch is 130.85, the 20-day EMA.
BOBL TECHS: (M5) Short-Term Bear Cycle
- RES 4: 120.20 High Dec 12 ‘24 (cont)
- RES 3: 119.960 High Apr 7 and the bull trigger
- RES 2: 119.600/780 High May 7 / High Apr 22
- RES 1: 118.722/119.068 50- and 20-day EMA values
- PRICE: 118.260 @ 05:44 BST May 13
- SUP 1: 118.240 Intraday low
- SUP 2: 118.105 50.0% retracement of the Mar 6 - Apr 7 bull run
- SUP 3: 117.680 Low Apr 9 and a key support
- SUP 4: 117.600 Low Mar 28
A bull cycle in Bobl futures remains intact, however, for now a strong bearish corrective phase is in play and Monday’s sell-off strengthens a near-term bearish theme. The contract has traded through the 50-day EMA and cleared 118.543, 38.2% of the Mar 6 - Apr 7 bull run. This exposes 118.105, the 50.0% retracement. Initial resistance to watch is 119.068, the 20-day EMA. A break would signal a potential reversal.
SCHATZ TECHS: (M5) Approaching A Key Support
- RES 4: 107.812 0.618 proj of the Mar 6 - Apr 7 - 9 price swing
- RES 3: 107.775 High Apr 7 and the bull trigger
- RES 2: 107.600/735 High Apr 30 / 22
- RES 1: 107.242/393 50- and 20-day EMA values
- PRICE: 107.075 @ 06:12 BST May 13
- SUP 1: 107.070 Intraday low
- SUP 2: 106.965 Low Apr 9 and a key support
- SUP 3: 106.928 61.8% retracement of the Mar 6 - Apr 7 bull cycle
- SUP 4: 106.830 Low Mar 27
The trend condition in Schatz futures remains bullish, however, a sharp sell-off on Monday strengthens a short-term bearish theme and signals scope for a deeper corrective retracement. The contract has breached 107.090, 50.0% of the rally between Mar 6 - Apr 7. This exposes the next key support at 106.965, the Apr 9 low. Initial firm resistance to watch is 107.393, the 50-day EMA.
GILT TECHS: (M5) Short-Term Bear Threat Still Present
- RES 4: 94.50 High Apr 7 and key resistance
- RES 3: 94.00 Round number resistance
- RES 2: 93.59/93 High May 8 / 2
- RES 1: 92.07/92.67 Low May 9 / 20-day EMA
- PRICE: 91.81 @ Close May 12
- SUP 1: 91.63 Low May 12
- SUP 2: 91.43 Low Apr 15
- SUP 3: 90.92 76.4% retracement of the Apr 9 - May 2 rally
- SUP 4: 90.47 Low Apr 11
The latest pullback in Gilt futures appears corrective. However, the contract has traded through support at the 50-day EMA, at 92.49. The breach signals scope for a deeper retracement and yesterday’s move down resulted in a print below 91.73, the Apr 17 low. An extension of the bear leg would expose 91.43, the Apr 15 low. Initial firm resistance is seen at 92.67, the 20-day EMA. A break of this hurdle would ease bearish pressure.
BTP TECHS: (M5) Corrective Cycle
- RES 4: 121.93 76.4% of the Dec 5 ‘24 - Mar 14 bear leg (cont)
- RES 3: 121.43 1.618 proj of the Mar 14 - Apr 4 - 9 price swing
- RES 2: 121.00 High Feb 7 (cont) and a key resistance
- RES 1: 120.21/72 High May 9 / 8 and the bull trigger
- PRICE: 119.45 @ Close May 12
- SUP 1: 119.05 50-day EMA
- SUP 2: 118.09 Low Apr 14
- SUP 3: 117.28 Low Apr 10
- SUP 4: 116.06 Low Apr 9
A bull cycle in BTP futures remains intact and last week’s fresh short-term cycle high reinforces current conditions. However, near-term, a corrective cycle signals potential for a pullback. The contract has breached the 20-day EMA, at 119.62 , exposing a firmer support at 119.05, the 50-day EMA. A clear break of the average would signal scope for a deeper retracement. Key resistance and the bull trigger has been defined at 120.72, the May 8 high.
EQUITIES
EUROSTOXX50 TECHS: (M5) Bullish Condition Intact
- RES 4: 5565.23 1.618 proj of the Apr 7 - 9 - 10 price swing
- RES 3: 5516.00 High Mar 3 and the key bull trigger
- RES 2: 5471.00 High Mar 19 / 20
- RES 1: 5409.00/5440.00 Monday’s peak / High Mar 25 and 26
- PRICE: 5360.00 @ 06:27 BST May 13
- SUP 1: 5142.89 50-day EMA
- SUP 2: 5055.00 Low Apr 30
- SUP 3: 4959.00/4812.00 Low Apr 23 / 16 and a key support
- SUP 4: 4664.00 Low Apr 10
Strong gains in the Eurostoxx 50 futures contract on Monday reinforce current bullish conditions. The contract is extending the recent breach of 5263.01, 76.4% of the Mar 3 - Apr 7 bear leg. The continuation higher signals scope for a climb towards 5516.00, the Mar 3 high and the key bull trigger. Initial firm support to watch lies at 5142.89, the 20-day EMA. Clearance of this level would signal a possible reversal.
E-MINI S&P: (M5) Northbound
- RES 4: 6000.00 Round number resistance
- RES 3: 5938.25 High Mar 4
- RES 2: 5896.25 76.4% retracement of the Feb 19 - Apr 7 bear leg
- RES 1: 5876.25 High May 12
- PRICE: 5848.00 @ 07:22 BST May 13
- SUP 1: 5637.98/ 5599.73 50- and 20-day EMA values
- SUP 2: 5455.50 Low Apr 30
- SUP 3: 5355.25 Low Apr 24
- SUP 4: 5127.25 Low Apr 21 and a key support
A bullish trend condition in S&P E-Minis remains intact and Monday’s strong gains reinforce bullish conditions. The contract has pierced an important resistance at 5837.25, the Mar 25 high and a bull trigger. This strengthens the bullish theme, paving the way for a continuation near-term. Sights are on 5896.25, a Fibonacci retracement. Initial firm support to watch lies at 5637.98, the 50-day EMA.
COMMODITIES
BRENT TECHS: (N5) Resistance Remains Intact
- RES 4: $78.10 - High Jan 15
- RES 3: $75.81 - High Feb 20
- RES 2: $74.63 - High Apr 2 and a bull trigger
- RES 1: $66.59 - 50-day EMA
- PRICE: $64.87 @ 06:59 BST May 13
- SUP 1: $58.00 - Low April 9 and the bear trigger
- SUP 2: $56.29 - 2.236 proj of the Feb 20 - Mar 5 - Apr 2 price swing
- SUP 3: $55.10 - 2.382 proj of the Feb 20 - Mar 5 - Apr 2 price swing
- SUP 4: $54.00 - Round number support
The trend condition in Brent futures remains bearish and recent gains are considered corrective - for now. The corrective cycle remains in play and the contract is trading closer to its latest highs. Key resistance to watch is $66.59, the 50-day EMA. A clear break of this level would highlight a stronger reversal. On the downside, a move lower would refocus attention key support at $58.00, Apr 9 low. A breach of this support would resume the downtrend.
WTI TECHS: (M5) Monitoring Resistance
- RES 4: $75.51 - High Jan 15 and a key resistance
- RES 3: $72.56 - High Feb 20
- RES 2: $66.41/71.76 - High Apr 4 / 2 and key resistance
- RES 1: $63.55 - 50-day EMA
- PRICE: $61.73 @ 07:16 BST May 13
- SUP 1: $54.67 - Low April 9 and the bear trigger
- SUP 2: $53.72 - 2.236 proj of the Feb 20 - Mar 5 - Apr 2 price swing
- SUP 3: $52.54 - 2.382 proj of the Jan 15 - Feb 4 - 11 price swing
- SUP 4: $50.00 - Psychological round number
A downtrend in WTI futures remains intact and short-term gains are considered corrective. For now, the corrective cycle remains in play and price has traded through the 20-day EMA. Key resistance to watch is $63.55, the 50-day EMA, a clear break of this level would highlight a stronger reversal. This would open $66.41, the Apr 4 high. For bears a reversal lower would refocus attention on $54.67, the Apr 9 low and bear trigger.
GOLD TECHS: Approaching A Key Support
- RES 4: $3578.0 - 2.000 proj of the Dec 19 - Feb 24 - Feb 28 swing
- RES 3: $3547.9 - 1.764 proj of the Feb 28 - Apr 3 - Apr 7 price swing
- RES 2: $3435.6/3500.1 - High May 7 / High Apr 22 and bull trigger
- RES 1: $3347.5 - High May 9
- PRICE: $3253.3 @ 07:22 BST May 13
- SUP 1: $3202.0 - Low May 1 and a key support
- SUP 2: $3164.3 - 61.8% retracement Apr 7 - Apr 22 upleg
- SUP 3: $3161.0 - 50-day EMA
- SUP 4: $2956.7 - Low Apr 7
The latest pullback in Gold appears corrective. Key short-term support to watch is $3202.0, the May 1 low. A clear break of this level would undermine the short-term bullish theme and signal scope for a deeper retracement. This would open $3164.3, 61.8% of the Apr 7 - Apr 22 upleg. Note that the 50-day EMA is at $3161.0. The medium-term trend condition remains bullish, a reversal would refocus attention on $3500.1, the Apr 22 high and bull trigger.
SILVER TECHS: Trend Needle Points North
- RES 4: $36.000 - Round number resistance
- RES 3: $34.903 - High Oct 23 ‘24 and the bull trigger
- RES 2: $34.590 - High Mar 28
- RES 1: $33.686 - High Apr 25
- PRICE: $33.147 @ 08:10 BST May 13
- SUP 1: $31.668 - Low May 1
- SUP 2: $30.915/28.351 - Low Apr 11 / 7 and the bear trigger
- SUP 3: $27.686 - Low Sep 6 ‘24
- SUP 4: $27.180 - Low Aug 14 ‘24
A bullish theme in Silver remains intact and the latest pullback that started Apr 25, is likely a correction. Key short-term support has been defined at $31.668, the May 1 low. A break of this level would signal scope for a deeper retracement and open $30.915, the Apr 11 low. For bulls, resistance to watch is $33.686, the Apr 25 high. Clearance of this level would confirm a resumption of the uptrend.