MNI DAILY TECHNICAL ANALYSIS - EStoxx50 Breaches Key Supports
Price Signal Summary - EStoxx50 Breaches Key Supports
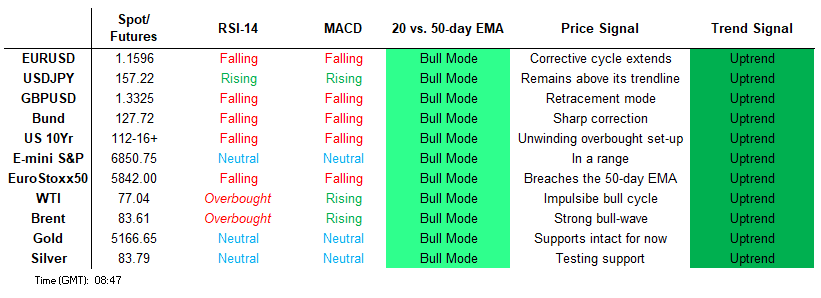
- S&P E-Minis have recovered from their most recent lows. For now, the contract continues to trade inside a range. Attention is on the base of this range at 6751.50, the Feb 6 low. A strong short-term reversal in EUROSTOXX 50 futures has resulted in a breach of both the 20- and 50-day EMAs. This highlights potential for a deeper near-term pullback.
- The short-term trend condition in GBPUSD remains bearish following recent weakness and the breach of a number of important short-term support levels. 1.3331, the Jan 19 low and a key support, has been cleared. The trend condition in USDJPY remains bullish and this week’s gains reinforce current conditions. The latest rally resulted in a break above the 50-day EMA, highlighting a stronger reversal. The AUDUSD trend structure is unchanged, it remains bullish and the recovery from Tuesday’s low reinforces this theme - pullbacks appear corrective.
- Gold continues to trade below Monday’s intraday high. For now, a short-term bullish theme remains intact following recent gains. The metal has cleared all key retracement points of the sharp sell-off between Jan 29 - Feb 2. A volatile bull cycle in WTI futures remains intact. Despite being in overbought territory, the contract traded higher Tuesday to confirm a resumption of the current uptrend.
- A sharp reversal in Bund futures this week highlights at the very least, a short-term top in the uptrend and the start of a correction. The contract maintains a bearish tone - for now. The sharp reversal this week in Gilt futures confirms the end of the recent bull cycle. The contract has traded through support at 91.81, the Feb 19 low, signalling scope for a deeper pullback.
[GLOBAL] MNI Tech Trend Monitor - Highlighting Longer-Term Trends:
- Refreshing the MNI Tech Trend Monitor, Adding USDZAR, USDCNH and the e-mini S&P chart, while refreshing levels for Gold, USD/JPY, EUR/GBP, EUR/HUF, USD/MXN, the European Banking Stock Index (SX7E) as well as UK Gilts.
See full document here: https://media.marketnews.com/MNI_Tech_Trend_Monitor_Jan26_cef40b4ef1.pdf
FOREIGN EXCHANGE
EURUSD TECHS: Trading Closer To Its Recent Lows
- RES 4: 1.1929 High Feb 10
- RES 3: 1.1878 High Feb 16
- RES 2: 1.1764/1.1835 50-day EMA / High Feb 23 and key resistance
- RES 1: 1.1707 High Mar 3
- PRICE: 1.1593 @ 06:02 GMT Mar 5
- SUP 1: 1.1530 Low Mar 03
- SUP 2: 1.1491 Low Nov 21 ‘25
- SUP 3: 1.1456 1.50 proj of the Jan 27 - Feb 6 - 10 price swing
- SUP 4: 1.1392 Low Aug 1 ‘25
A bear cycle in EURUSD remains in play and the pair is trading closer to its recent lows. The sharp sell-off this week has resulted in a move below 1.1693, the 76.4% retracement of the bull leg between Jan 19 - 27. The break strengthens a bearish theme and attention is on 1.1573, the Jan 19 low and a key support. This level has been pierced, a clear break of it would open 1.1491, the Nov 21 ‘25 low. First resistance is 1.1707, Tuesday’s high.
GBPUSD TECHS: Outlook Remains Bearish
- RES 4: 1.3712 High Feb 11
- RES 3: 1.3662 High Feb 16
- RES 2: 1.3575 High Feb 26 and a key S/T resistance
- RES 1: 1.3434 Low Feb 19
- PRICE: 1.3320 @ 06:26 GMT Mar 05
- SUP 1: 1.3253 Low Mar 03
- SUP 2: 1.3212 76.4% retracement of the Nov 4 ‘25 - Jan 27 bull cycle
- SUP 3: 1.3180 Low Dec 2 ‘25
- SUP 4: 1.3125 Low NOv 26 ‘25
The short-term trend condition in GBPUSD remains bearish following recent weakness and the breach of a number of important short-term support levels. 1.3331, the Jan 19 low and a key support, has been cleared. This break strengthens a bear theme and opens 1.3212, a Fibonacci retracement. On the upside, initial firm resistance is seen at 1.3575, the Feb 26 high, where a breach is required to signal a possible reversal.
EURGBP TECHS: Pullback Appears Corrective For Now
- RES 4: 0.8840 High Nov 20 ‘25
- RES 3: 0.8818 High Nov 26 ‘25
- RES 2: 0.8806 76.4% retracement of the Nov 14 - Feb 4 bear leg
- RES 1: 0.8739/89 High Mar 3 / High Feb 27 and key S/T resistance
- PRICE: 0.8709 @ 06:50 GMT Mar 5
- SUP 1: 0.8686/8673 Low Mar 4 / Low Feb 6
- SUP 2: 0.8613 Low Feb 04 and bear trigger
- SUP 3: 0.8597 Low Aug 14
- SUP 4: 0.8578 Low Jul 2 ‘25
EURGBP is trading closer to its recent lows. Despite the recent sell-off, a bullish theme is intact. However, note that the cross has traded through a key support at 0.8711, the 50-day EMA. A clear break of this average would highlight a potential short-term reversal. This would open 0.8673 next, the Feb 6 low. Key S/T resistance has been defined at 0.8789, the Feb 27 high, where a break would confirm a resumption of the recent bull leg.
USDJPY TECHS: Trend Needle Points North
- RES 4: 160.00 Psychological round number
- RES 3: 159.45 High Jan 14 and the bull trigger
- RES 2: 159.23 High Jan 23
- RES 1: 157.97 High Mar 3
- PRICE: 157.04 @ 07:01 GMT Mar 5
- SUP 1: 155.62/154.00 50-day EMA / Low Feb 23
- SUP 2: 152.56 Trendline support drawn from the Apr 22 ‘25 low
- SUP 3: 152.10 Low Jan 27 and a bear trigger
- SUP 4: 151.54 Low Oct 29 ‘25
The trend condition in USDJPY remains bullish and this week’s gains reinforce current conditions. The latest rally resulted in a break above the 50-day EMA, highlighting a stronger reversal. Resistance at 157.76, the Feb 9 high, has been pierced. A clear breach of this level would open 159.45, the Jan 14 high and a key hurdle for bulls. Initial firm support lies at 154.00, the Feb 23 low.
EURJPY TECHS: Pierces Bull Channel Support
- RES 4: 186.87 High Jan 23 and a key M/T resistance
- RES 3: 186.36 High Feb 9
- RES 2: 185.05 76.4% retracement of the Feb 9 - 12 bear leg
- RES 1: 184.77 High Feb 25 and a short-term bull trigger
- PRICE: 182.24 @ 07:28 GMT Mar 05
- SUP 1: 182.48/03 Bull channel from Feb 28 ‘25 low / Low Mar 03
- SUP 2: 180.81 Low Feb 12
- SUP 3: 180.10 Low Dec 5 ‘25
- SUP 4: 179.30 23.6% of the Feb 28 ‘25 - Jan 23 bull cycle
Key support in EURJPY to monitor lies at 182.48, the base of a bull channel drawn from the Feb 28 ‘25 low. The line has again been pierced, a clear break of it is required to signal a stronger reversal and would suggest scope for a deeper retracement, towards another key support at 181.81, the Feb 12 low. For bulls, initial resistance to monitor is 184.77, the Feb 25 high. A break of it would highlight the resumption of a fresh bull wave inside the channel.
AUDUSD TECHS: Trend Structure Remains Bullish
- RES 4: 0.7208 61.8% of the Feb 25 ‘21 - Apr 9 ‘25 bear leg
- RES 3: 0.7186 2.236 proj of the Nov 21 - Dec 10 - 18 price swing
- RES 2: 0.7158 High Feb 2 2023
- RES 1: 0.7147 High Feb 12 and the bull trigger
- PRICE: 0.7044 @ 07:35 GMT Mar 5
- SUP 1: 0.6944 Low Mar 03
- SUP 2: 0.6931 50-day EMA and key support
- SUP 3: 0.6897 Low Feb 6
- SUP 4: 0.6834 Low Jan 23
The AUDUSD trend structure is unchanged, it remains bullish and the recovery from Tuesday’s low reinforces this theme - pullbacks appear corrective. Note that the MA set-up is in a bull mode position too and this highlights a dominant uptrend. Key support to monitor is around the 50-day EMA, at 0.6931. A clear break of the average would alter the picture. Key resistance and bull trigger is unchanged at 0.7147, the Feb 12 high.
USDCAD TECHS: Monitoring Key Resistance
- RES 4: 1.3929 High Jan 16 and a reversal trigger
- RES 3: 1.3845 High Jan 22
- RES 2: 1.3800 High Jan 23
- RES 1: 1.3725/3753 High Feb 6 and 24 / High Mar 03
- PRICE: 1.3650 @ 07:56 GMT Mar 5
- SUP 1: 1.3625/3556 Low Feb 27 / 12
- SUP 2: 1.3482 Low Jan 30 and the bear trigger
- SUP 3: 1.3420 Low Sep 25 ‘24
- SUP 4: 1.3400 50.0% retracement of the 2021 - 2025 uptrend
A key short-term resistance in USDCAD at 1.3725, the Feb 6 and 24 high, has been pierced but remains intact for now. A clear breach of this hurdle would highlight a potential reversal and suggest scope for a stronger bull phase. This would open 1.3800 initially, the Jan 23 high. For now, the M/T trend structure remains bearish - MA studies continue to highlight a dominant downtrend. The bear trigger lies at 1.3482, the Jan 30 low.
FIXED INCOME
BUND TECHS: (M6) Bear Theme Remains In Play
- RES 4: 129.52 High Mar 2 and key resistance
- RES 3: 128.74 Low Feb 27
- RES 2: 128.62 High Mar 3
- RES 1: 128.28 High Mar 4
- PRICE: 127.75 @ 05:38 GMT Mar 5
- SUP 1: 127.50 Low Mar 3
- SUP 2: 127.28 61.8% retracement of the Dec 22 - Mar 2 bull cycle
- SUP 3: 127.03 Low Feb 9
- SUP 4: 126.75 76.4% retracement of the Dec 22 - Mar 2 bull cycle
A sharp reversal in Bund futures this week highlights at the very least, a short-term top in the uptrend and the start of a correction. The contract maintains a bearish tone - for now - and the pullback is also unwinding a recent overbought condition. A continuation lower would open 127.28 next, a Fibonacci retracement. Initial firm resistance is 128.62, the Mar 3 high. Key resistance has been defined at 129.52, the Mar 2 high.
BOBL TECHS: (M6) Bear Cycle Intact
- RES 4: 118.300 High Mar 2 and the bull trigger
- RES 3: 17.800 Low Feb 27
- RES 2: 117.650 High Mar 3 and a key near-term resistance
- RES 1: 117.470 High Mar 4
- PRICE: 117.100 @ 06:00 GMT Mar 5
- SUP 1: 116.880 Low Mar 3
- SUP 2: 116.760 0.50 proj of the Mar 2 - 3 - 4 price swing
- SUP 3: 116.592 0.618 proj of the Mar 2 - 3 - 4 price swing
- SUP 4: 116.385 0.764% of the Dec 10 ‘25 - Mar 2 bull cycle
Bobl futures remain in a bear mode set-up following this week’s sharp impulsive sell-off. The contract continues to trade closer to its recent lows, reinforcing current bearish conditions. An extension lower would open 116.70, a Fibonacci projection. On the upside, initial firm resistance is seen at 117.650, the Mar 3 high. Key resistance has been defined at 118.300, the Mar 2 high.
SCHATZ TECHS: (M6) Bearish Conditions Prevail
- RES 4: 107.040 High Mar 2 and key resistance
- RES 3: 106.915 Low Feb 27
- RES 2: 106.800 High Mar 3
- RES 1: 106.745 High Mar 4
- PRICE: 106.640 @ 06:19 GMT Mar 5
- SUP 1: 106.515 Low Mar 3
- SUP 2: 106.483 0.50 proj of the Mar 2 - 3 - 4 price swing
- SUP 3: 106.421 0.618 projection of the Mar 2 - 3 - 4 price swing
- SUP 4: 106.400 Round number support
A sharp sell-off in Schatz futures this week confirms a clear reversal of the recent bull cycle. Short-term trend signals suggest potential for a continuation lower near-term and sights are on 106.483, a 0.50 projection of the Mar 2 - 3 - 4 price swing. On the upside, initial firm resistance is seen at 106.800, the Mar 3 high. Key resistance has been defined at 107.040, the Mar 2 high. Short-term gains for now, would be considered corrective.
GILT TECHS: (M6) Bearish Phase
- RES 4: 93.72 High Feb 27 and key resistance
- RES 3: 92.87 Low Mar 2 and gap high
- RES 2: 92.47 High Mar 3
- RES 1: 92.34 High Mar 4
- PRICE: 92.21 @ Close Mar 4
- SUP 1: 91.14 Low Mar 3
- SUP 2: 90.72 76.4% retracement of the Feb 9 - 27 bull cycle
- SUP 3: 90.60 Low Feb 11
- SUP 4: 89.79 Low Feb 9 and key support
The sharp reversal this week in Gilt futures confirms the end of the recent bull cycle. The contract has traded through support at 91.81, the Feb 19 low, signalling scope for a deeper pullback. A resumption of the bear leg would open 90.72, a Fibonacci retracement. A break of this level would signal scope for a move towards 89.79, the Feb 9 low and a key support. Initial firm resistance is Tuesday’s high of 92.47.
BTP TECHS: (M6) Reversal Still In Play
- RES 4: 122.04 High 27 and key resistance
- RES 3: 121.30 Low Feb 23
- RES 2: 120.98 High Mar 3
- RES 1: 120.68 High Mar 4
- PRICE: 120.24 @ 07:03 GMT Mar 4
- SUP 1: 119.60 Low Mar 4
- SUP 2: 119.54 Low Jan 21
- SUP 3: 119.00 Round number support
- SUP 4: 118.41 1.00 proj of the Feb 27 - Mar 3 - 4 price swing
A strong sell-off in BTP futures this week highlights a short-term top and price action remains volatile. A resumption of the bear leg would pave the way for a move towards 119.54 next, the Jan 21 low. Further out, an extension would open the 119.00 handle. On the upside, initial firm resistance is seen at 120.98, the Mar 3 high. Key resistance has been defined at 122.04, the Feb 27 high.
EQUITIES
EUROSTOXX50 TECHS: (H6) Bear Threat Remains Present
- RES 4: 6209.00 High Feb 26 and the bull trigger
- RES 3: 6023.56 20-day EMA
- RES 2: 5964.14 50-day EMA
- RES 1: 5920.00 Intraday high
- PRICE: 5827.00 @ 06:40 GMT Mar 5
- SUP 1: 5742.00 Low Mar 3
- SUP 2: 5689.00 Low Dec 18 ‘25
- SUP 3: 5667.32 76.4% retracement of the Nov 21 ‘25 - Feb 26 bull leg
- SUP 4: 5546.00 Low Nov 25 ‘25
A strong short-term reversal in EUROSTOXX 50 futures has resulted in a breach of both the 20- and 50-day EMAs. This highlights potential for a deeper near-term pullback and Tuesday’s sell-off confirmed this threat. Sights are on 5689.00 next, the Dec 18 ‘25 low. On the upside, initial firm resistance is 5964.14, the 50-day EMA ahead of 6023.56, the 20-day EMA. For now, gains would likely be corrective.
E-MINI S&P: (H6) Trading In A Range
- RES 4: 7066.70 1.000 proj of the Feb 6 - 11 - 17 price swing
- RES 3: 7043.00 High Jan 28 and bull trigger
- RES 2: 6983.75 High Feb 25
- RES 1: 6907.60 50-day EMA
- PRICE: 6858.75 @ 07:21 GMT Mar 5
- SUP 1: 6751.50/6718.72 Low Feb 6 and range base / Low Mar 3
- SUP 2: 6733.00 Low Nov 25 ‘25
- SUP 3: 6691.56 76.4% retracement of the Nov 21 - Jan 28 bull leg
- SUP 4: 6583.00 Low Nov 21 ‘25 and a key medium-term support
S&P E-Minis have recovered from their most recent lows. For now, the contract continues to trade inside a range. Attention is on the base of this range at 6751.50, the Feb 6 low. This support has been pierced, a clear break of it would highlight a stronger bear threat. On the upside, a resumption of gains and a breach of 6983.75, the Feb 25 high, would instead refocus attention on key resistance and the range top at 7043.00, the Jan 28 high.
COMMODITIES
BRENT TECHS: (K6) Impulsive Bull Wave Intact
- RES 4: $90.00 - Psychological round number
- RES 3: $88.03 - 3.236 proj of the Feb 17 - 23 - 26 price swing
- RES 2: $86.65 - 3.000 proj of the Feb 17 - 23 - 26 price swing
- RES 1: $85.12 - High Mar 3
- PRICE: $83.00 @ 06:55 GMT Mar 5
- SUP 1: $75.75 - Low Mar 2
- SUP 2: $72.01 - 20-day EMA
- SUP 3: $68.08 - 50-day EMA
- SUP 4: $64.51 - Low Feb 3
A volatile bull cycle in Brent futures remains intact. Despite being in overbought territory, Tuesday’s gains confirmed a resumption of the bull leg. The break higher paves the way for a climb towards $86.65, a Fibonacci projection, ahead of the $90.00 handle. On the downside, a pullback would allow the overbought position to unwind. First key support to watch lies at $72.01 the 20-day EMA.
WTI TECHS: (J6) Overbought But Remains Bullish
- RES 4: $81.46 - 3.236 proj of the Feb 17 - 23 - 26 price swing
- RES 3: $80.00 - Round number resistance
- RES 2: $78.05 - 2.618 proj of the Feb 17 - 23 - 26 price swing
- RES 1: $78.09 - Intraday high
- PRICE: $76.82 @ 07:05 GMT Mar 4
- SUP 1: $69.20 - Low Mar 2
- SUP 2: $66.75 - 20-day EMA
- SUP 3: $63.50 - 50-day EMA
- SUP 4: $59.94 - Low Jan 27
A volatile bull cycle in WTI futures remains intact. Despite being in overbought territory, the contract traded higher Tuesday to confirm a resumption of the current uptrend. The move higher paves the way for a climb towards the $80.00 handle next. The first key support to monitor is $66.75, the 20-day EMA. A pullback would allow the overbought condition to unwind.
GOLD TECHS: Support Intact For Now
- RES 4: $5700.0 - Round number resistance
- RES 3: $5654.3 - 2.500 proj of the Nov 18 - Dec 26 - 31‘25 swing
- RES 2: $5595.5 - High Jan 29 and key resistance
- RES 1: $5419.1 - High Mar 2
- PRICE: $5164.4 @ 07:25 GMT Mar 5
- SUP 1: $5083.1 - 20-day EMA
- SUP 2: $4982.0 - Low Feb 20
- SUP 3: $4862.3 - 50-day EMA
- SUP 4: $4655.7 - Low Feb 6
Gold continues to trade below Monday’s intraday high. For now, a short-term bullish theme remains intact following recent gains. The metal has cleared all key retracement points of the sharp sell-off between Jan 29 - Feb 2. This strengthens the short-term bullish theme and signals scope for an extension towards key resistance and the bull trigger at $5595.5, the Jan 29 high. Initial firm support to watch lies at $5083.1, the 20-day EMA.
SILVER TECHS: Volatile Bull Cycle Intact
- RES 4: $121.654 - High Jan 30 and key resistance
- RES 3: $108.071 - 76.4% retracement of the Jan 29 - Feb 6 sell-off
- RES 2: $100.000 - Round number resistance
- RES 1: $97.804 - High Mar 2
- PRICE: $83.018 @ 08:14 GMT Mar 5
- SUP 1: $81.637- 50-day EMA
- SUP 2: $77.982 - Low Mar 3
- SUP 3: $72.020 - Low Feb 17
- SUP 4: $64.098 - Low Feb 6 and the bear trigger
A short-term volatile bull cycle in Silver remains intact and the latest pullback appears corrective. A resumption of gains would pave the way for a climb towards $99.668, the 61.8% retracement of the sell-off between Jan 29 - Feb 6. A move through this price point would expose 108.071, the 76.4% retracement. Key short-term support to watch lies at $81.637, the 50-day EMA. It has been pierced, a clear breach of it would be bearish.