MNI DAILY TECHNICAL ANALYSIS - EStoxx Maintains Positive Tone
Price Signal Summary - EStoxx Maintains Positive Tone
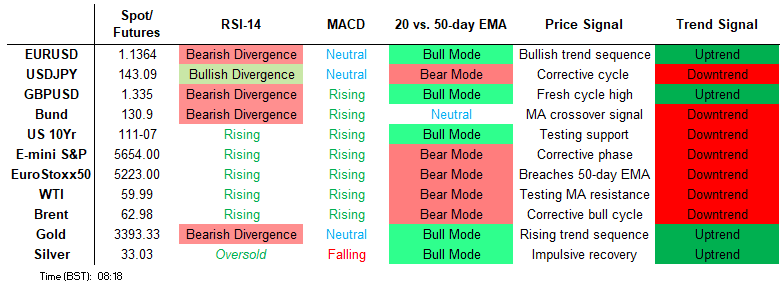
- Bullish conditions in S&P E-Minis remain intact. The contract has breached the 50-day EMA, at 5622.98. A continuation of the bull phase would expose 5837.25 next, the Mar 25 high and a bull trigger. Eurostoxx 50 futures maintain a positive tone and the contract is trading at its recent highs. Price has recently cleared both the 20- and 50-day EMAs, and attention is on 5263.01, 76.4% of the Mar 3 - Apr 7 bear leg.
- EURUSD is trading closer to its recent lows. The latest pullback appears corrective. The trend remains bullish - MA studies are in a bull-mode position signalling a dominant uptrend. The latest move down has also allowed an overbought condition to unwind. The primary trend direction in USDJPY remains bearish and gains since Apr 22 appear corrective. Resistance at the 50-day EMA, at 146.33, remains intact. A clear break of this average would highlight a possible reversal. AUDUSD had traded to a fresh short-term cycle high, today. A bullish theme remains intact. The recent breach of 0.6450, the Apr 29 high, confirms a resumption of the uptrend and maintains the current sequence of higher highs and higher lows.
- Gold has recovered from its recent lows and this suggests the correction between Apr 22 - May 1, is over. A continuation higher would refocus attention on key resistance and the bull trigger at $3500.1, the Apr 22 high. A medium-term bearish trend in WTI futures remains intact and short-term gains are considered corrective. The move down that started Apr 23 signals the end of the correction between Apr 9 - 23.
- Bund futures remain below their most recent highs. Despite the latest move down, a bull cycle is intact and the sell-off between Apr 7 - 9 is considered corrective. Sights are on resistance at 132.03, the Apr 7 high and a bull trigger. A bull cycle in Gilt futures remains intact and short-term weakness is - for now - considered corrective. Tuesday’s low print resulted in a test of support at the 50-day EMA, at 92.47. A clear break of this average would signal scope for a deeper retracement and expose 91.73, the Apr 17 low.
FOREIGN EXCHANGE
EURUSD TECHS: Remains Above Support At The 20-Day EMA
- RES 4: 1.1696 1.618 proj of the Feb 28 - Mar 18 - 27 price swing
- RES 3: 1.1625 1.500 proj of the Feb 28 - Mar 18 - 27 price swing
- RES 2: 1.1608 High Nov 9 2021
- RES 1: 1.1440/1573 High Apr 23 / 21 and the bull trigger
- PRICE: 1.1357 @ 06:23 BST May 7
- SUP 1: 1.1279 20-day EMA and a key support
- SUP 2: 1.1144 High Apr 3
- SUP 3: 1.1047 50-day EMA and a pivot level
- SUP 4: 1.0805 Low Apr 3
EURUSD is trading closer to its recent lows. The latest pullback appears corrective. The trend remains bullish - MA studies are in a bull-mode position signalling a dominant uptrend. The latest move down has also allowed an overbought condition to unwind. A resumption of gains would open 1.1608, the Nov 9 2021 high. Initial key support to watch is the 20-day EMA, at 1.1279. A break of this average would signal scope for a deeper retracement.
GBPUSD TECHS: Trend Structure Remains Bullish
- RES 4: 1.3605 1.236 proj of the Feb 28 - Apr 3 - 7 price swing
- RES 3: 1.3550 High Feb 24 ‘22
- RES 2: 1.3510 1.236 proj of the Feb 28 - Apr 3 - 7 price swing
- RES 1: 1.3444 High Apr 28 / 29 and the bull trigger
- PRICE: 1.3352 @ 06:32 BST May 7
- SUP 1: 1.3257 Low May 5
- SUP 2: 1.3245 20-day EMA
- SUP 3: 1.3041/3058 Low Apr 14 / 50-day EMA
- SUP 4: 1.2968 Low Apr 11
Recent weakness in GBPUSD appears corrective and the pair continues to trade inside a range with support at 1.3245, the 20-day EMA, intact. A clear break of this average would signal scope for a deeper retracement. Note that moving average studies remain in a bull-mode position, signalling a dominant underlying uptrend. A resumption of gains would open 1.3510, a Fibonacci projection.
EURGBP TECHS: Bear Cycle Still In Play
- RES 4: 0.8781 2.236 proj of the Mar 3 - 11 - 28 price swing
- RES 3: 0.8768 High Nov 20 ‘23
- RES 2: 0.8624/0.8738 High Apr 21/ High Apr 11 and the bull trigger
- RES 1: 0.8557 High Apr 28
- PRICE: 0.8507 @ 06:54 BST May 7
- SUP 1: 0.8469/62 50-day EMA / Low May 6
- SUP 2: 0.8432 Low Apr 4
- SUP 3: 0.8415 76.4% retracement of the Mar 28 - Apr 11 rally
- SUP 4: 0.8316 Low Mar 28 and a key support
EURGBP traded lower again Tuesday, briefly piercing support at the 50-day EMA - at 0.8469. A clear break of the average would strengthen a bearish theme and signal scope for a deeper retracement. This would open 0.8415, a Fibonacci retracement. It is still possible the move down since Apr 11, is a correction. A clear reversal would open 0.8738, the Apr 11 high and bull trigger. First key resistance is 0.8624, the Apr 21 high.
USDJPY TECHS: Trend Needle Points South
- RES 4: 149.28 High Apr 3
- RES 3: 148.27 High Apr 9
- RES 2: 146.33 50-day EMA and key resistance
- RES 1: 145.92 High May 2
- PRICE: 143.02 @ 07:06 BST May 7
- SUP 1: 141.97 Low Apr 29
- SUP 2: 139.79 1.382 proj of the Feb 12 - Mar 11 - 28 price swing
- SUP 3: 138.82 1.500 proj of the Feb 12 - Mar 11 - 28 price swing
- SUP 4: 138.07 Low Jul 28 ‘23
The primary trend direction in USDJPY remains bearish and gains since Apr 22 appear corrective. Resistance at the 50-day EMA, at 146.33, remains intact. A clear break of this average would highlight a possible reversal. Moving average studies are in a bear-mode position and continue to highlight a dominant downtrend. A resumption of the trend would open 139.79 next, a Fibonacci projection. First key support to watch is 141.97, the Apr 29 low.
EURJPY TECHS: Monitoring Support At The 50-Day EMA
- RES 4: 165.95 2.0% 10-dma envelope
- RES 3: 165.43 High Nov 8
- RES 2: 164.90 High Dec 30 ‘24 and a key medium-term resistance
- RES 1: 164.63 High Mar 18 and the bull trigger
- PRICE: 162.54 @ 07:11 GMT May 7
- SUP 1: 161.70/60 50-day EMA / Low May 6
- SUP 2: 160.99 Low Apr 22
- SUP 3: 159.48 Low Apr 9
- SUP 4: 158.56 61.8% retracement of the Feb 28 - May 2 bull leg
A bullish theme in EURJPY remains intact despite the pullback from the May 2 high. The recent print above key resistance at 164.19, Mar 18 high, is a positive development for bulls. A clear break of this hurdle would confirm a resumption of the upleg that started Feb 28. This would open 164.90 next, the Dec 30 ‘24 high. First key support to watch is 161.70, the 50-day EMA. It has been pierced, a clear break would undermine the bullish theme.
AUDUSD TECHS: Northbound
- RES 4: 0.5682 High Nov 12 ‘24
- RES 3: 0.6550 61.8% retracement of the Sep 30 ‘24 - Apr 9 bear leg
- RES 2: 0.6528 High Nov 29 ‘24
- RES 1: 0.6515 Intraday high
- PRICE: 0.6486 @ 07:53 BST May 7
- SUP 1: 0.6379/6333 20- and 50-day EMA values
- SUP 2: 0.6275 Low Apr 14
- SUP 3: 0.6181 Low Apr 11
- SUP 4: 0.6116 Low Apr 10
AUDUSD had traded to a fresh short-term cycle high, today. A bullish theme remains intact. The recent breach of 0.6450, the Apr 29 high, confirms a resumption of the uptrend and maintains the current sequence of higher highs and higher lows. Note that moving average studies are in a bull-mode position, highlighting an uptrend. Sights are on 0.6528, the Nov 29 ‘24 high. Initial key support to monitor is 0.6333, the 50-day EMA.
USDCAD TECHS: Bears Remain In The Driver’s Seat
- RES 4: 1.4415 High Apr 1
- RES 3: 1.4296 High Apr 7
- RES 2: 1.4055 50-day EMA
- RES 1: 1.3901 20-day EMA
- PRICE: 1.3788 @ 07:59 BST May 7
- SUP 1: 1.3751 Low May 6
- SUP 2: 1.3744 76.4% retracement of Sep 25 ‘24 - Feb 3 bull run
- SUP 3: 1.3696 Low Oct 10 2024
- SUP 4: 1.3643 Low Oct 9 ‘24
Bearish conditions in USDCAD remain intact and the pair is trading at its recent lows. A fresh cycle low last Friday reinforces the bearish theme signalling scope for a continuation, near-term. Potential is seen for a move towards 1.3744, a Fibonacci retracement. Note that Moving average studies are in a bear mode position, highlighting a dominant downtrend. On the upside, first resistance to watch is 1.3901, the 20-day EMA.
FIXED INCOME
BUND TECHS: (M5) Support Remains Intact
- RES 4: 133.90 1.236 proj of the Mar 25 - Apr 7- 9 price swing
- RES 3: 133.00 round number resistance
- RES 2: 132.56 High Feb 28 and a key resistance
- RES 1: 132.03 High Apr 7 and the bull trigger
- PRICE: 130.98 @ 05:33 BST May 7
- SUP 1: 130.54/129.92 50-day EMA / Low Apr 11
- SUP 2: 129.02 Low Apr 10
- SUP 3: 128.60 Low Apr 9 and a key support
- SUP 4: 128.47 Low Mar 28
Bund futures remain below their most recent highs. Despite the latest move down, a bull cycle is intact and the sell-off between Apr 7 - 9 is considered corrective. Sights are on resistance at 132.03, the Apr 7 high and a bull trigger. A clear break of this level would confirm a resumption of the uptrend and open 132.56, the Feb 28 high. Firm support lies at 128.60, Apr 9 low. A breach of it would alter the picture. First support is 130.54, the 50-day EMA.
BOBL TECHS: (M5) Testing Support At The 20-Day EMA
- RES 4: 120.20 High Dec 12 ‘24 (cont)
- RES 3: 120.000 Psychological round number
- RES 2: 119.960 High Apr 7 and the bull trigger
- RES 1: 119.780 High Apr 22
- PRICE: 119.230 @ 06:10 BST May 7
- SUP 1: 119.010 Low May 5
- SUP 2: 118.670 50-day EMA
- SUP 3: 118.060 Low Apr 10
- SUP 4: 117.680 Low Apr 9 and a key support
A bull cycle in Bobl futures remains in play and the steep sell-off between Apr 7 - 9 is considered corrective. Gains in early April resulted in a break of key resistance at 119.040, the Feb 28 high, strengthening bullish conditions. Sights are on the 120.000 handle next. On the downside, firm support lies at 117.680, the Apr 9 low. The 20-day EMA, an important short-term support, at 119.102, has been pierced. The 50-day EMA is at 118.670.
SCHATZ TECHS: (M5) Corrective Cycle
- RES 4: 107.812 0.618 proj of the Mar 6 - Apr 7 - 9 price swing
- RES 3: 107.800 Round number resistance
- RES 2: 107.775 High Apr 7 and the bull trigger
- RES 1: 107.600/735 High Apr 30 / 22
- PRICE: 107.440 @ 06:28 BST May 7
- SUP 1: 107.370 Low Apr 17
- SUP 2: 107.252 38.2% retracement of the Mar 6 - Apr 7 bull cycle
- SUP 3: 107.125 Low Apr 10
- SUP 4: 106.965 Low Apr 9 and a key support
A bull cycle in Schatz futures remains in play and recent weakness appears corrective. Attention is on resistance at 107.775, the Apr 7 high and bull trigger. Clearance of this level would confirm a resumption of the uptrend and open 107.812, a Fibonacci projection. Moving average studies remain in a bull-mode position, highlighting a dominant uptrend. Initial support to watch lies at 107.370, the Apr 17 low.
GILT TECHS: (M5) Pullback Considered Corrective
- RES 4: 94.75 76.4% of the Dec 3 ‘24 - Jan 13 bear leg (cont)
- RES 3: 94.50 High Apr 7 and key resistance
- RES 2: 94.00 Round number resistance
- RES 1: 92.99/93.93 High May 6 / 2
- PRICE: 92.82 @ Close May 6
- SUP 1: 92.32 Low May 6
- SUP 2: 91.73/91.43 Low Apr 17 / 15
- SUP 3: 90.47/89.99 Low Apr 11 / 9
- SUP 4: 89.68 Low Jan 15 (cont)
A bull cycle in Gilt futures remains intact and short-term weakness is - for now - considered corrective. Tuesday’s low print resulted in a test of support at the 50-day EMA, at 92.47. A clear break of this average would signal scope for a deeper retracement and expose 91.73, the Apr 17 low. On the upside, a resumption of gains would open 94.50, the Apr 7 high and a key resistance. Initial firm resistance to monitor is 93.93, the May 2 high.
BTP TECHS: (M5) Bullish Outlook
- RES 4: 121.93 76.4% of the Dec 5 ‘24 - Mar 14 bear leg (cont)
- RES 3: 121.43 1.618 proj of the Mar 14 - Apr 4 - 9 price swing
- RES 2: 121.00 High Feb 7 (cont) and a key resistance
- RES 1: 120.65 1.382 proj of the Mar 14 - Apr 4 - 9 price swing
- PRICE: 119.95 @ Close May 6
- SUP 1: 119.39 20-day EMA
- SUP 2: 118.09 Low Apr 14
- SUP 3: 117.28 Low Apr 10
- SUP 4: 116.06 Low Apr 9
BTP futures remain in consolidation mode. A bull cycle is intact and the contract is holding on to the bulk of its latest gains. The recent break of a key resistance at 120.39, the Feb 28 high, reinforces a bullish theme. Sights are on 120.65 next, a Fibonacci projection. Firm support to watch lies at 119.39, the 20-day EMA. The contract is overbought, a deeper pullback would unwind this trend condition.
EQUITIES
EUROSTOXX50 TECHS: (M5) Trading AT Its Recent Highs
- RES 4: 5516.00 High Mar 3 and the key bull trigger
- RES 3: 5471.00 High Mar 19 / 20
- RES 2: 5341.00 High Mar 27
- RES 1: 5263.01/66.00 76.4% of Mar 3 - Apr 7 bear leg / High May 5
- PRICE: 5233.00 @ 06:32 BST May 7
- SUP 1: 5082.47 20-day EMA
- SUP 2: 4959.00/4812.00 Low Apr 23 / 16 and a key support
- SUP 3: 4664.00 Low Apr 10
- SUP 4: 4444.00 Low Apr 7 and the bear trigger
Eurostoxx 50 futures maintain a positive tone and the contract is trading at its recent highs. Price has recently cleared both the 20- and 50-day EMAs, and attention is on 5263.01, 76.4% of the Mar 3 - Apr 7 bear leg. This hurdle has been pierced, a clear break of it would pave the way for a climb towards 5341.00, the Mar 27 high. Initial support to watch lies at 5082.47, the 20-day EMA. Clearance of this level would signal a possible reversal.
E-MINI S&P: (M5) Bull Cycle Intact
- RES 4: 5864.43 200-dma
- RES 3: 5837.25 High Mar 25 and a bull trigger
- RES 2: 5773.25 High Apr 2
- RES 1: 5724.75 High May 2
- PRICE: 5649.25 @ 07:24 BST May 7
- SUP 1: 5536.59 20-day EMA
- SUP 2: 5355.25/5127.25 Low Apr 24 / 21 and a key support
- SUP 3: 4996.43 76.4% retracement of the Apr 7 - 10 bounce
- SUP 4: 4832.00 Low Apr 7 and the bear trigger
Bullish conditions in S&P E-Minis remain intact. The contract has breached the 50-day EMA, at 5622.98. A continuation of the bull phase would expose 5837.25 next, the Mar 25 high and a bull trigger. It is still possible that the entire rally since Apr 7 is a correction. A reversal lower would signal the end of this corrective phase and expose initially, support at 5127.25, the Apr 21 low. First support to watch is 5536.59, the 20-day EMA.
COMMODITIES
BRENT TECHS: (N5) Support Remains Exposed
- RES 4: $78.10 - High Jan 15
- RES 3: $75.81 - High Feb 20
- RES 2: $74.63 - High Apr 2 and a bull trigger
- RES 1: $64.24/67.17 - 20- and 50-day EMA values
- PRICE: $62.71 @ 07:06 BST May 7
- SUP 1: $58.00 -Low April 9 and the bear trigger
- SUP 2: $56.29 - 2.236 proj of the Feb 20 - Mar 5 - Apr 2 price swing
- SUP 3: $55.10 - 2.382 proj of the Feb 20 - Mar 5 - Apr 2 price swing
- SUP 4: $54.00 - Round number support
A bearish theme in Brent futures remains intact and recent weakness reinforces current conditions. Last week’s price action confirms recent gains between Apr 9 - 23 as corrective that allowed an oversold condition to unwind. Sights are on $56.29 a Fibonacci projection. On the upside, key resistance to monitor is at the 50-day EMA, at $67.17. Initial resistance is at $64.24, the 20-day EMA.
WTI TECHS: (M5) Bear Threat Remains Present
- RES 4: $75.51 - High Jan 15 and a key resistance
- RES 3: $72.56 - High Feb 20
- RES 2: $71.76 - High Apr 2 and key resistance
- RES 1: $61.26/64.12 - 20- and 50-day EMA values
- PRICE: $59.87 @ 07:12 BST May 7
- SUP 1: $54.67 - Low April 9 and the bear trigger
- SUP 2: $53.72 - 2.236 proj of the Feb 20 - Mar 5 - Apr 2 price swing
- SUP 3: $52.54 - 2.382 proj of the Jan 15 - Feb 4 - 11 price swing
- SUP 4: $50.00 - Psychological round number
A medium-term bearish trend in WTI futures remains intact and short-term gains are considered corrective. The move down that started Apr 23 signals the end of the correction between Apr 9 - 23. That cycle higher allowed an oversold condition to unwind. Attention is on $54.67, the Apr 9 low and a bear trigger. Clearance of this level would resume the downtrend and open $53.72, a Fibonacci projection. Key resistance to watch is $64.12, the 50-day EMA.
GOLD TECHS: Recovery Reinforces A Bullish Theme
- RES 4: $3600.0 - Round number resistance
- RES 3: $3578.0 - 2.000 proj of the Dec 19 - Feb 24 - Feb 28 swing
- RES 2: $3547.9 - 1.764 proj of the Feb 28 - Apr 3 - Apr 7 price swing
- RES 1: $3435.0/3500.1 - High May 6 / High Apr 22 and bull trigger
- PRICE: $3394.0 @ 07:22 BST May 7
- SUP 1: $3269.2/3202.0 - 20-day EMA / Low May 1
- SUP 2: $3167.8 - High Apr 3 and a recent breakout level
- SUP 3: $3164.3 - 61.8% retracement Apr 7 - Apr 22 upleg
- SUP 4: $3115.1 - 50-day EMA
Gold has recovered from its recent lows and this suggests the correction between Apr 22 - May 1, is over. A continuation higher would refocus attention on key resistance and the bull trigger at $3500.1, the Apr 22 high. Clearance of this level would confirm a resumption of the primary uptrend. Key short-term support has been defined at $3202.0, the May 1 low. A break of this level is required to signal scope for a deeper retracement.
SILVER TECHS: Trend Direction Remains Up
- RES 4: $36.000 - Round number resistance
- RES 3: $34.903 - High Oct 23 ‘24 and the bull trigger
- RES 2: $34.590 - High Mar 28
- RES 1: $33.686 - High Apr 25
- PRICE: $33.064 @ 08:07 BST May 7
- SUP 1: $31.668 - Low May 1
- SUP 2: $30.915/28.351 - Low Apr 11 / 7 and the bear trigger
- SUP 3: $27.686 - Low Sep 6 ‘24
- SUP 4: $27.180 - Low Aug 14 ‘24
A strong rally in Silver on Apr 23 reinforced the current bullish theme. This suggests the latest pullback that started Apr 25, is a correction. Key short-term support has been defined at $31.668, the May 1 low. A break of this level would signal scope for a deeper retracement and open $30.915, the Apr 11 low. For bulls, resistance to watch is $33.686, the Apr 24 high. Clearance of this level would confirm a resumption of the uptrend.