MNI DAILY TECHNICAL ANALYSIS - Corrective Equity Bounce Erased
Price Signal Summary – Corrective Bounce Erased in Stocks
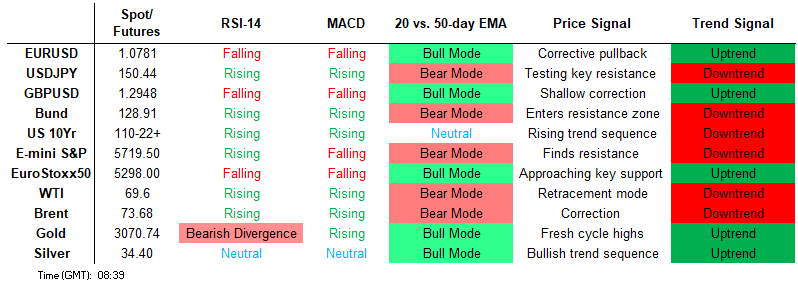
- S&P E-Minis have pulled back from Tuesday’s high. The trend condition is bearish and gains since Mar 13 are considered corrective. However, note that the 20-day EMA has recently been breached. The medium-term trend direction in Eurostoxx 50 futures is up and recent short-term weakness - for now - appears corrective. Support to watch is the 50-day EMA, at 5296.44. It has been pierced.
- Recent weakness in EURUSD appears corrective and the trend remains bullish. MA studies are in a bull-mode position highlighting a dominant uptrend. Thursday’s low of 1.0733 marks a key near-term support. A bear cycle in EURGBP remains in play and the cross is trading at this week’s lows. For now, the move down that started Mar 11 still appears corrective and has allowed a recent overbought condition to unwind. AUDUSD is unchanged. A short-term bull theme is intact and the latest move down appears corrective. Key short-term support to watch is 0.6187, the Mar 4 low. Clearance of this level would reinstate a bear threat.
- The trend condition in Gold is unchanged, it remains bullish. Today’s strong gains have resulted in a clear breach of $3057.5, the Mar 20 high and a bull trigger. Despite recent gains, a bearish trend condition in WTI futures remains intact, and gains this month are considered corrective. However, a key resistance at $69.17, the 50-day EMA, has been pierced.
- Bund futures are trading at their recent highs. For now, the latest move higher appears corrective. The climb has allowed an oversold trend condition to unwind. Price has breached resistance at the 20-day EMA, at 128.63. The short-term trend outlook in Gilt futures remains bearish and Thursday’s move lower reinforces current conditions. The contract has traded below a key short-term support at 90.71, the Mar 6 low.
FOREIGN EXCHANGE
EURUSD TECHS: Finds Support
- RES 4: 1.1083 High Oct 2 2024
- RES 3: 1.1040 High Oct 4 2024
- RES 2: 1.0961 76.4% retracement of the Sep 25 ‘24 - Feb 3 bear leg
- RES 1: 1.0861/0955 High Mar 21 / 18 and the bull trigger
- PRICE: 1.0787 @ 06:16 GMT Mar 28
- SUP 1: 1.0766/33 20-day EMA / Low Mar 27
- SUP 2: 1.0642 50-day EMA and a short-term pivot level
- SUP 3: 1.0602 Low Mar 5
- SUP 4: 1.0548 50.0% retracement of the Feb 3 - Mar 18 bull run
Recent weakness in EURUSD appears corrective and the trend remains bullish. MA studies are in a bull-mode position highlighting a dominant uptrend. Thursday’s low of 1.0733 marks a key near-term support. A move through it would confirm a clear breach of the 20-day EMA and allow for a deeper correction towards the 50-day EMA at 1.0642. A stronger reversal higher would refocus attention on 1.0955, the Mar 18 high and bull trigger.
GBPUSD TECHS: Trend Outlook Remains Bullish
- RES 4: 1.3175 High Oct 4 2024
- RES 3: 1.3119 76.4% retracement of the Sep 26 ‘24 - Jan 13 bear leg
- RES 2: 1.3048 High Nov 6 ‘24
- RES 1: 1.3015 High Mar 20 and the bull trigger
- PRICE: 1.2942 @ 06:28 GMT Mar 28
- SUP 1: 1.2878/71 20-day EMA / Thursday’s low
- SUP 2: 1.2745 50-day EMA and a short-term pivot support
- SUP 3: 1.2679 Low Mar 4
- SUP 4: 1.2559 Low Feb 28
The trend in GBPUSD is bullish and the recovery off this week’s lows shows recent weakness as corrective. MA studies are in a bull-mode position highlighting a dominant uptrend. Support at the 20-day EMA, at 1.2878, is intact. A continuation higher and a breach of 1.3015, the Mar 20 high and bull trigger, would pave the way for a climb towards 1.3048, the Nov 6 2024 high. A clear breach of the 20-day EMA would signal scope for a deeper correction.
EURGBP TECHS: Monitoring Support
- RES 4: 0.8494 High Aug 26 ‘24
- RES 3: 0.8474 High Jan 20 and a key resistance
- RES 2: 0.8428/8450 High Mar 18 / 11 and the bull trigger
- RES 1: 0.8395 High Mar 24 and a key near-term resistance
- PRICE: 0.8334 @ 06:43 GMT Mar 28
- SUP 1: 0.8324 Low Mar 27
- SUP 2: 0.8321 61.8% retracement of the Mar 3 - 11 bull leg
- SUP 3: 0.8391 76.4% retracement of the Mar 3 - 11 bull leg
- SUP 4: 0.8241 Low Mar 3 and a key support
A bear cycle in EURGBP remains in play and the cross is trading at this week’s lows. For now, the move down that started Mar 11 still appears corrective and has allowed a recent overbought condition to unwind. Note that moving average studies are in a bull-mode position, highlighting a dominant uptrend. The next support to monitor lies at 0.8321, a Fibonacci retracement. Resistance to watch is 0.8395, the Mar 24 high.
USDJPY TECHS: Challenges Resistance At The 50-Day EMA
- RES 4: 154.80 High Dec 12 ‘24 and a key resistance
- RES 3: 152.70 50.0% retracement of the Jan 10 - Mar 11 bear leg
- RES 2: 151.30 High Mar 3
- RES 1: 151.21 Intraday high
- PRICE: 150.67 @ 06:51 GMT Mar 28
- SUP 1: 149.72 20-day EMA
- SUP 2: 148.18 Low Mar 20 and a key short-term support
- SUP 3: 148.12 1.0% 10-dma envelope
- SUP 4: 146.54 Low Mar 11 nad the bear trigger
USDJPY is holding on to this week's gains. The primary trend direction is unchanged, it remains down and the latest recovery is considered corrective. The pair has pierced resistance at 150.94, the 50-day EMA. A clear break of this EMA would undermine the bearish theme and signal scope for a stronger rally towards 152.70, a Fibonacci retracement. For bears, the first key support to watch is 148.18, the Mar 20 low. A break would be bearish.
EURJPY TECHS: Support Remains Intact
- RES 4: 165.43 High Nov 8
- RES 3: 164.90 High Dec 30 ‘24 and a key medium-term resistance
- RES 2: 164.55 High Jan 7
- RES 1: 164.19 High Mar 18 and the bull trigger
- PRICE: 162.44 @ 07:07 GMT Mar 28
- SUP 1: 161.18 20-day EMA
- SUP 2: 160.59 50-day EMA and a pivot support
- SUP 3: 158.90 Low Mar 10
- SUP 4: 158.00 Round number support
A bull theme in EURJPY remains intact and the move down between Mar 18 - 20 appears corrective. This sell-off allowed an overbought condition to unwind. Pivot support to watch is 160.59, the 50-day EMA. A break of this level would signal potential for a deeper retracement. Sights are on resistance at 164.08, the Jan 24 high. It has been pierced, a clear break of it would strengthen a bullish condition and open 164.90, the Dec 30 ‘24 high.
AUDUSD TECHS: Remains Above Support
- RES 4: 0.6429 High Dec 12 ‘24
- RES 3: 0.6414 38.2% retracement of the Sep 30 ‘24 - Feb 3 bear leg
- RES 2: 0.6409 High Feb 21 and a bull trigger
- RES 1: 0.6391 High Mar 17 / 18
- PRICE: 0.9293 @ 07:49 GMT Mar 28
- SUP 1: 0.6258 Low Mar 21
- SUP 2: 0.6187 Low Feb 4
- SUP 3: 0.6171/6088 Low Feb 4 / 3 and a key support
- SUP 4: 0.6045 1.500 proj of the Sep 30 - Nov 6 - 7 price swing
AUDUSD is unchanged. A short-term bull theme is intact and the latest move down appears corrective. Key short-term support to watch is 0.6187, the Mar 4 low. Clearance of this level would reinstate a bear threat. First support is at 0.6258, the Mar 21 low. A stronger recovery would refocus attention on 0.6409, the Feb 21 high. Clearance of this hurdle would strengthen the bull cycle and resume the uptrend that started Feb 3.
USDCAD TECHS: Bullish Outlook
- RES 4: 1.4700 Round number resistance
- RES 3: 1.4641 76.4% retracement of the Feb 3 - 14 bear leg
- RES 2: 1.4452/4543 High Mar 13 / 4 and a bull trigger
- RES 1: 1.4402 High Mar 20
- PRICE: 1.4328 @ 07:52 GMT Mar 28
- SUP 1: 1.4235 Low Mar 26 and a key near-term support
- SUP 2: 1.4151/4107 Low Feb 14 / 50.0% of Sep 25 - Feb 3 bull run
- SUP 3: 1.4011 Low Dec 5 ‘24
- SUP 4: 1.3944 61.8% retracement of the Sep 25 ‘24 - Feb 3 bull cycle
USDCAD traded through support at 1.4242 on Wednesday but has recovered. A return lower and clearance of this level would undermine the bull theme and instead highlight potential for a test of 1.4151, the Feb 14 low and a bear trigger. Moving average studies continue to highlight a dominant uptrend. A reversal higher would refocus attention on the bull trigger at 1.4543, the Mar 4 high. First resistance is 1.4402, the Mar 20 high.
FIXED INCOME
BUND TECHS: (M5) Trades Through The 20-Day EMA
- RES 4: 130.40 Low Feb 19
- RES 3: 129.96 High Mar 5
- RES 2: 129.41 Low Jan 14 and a key short-term resistance
- RES 1: 129.07 Intraday high
- PRICE: 128.91 @ 08:10 GMT Mar 28
- SUP 1: 127.74/126.53 Low Mar 25 / 11 and the bear trigger
- SUP 2: 126.28 2.618 proj of the Feb 5 - 19 - 28 price swing
- SUP 3: 126.00 Round number support
- SUP 4: 123.36 3.00 proj of the Feb 5 - 19 - 28 price swing
Bund futures are trading at their recent highs. For now, the latest move higher appears corrective. The climb has allowed an oversold trend condition to unwind. Price has breached resistance at the 20-day EMA, at 128.63. This exposes a more important resistance at 129.41, the Jan 14 low. First support to watch lies at 127.74, the Mar 25 low. A break of this level would be seen as an early reversal signal. The bear trigger is 126.53, the Mar 11 low.
BOBL TECHS: (M5) Corrective Cycle Remains In Play
- RES 4: 118.090 High Mar 5
- RES 3: 117.974 61.8% retracement of the Feb 28 - Mar 6 sell-off
- RES 2: 117.850 Low Feb 20 and a recent breakout level
- RES 1: 117.720 Intraday high
- PRICE: 117.700 @ 07:20 GMT Mar 28
- SUP 1: 117.080 Low Mar 24
- SUP 2: 116.800 Low Mar 17
- SUP 3: 116.470/250 Low Mar 12 / 6 and the bear trigger
- SUP 4: 116.030 4.00 proj of the minor Feb 28 - Mar 3 - 4 price swing
Bobl futures are trading higher this week and remain in a short-term bull cycle - a correction. The trend condition was recently oversold and the move higher has allowed this set-up to unwind. The primary trend direction remains down. Former support at 117.850, the Feb 20 low, was cleared on March 5, and the subsequent sell-off signals scope for an extension towards 116.000. Firm resistance to watch is seen at 117.850, the Feb 20 low.
SCHATZ TECHS: (M5) Bull Cycle Extends
- RES 4: 107.120 High Mar 4 and key resistance
- RES 3: 107.000 Round number resistance
- RES 2: 106.951 76.4% retracement of the Mar 4 - 6 bear leg
- RES 1: 106.940 Intraday high
- PRICE: 106.925 @ 06:17 GMT Mar 28
- SUP 1: 106.762 20-day EMA
- SUP 2: 106.715 Low Mar 25 and a key short-term support
- SUP 3: 106.630Low Mar 18
- SUP 4: 106.540 Low Mar 12
Schatz futures have traded higher this week and the contract maintains a stronger short-term bullish theme. Price is approaching 106.951, the 76.4% retracement of the Mar 4 - 6 bear leg. A break of this hurdle would strengthen the current bull cycle and expose 107.00 en-route to 107.120, the Mar 4 high. The latter resistance is an important bull trigger. Support to watch lies at 106.715, the Mar 25 low. A break would signal a potential reversal.
GILT TECHS: (M5) Breaches Key Support
- RES 4: 94.00 Round number resistance
- RES 3: 93.79 High Mar 4 and a bull trigger
- RES 2: 93.06 Low Mar 4 and a gap high on the daily chart
- RES 1: 91.82/93.01 20-day EMA / High Mar 20 and a S/T bull trigger
- PRICE: 90.70 @ Close Mar 28
- SUP 1: 90.55 Low Mar 27
- SUP 2: 90.71 Low Mar 6 and a bear trigger
- SUP 3: 90.49 1.618 proj of the Feb 6 - 20 - Mar 4 price swing
- SUP 4: 90.19 1.764 proj of the Feb 6 - 20 - Mar 4 price swing
The short-term trend outlook in Gilt futures remains bearish and Thursday’s move lower reinforces current conditions. The contract has traded below a key short-term support at 90.71, the Mar 6 low. This confirms a resumption of the downtrend and paves the way for a move towards 90.49 next, the 1.618 projection of the Feb 6 - 20 - Mar 4 price swing. Initial resistance to watch is at 91.82, the 20-day EMA.
BTP TECHS: (M5) Corrective Phase
- RES 4: 120.39 High Feb 28
- RES 3: 119.31 Low Mar 4 and a gap high on the daily chart
- RES 2: 118.56 High Mar 5
- RES 1: 117.42/59 20-day EMA / High Mar 27
- PRICE: 117.35 @ Close Mar 27
- SUP 1: 116.54/115.75 Low Mar 18 / 14 and the bear trigger
- SUP 2: 115.52 2.618 proj of the Feb 7 - 19 - 28 price swing
- SUP 3: 115.00 Round number support
- SUP 4: 114.81 3.000 proj of the Feb 7 - 19 - 28 price swing
Recent gains in BTP futures still appear corrective in nature. Note that the trend has recently been in oversold territory and the latest bounce has allowed the condition to unwind. Resistance to watch 117.43, the 20-day EMA. It has been pierced. A clear break of it would open 118.56, the Mar 5 high and a key resistance. A reversal lower and a breach of 115.75, the Mar 14 low, would confirm a continuation of the downtrend.
EQUITIES
EUROSTOXX50 TECHS: (M5) Tests Support At The 50-Day EMA
- RES 4: 5600.00 Round number resistance
- RES 3: 5562.87 0.764 proj of the Feb 3 - Mar 3 - 11 price swing
- RES 2: 5516.00 High Mar 3 and the bull trigger
- RES 1: 5368.91/5471.00 20-day EMA / High Mar 19 / 20
- PRICE: 5311.00 @ 06:23 GMT Mar 28
- SUP 1: 5296.44/5229.00 50-day EMA / Low Mar 11 and a bear trigger
- SUP 2: 5202.00 Low Feb 2
- SUP 3: 5160.00 Low Feb 4
- SUP 4: 5079.00 Low Feb 3 and a key support
The medium-term trend direction in Eurostoxx 50 futures is up and recent short-term weakness - for now - appears corrective. Support to watch is the 50-day EMA, at 5296.44. It has been pierced. A clear break of it would highlight a stronger short-term bear threat and expose 5229.00, the Mar 11 low and a bear trigger. On the upside, the bull trigger is 5516.00, the Mar 3 high. Clearance of this level would resume the uptrend.
E-MINI S&P: (M5) MA Studies Highlight A Dominant Downtrend
- RES 4: 5970.87 61.8% retracement of the Feb 19 - Mar 13 bear leg
- RES 3: 5907.55 50-day EMA
- RES 2: 5864.25 Low Jan 13 and a recent breakout level
- RES 1: 5837.25 High Mar 25
- PRICE: 5723.75 @ 07:24 GMT Mar 28
- SUP 1: 5650.75/5559.75 Low Mar 18 / 13 and the bear trigger
- SUP 2: 5483.50 2.00 proj of the Dec 6 ‘24 - Jan 13 - Feb 19 swing
- SUP 3: 5396.00 2.236 proj of the Dec 6 ‘24 - Jan 13 - Feb 19 swing
- SUP 4: 5341.87 2.382 proj of the Dec 6 ‘24 - Jan 13 - Feb 19 swing
S&P E-Minis have pulled back from Tuesday’s high. The trend condition is bearish and gains since Mar 13 are considered corrective. However, note that the 20-day EMA has recently been breached. A resumption of gains would open 5864.25, the Jan 13 low. Moving average studies are in a bear-mode set-up, highlighting a dominant downtrend. A stronger reversal lower would refocus attention on 5559.75, the Mar 13 low and bear trigger.
COMMODITIES
BRENT TECHS: (K5) Holding On To This Week’s Gains
- RES 4: $79.98 - High Jan 15 and a reversal trigger
- RES 3: $76.78 - High Feb 11 and a bull trigger
- RES 2: $74.76 - High Feb 25
- RES 1: $74.17 - High Mar 26
- PRICE: $73.76 @ 07:05 GMT Mar 28
- SUP 1: $69.90/68.33 - Low Mar 19 / 5 and the bear trigger
- SUP 2: $67.87 - Low Sep 10 ‘24 and a key medium-term support
- SUP 3: $66.36 1.618 proj of the Jan 15 - Feb 4 - 11 price swing
- SUP 4: $63.90 2.000 proj of the Jan 15 - Feb 4 - 11 price swing
Brent futures have traded higher this week and the contract is holding on to its recent highs. For now, short-term gains are considered corrective. However, price has breached the 50-day EMA, at $72.92. The clear break of this average signals scope for a stronger recovery and opens $74.76 next, the Feb 25 high. MA studies remain in a bear-mode position highlighting a dominant downtrend. The bear trigger lies at $68.33, the Mar 5 low.
WTI TECHS: (K5) Corrective Cycle Still In Play
- RES 4: $76.57 - High Jan 15 and the bull trigger
- RES 3: $72.91 - High Feb 11 and key resistance
- RES 2: $70.98 - High Feb 25
- RES 1: $70.22 - High Mar 26
- PRICE: $69.60 @ 07:09 GMT Mar 28
- SUP 1: $66.09/64.85 - Low Mar 19 / 5 and the bear trigger
- SUP 2: $63.73 - Low Sep 10 ‘24 and a key medium-term support
- SUP 3: $60.00 - Psychological round number
- SUP 4: $59.40 - 2.00 proj of the Jan 15 - Feb 4 - 11 price swing
Despite recent gains, a bearish trend condition in WTI futures remains intact, and gains this month are considered corrective. However, a key resistance at $69.17, the 50-day EMA, has been pierced. The breach strengthens a bullish theme and opens $70.98, the Feb 25 high. For bears, a reversal lower would expose the bear trigger at $64.85, the Mar 5 low. Clearance of this level would resume the downtrend and open $63.73, the Oct 10 ‘24 low.
GOLD TECHS: Resumes Its Uptrend
- RES 4: $3151.5 - 3.000 proj of the Nov 14 - Dec 12 - 19 price swing
- RES 3: $3106.8 - 2.764 proj of the Nov 14 - Dec 12 - 19 price swing
- RES 2: $3100.0 - Round number resistance
- RES 1: $3086.0 - Intraday high
- PRICE: $3082.7 @ 07:29 GMT Mar 28
- SUP 1: $2999.5 - Low Mar 18
- SUP 2: $2982.7/2901.1 - 20-day EMA / 50-day EMA
- SUP 3: $2832.7 - Low Feb 28 and key support
- SUP 4: $2758.3 - Low Jan 30
The trend condition in Gold is unchanged, it remains bullish. Today’s strong gains have resulted in a clear breach of $3057.5, the Mar 20 high and a bull trigger. This confirms a resumption of the primary uptrend and also highlights fresh all-time highs for the yellow metal. Sights are on the $3100.0 handle and $3106.8, a Fibonacci projection. Support to watch lies at $2982.7, the 20-day EMA.
SILVER TECHS: Fresh Cycle Highs
- RES 4: $35.736 - 1.236 proj of the Feb 14 - Apr 12 - May 2 ‘24 swing
- RES 3: $34.903 - High Oct 23 ‘24 and the bull trigger
- RES 2: $34.548 - High Oct 29 ‘24
- RES 1: $34.501 - Intraday high
- PRICE: $34.416 @ 08:02 GMT Mar 28
- SUP 1: $33.217 - 20-day EMA
- SUP 2: $32.665 - Low Mar 21
- SUP 3: $32.416/31.814 - 50-day EMA / Low Mar 11
- SUP 4: $30.815 - Low Feb 28 and key support
Bullish conditions in Silver remain intact and this week’s gains reinforce this condition. Yesterday’s rally resulted in a breach of $34.233, the Mar 18 high and a bull trigger. This confirms a resumption of the uptrend and maintains the bullish price sequence of higher highs and higher lows. Sights are on $34.903, the Oct 23 ‘24 high and a medium-term bull trigger. Initial firm support to watch is $33.217, the 20-day EMA.