MNI DAILY TECHNICAL ANALYSIS - Corrective Bear Cycle in EStoxx
Price Signal Summary – Corrective Bear Cycle in Eurostoxx At Play
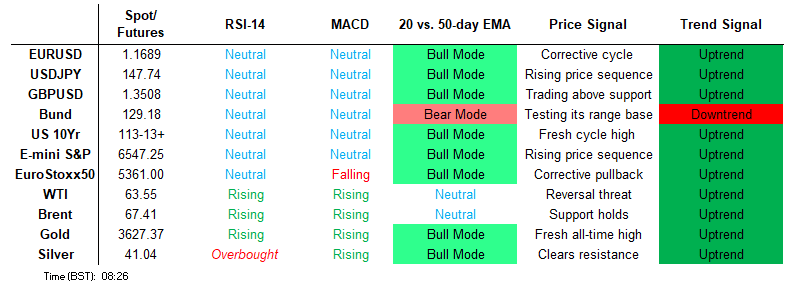
- A bull cycle in S&P E-Minis remains intact and the latest pullback has once again proved to be a shallow correction. The contract traded to a fresh cycle high on Wednesday, breaching the Sep 5 high of 6541.75. A corrective bear cycle in Eurostoxx 50 futures remains in play. Recent weakness resulted in a breach of 5368.81, the 50-day EMA. A clear break of this average strengthens a short-term bearish threat and signals scope for a deeper retracement towards 5166.00.
- GBPUSD is holding on to the bulk of its recent gains. The rally that started Sep 3 has retraced the steep sell-off on Sep 2 and highlights a stronger bullish development. This also suggests the corrective cycle between Aug 14 - Sep 3 is over. USDJPY remains inside its range. Attention is on key short-term support at 146.21, the Aug 14 low and a bear trigger. A break of this level would highlight a stronger bearish threat and highlight a range breakout. A bull cycle in USDCAD remains intact. The recovery from the Aug 29 low highlights a reversal signal and if correct, marks the end of the corrective pullback between Aug 22 - 29.
- Gold remains in a clear bull cycle and continues to trade closer to its recent highs. The yellow metal has traded to a fresh all-time high again this week. The break higher confirms a resumption of the primary uptrend. The trend condition in WTI futures is unchanged - a bear cycle remains intact and short-term gains are considered corrective. The pullback from the Sep 2 high highlights a possible reversal and the end of the corrective phase.
- Recent gains in Bund futures resulted in a break of resistance at 128.87, the Aug 28 high and short-term bull trigger. The climb undermines a recent bearish theme and highlights a stronger reversal. A rally in Gilt futures last week and a bullish start to this week’s session, highlights a stronger corrective cycle. The move higher is allowing an oversold trend condition to unwind.
[GLOBAL] MNI Tech Trend Monitor - Highlighting Key Longer-Term Trends:
MNI Tech Trend Monitor: https://emedia.marketnews.com/marketnewsintl/MNITechTrendMonitor.pdf
We introduce the MNI Tech Trend Monitor - This document highlights a selection of key longer-term trends that we have identified in markets that could be reaching inflection points, trend reversals/extensions or technically significant levels.
Covering:
- UK Gilt 10y Yield
- UK Gilt 30y Yield
- ICE USD Index
- Europe Banking Stock Index (SX7E)
FOREIGN EXCHANGE
EURUSD TECHS: Support Remains Intact
- RES 4: 1.1923 2.00 proj of the Feb 28 - Mar 18 - 247 price swing
- RES 3: 1.1851 High Sep 10 2021
- RES 2: 1.1829 High Jul 01 and the bull trigger
- RES 1: 1.1789 High Jul 24
- PRICE: 1.1694 @ 06:53 BST Sep 11
- SUP 1: 1.1676/31 20-and 50-day EMA values
- SUP 2: 1.1574 Low Aug 27
- SUP 3: 1.1528 Low Aug 5
- SUP 4: 1.1392 Low Aug 1 and bear trigger.
The trend theme in EURUSD is unchanged, it remains bullish. Resistance at 1.1743, the Aug 22 high, has recently been cleared reinforcing a bull cycle. This signals scope for an extension towards 1.1829, the Jul 01 high and bull trigger. Clearance of this hurdle would confirm a resumption of the primary uptrend. Support to watch is around the 50-day EMA, at 1.1631. A clear breach of this average would signal scope for a deeper retracement.
GBPUSD TECHS: Bull Trigger Remains Exposed
- RES 4: 1.3681 High Jul 4
- RES 3: 1.3636 76.4% retracement of the Jul 1 - Aug1 downleg
- RES 2: 1.3595 High Aug 14 and a bull trigger
- RES 1: 1.3590 High Sep 9
- PRICE: 1.3515 @ 06:58 BST Sep 11
- SUP 1: 1.3468/3333 50-day EMA / Low Sep 3
- SUP 2: 1.3315 61.8% retracement of the Aug 1 - 14 bull leg
- SUP 3: 1.3249 76.4% retracement of the Aug 1 - 14 bull leg
- SUP 4: 1.3142 Low Aug 1 and a key support
GBPUSD is holding on to the bulk of its recent gains. The rally that started Sep 3 has retraced the steep sell-off on Sep 2 and highlights a stronger bullish development. This also suggests the corrective cycle between Aug 14 - Sep 3 is over. Sights are on resistance at 1.3595, the Aug 14 high and a bull trigger. A break would strengthen a bullish condition. Initial support to watch is 1.3468, the 50-day EMA.
EURGBP TECHS: Corrective Pullback Extends
- RES 4: 0.8769 High Jul 28 and the bull trigger
- RES 3: 0.8744 High Aug 7
- RES 2: 0.8728 76.4% retracement of the Jul 28 - Aug 14 bear leg
- RES 1: 0.8713 High Sep 2
- PRICE: 0.8653 @ 16:30 BST Sep 10
- SUP 1: 0.8636/8597 50-day EMA / Low Aug 14 and the bear trigger
- SUP 2: 0.8562 50.0% retracement May 29 - Jul 28 upleg
- SUP 3: 0.8540 Low Jun 30
- SUP 4: 0.8514 61.8% retracement May 29 - Jul 28 upleg
EURGBP remains in a short-term corrective bear cycle. The move down is considered corrective - for now - and support to watch lies at 0.8597, the Aug 14 low. Clearance of this level would reinstate a recent bearish threat. A resumption of gains would open 0.8744, the Aug 7 high. Key resistance and the bull trigger is at 0.8769, the Jul 28 high. Note that moving average studies are in a bull-mode position highlighting a dominant uptrend.
USDJPY TECHS: Trading Above Support
- RES 4: 151.62 61.8% retracement of the Jan 10 - Apr 22 bear leg
- RES 3: 150.92 High Aug 1 and a key resistance
- RES 2: 149.81 76.4% retracement of the Aug 1 - 14 bear leg
- RES 1: 148.58/149.14 High Sep 8 / High Sep 3
- PRICE: 147.74 @ 07:36 BST Sep 11
- SUP 1: 146.21 Low Aug 14
- SUP 2: 145.86 Low Jul 24
- SUP 3: 145.53 Trendline drawn from the Apr 22 low
- SUP 4: 145.40 50% retracement of the Apr - Aug upleg
USDJPY remains inside its range. Attention is on key short-term support at 146.21, the Aug 14 low and a bear trigger. A break of this level would highlight a stronger bearish threat and highlight a range breakout. This would expose 145.40, a Fibonacci retracement. On the upside, clearance of 149.14, the Sep 3 high is required to reinstate a bullish theme. Moving average studies are in a bull-mode position, highlighting a dominant uptrend.
EURJPY TECHS: MA Studies Continue To Highlight An Uptrend
- RES 4: 177.08 2.000 proj of the Feb 28 - Mar 18 - Apr 7 price swing
- RES 3: 175.43 High Jul 11 ‘24 and a key medium-term resistance
- RES 2: 174.86 1.764 proj of the Feb 28 - Mar 18 - Apr 7 price swing
- RES 1: 173.97 High Jul 28 and the bull trigger
- PRICE: 172.71 @ 07:53 BST Sep 11
- SUP 1: 171.25 50-day EMA
- SUP 2: 169.73/45 Low Jul 31 / 23.6% of the Feb 28 - Jul 28 bull leg
- SUP 3: 168.46 Low Jul 1
- SUP 4: 167.46 Low Jun 23
The trend set-up in EURJPY remains bullish and sights are on key resistance and the bull trigger at 173.97, the Jul 28 high. Clearance of this level would confirm a continuation of the bull phase. Moving average studies are in a bull-mode position too, highlighting a primary uptrend. A break of 173.97 would open 174.86, a Fibonacci projection. Key support to watch lies at the 50-day EMA at 171.25.
AUDUSD TECHS: Pierces The Bull Trigger
- RES 4: 0.6688 High Nov 7 ‘24
- RES 3: 0.6677 0.764 proj of the Jun 23 - Jul 11 - 17 price swing
- RES 2: 0.6663 3.0% Upper Bollinger Band
- RES 1: 0.6636 High Sep 10
- PRICE: 0.6612 @ 08:00 BST Sep 11
- SUP 1: 0.6515 50-day EMA
- SUP 2: 0.6463/6415 Low Aug 27 / Low Aug 21 / 22 and a bear trigger
- SUP 3: 0.6373 Low Jun 23
- SUP 4: 0.6354 38.2% retracement of the Apr 9 - Jul 24 upleg
AUDUSD bulls remain in the driver’s seat and yesterday’s gains resulted in a print above resistance at 0.6625, the Jul 24 high and a bull trigger. A clear breach of this level would confirm a resumption of the uptrend and open 0.6677, a Fibonacci projection. Moving average studies are in a bull-mode position highlighting a dominant uptrend. Key support to watch is 0.6415, the Aug 21 / 22 low. A clear break of it would highlight a stronger reversal.
USDCAD TECHS: Approaching The Bull Trigger
- RES 4: 1.4111 High Apr 10
- RES 3: 1.4019 38.2% retracement of the Feb 3 - Jun 16 bear leg
- RES 2: 1.3925 High Aug 22 and the bull trigger
- RES 1: 1.3880 Intraday high
- PRICE: 1.3874 @ 08:03 BST Sep 11
- SUP 1: 1.3786/27 50-day EMA / Low Aug 27 and a bear trigger
- SUP 2: 1.3709 61.8% retracement of the Jul 23 - Aug 22 bull cycle
- SUP 3: 1.3658 76.4% retracement of the Jul 23 - Aug 22 bull cycle
- SUP 4: 1.3637 Low Jul 25
A bull cycle in USDCAD remains intact. The recovery from the Aug 29 low highlights a reversal signal and if correct, marks the end of the corrective pullback between Aug 22 - 29. A continuation higher would open the bull trigger at 1.3925, the Aug 22 high. Support lies at 1.3727, the Aug 29 low. Clearance of this level would instead reinstate a short-term bear theme and expose 1.3709 initially, a Fibonacci retracement.
FIXED INCOME
BUND TECHS: (Z5) Bull Cycle Remains Intact
- RES 4: 130.27 High Jun 20
- RES 3: 130.05 76.4% retracement of the Jun 13 - Sep 3 bear cycle
- RES 2: 129.66 High Jul 22
- RES 1: 129.50 High Aug 5 and a key resistance
- PRICE: 129.18 @ 07:11 BST Sep 11
- SUP 1: 128.63/25 20-day EMA / Low Sep 4
- SUP 2: 127.61 Low Sep 3 and the bear trigger
- SUP 3: 127.46 1.00 proj of the Aug 14 - 15 - 28 price swing
- SUP 4: 127.13 1.236 proj of the Aug 14 - 15 - 28 price swing
Recent gains in Bund futures resulted in a break of resistance at 128.87, the Aug 28 high and short-term bull trigger. The climb undermines a recent bearish theme and highlights a stronger reversal. Price has moved through the 129.00 handle, signalling scope for an extension towards 129.50, the Aug 5 high. Key support and the bear trigger has been defined at 127.61, the Sep 3 low. First support is 128.63, the 20-day EMA.
BOBL TECHS: (Z5) Recovery Intact
- RES 4: 118.635 1.500 proj of the Aug 25 - 28 - Sep 2 price swing
- RES 3: 118.561 1.382 proj of the Aug 25 - 28 - Sep 2 price swing
- RES 2: 118.469 1.236 proj of the Aug 25 - 28 - Sep 2 price swing
- RES 1: 118.400 High Sep 8
- PRICE: 118.250 @ 06:41 BST Sep 11
- SUP 1: 117.920 Low Sep 4
- SUP 2: 117.690 Low Sep 2
- SUP 3: 117.630 Low Aug 25 and a key short-term support
- SUP 4: 117.481 123.6% retracement projection of Aug 25 - 28 rally
Bobl futures are holding on to the bulk of their recent gains. The contract has breached resistance at 118.260, the Aug 28 high. A breach of this level undermines the recent bearish theme and signals scope for a stronger recovery towards 118.469, a Fibonacci projection. On the downside, initial support to watch lies at 117.920, the Sep 4 low. Clearance of this level would highlight a reversal and instead expose 117.690, the Sep 2 low.
SCHATZ TECHS: (Z5) Resistance Is Intact For Now
- RES 4: 107.360 High Jul 22 and 23 (cont)
- RES 3: 107.240 High Aug 4
- RES 2: 107.225 High Aug 27 and the bull trigger
- RES 1: 107.190 High Sep 5 and 8
- PRICE: 107.110 @ 06:45 BST Sep 11
- SUP 1: 107.050 Low Aug 25 and Sep 2 and a bear trigger
- SUP 2: 107.000 Round number support
- SUP 3: 106.983 138.2% retracement proj of the Aug 25 - 27 rally
- SUP 4: 106.963 150.0% retracement proj of the Aug 25 - 27 rally
The trend structure in Schatz futures remains bearish and - for now - recent short-term gains still appear corrective. Attention is on the next important support at 107.050, the Aug 25 and Sep 2 low. A break of this level would confirm a resumption of the downtrend and open the 107.00 handle. Key short-term resistance to watch is 107.225, the Aug 27 high. Clearance of this hurdle would highlight a stronger bullish theme and signal a stronger reversal.
GILT TECHS: (Z5) Corrective Cycle Intact
- RES 4: 92.30 High Aug 7
- RES 3: 92.06 High Aug 14
- RES 2: 92.00 Round number resistance
- RES 1: 91.66 High Sep 9
- PRICE: 91.33 @ Close Sep 10
- SUP 1: 90.65 Low Sep 2
- SUP 2: 90.31/89.36 Low Sep 4 / 3
- SUP 3: 89.22 1.618 proj of the Aug 21 - 27 - 28 price swing
- SUP 4: 89.00 Round number support
A rally in Gilt futures last week and a bullish start to this week’s session, highlights a stronger corrective cycle. The move higher is allowing an oversold trend condition to unwind. The contract has breached initial firm resistance at 90.84, the Aug 28 and 29 high. A continuation higher would open 92.06, the Aug 14 high. On the downside, initial support lies at 90.65, the Sep 5 low.
BTP TECHS: (Z5) Monitoring Resistance
- RES 4: 121.00 Round number resistance
- RES 3: 120.74 High Aug 5 and the bull trigger
- RES 2: 120.61 High Aug 14
- RES 1: 120.51 High Sep 10
- PRICE: 120.33 @ Close Sep 10
- SUP 1: 119.06/118.36 Low Sep 4 / 3
- SUP 2: 118.00 Round number support
- SUP 3: 117.70 2.236 proj of the Aug 5 - 12 - 14 price swing
- SUP 4: 117.36 2.500 proj of the Aug 5 - 12 - 14 price swing
The primary trend condition in BTP futures is unchanged, it remains bullish. The strong rally from last week’s low highlights a bullish development and signals the end of the recent corrective pullback between Aug 5 - Sep 3. Key resistance and the bull trigger is 120.74, the Aug 5 high. A break of this hurdle would confirm a resumption of the uptrend. Key support has been defined at 118.36, the Sep 3 low.
EQUITIES
EUROSTOXX50 TECHS: (U5) Bear Threat Still Present
- RES 4: 5568.00 High Mar 6
- RES 3: 5526.00 High Mar 19 / 20 (cont)
- RES 2: 5445.00/5522.00 High Aug 26 / 22
- RES 1: 5417.00 High Sep 10
- PRICE: 5363.00 @ 07:14 BST Sep 11
- SUP 1: 5292.00 Low Sep 2
- SUP 2: 5280.00 Low Aug 7
- SUP 3: 5250.02 76.4% retracement of the Aug 1 - 22 rally
- SUP 4: 5166.00 Low Aug 1 and key support
A corrective bear cycle in Eurostoxx 50 futures remains in play. Recent weakness resulted in a breach of 5368.81, the 50-day EMA. A clear break of this average strengthens a short-term bearish threat and signals scope for a deeper retracement towards 5166.00, the Aug 1 low and a key support. On the upside, the contract has recovered above the 20-day EMA - a bullish development. A stronger reversal would open 5445.00, the Aug 26 high.
E-MINI S&P: (U5) Fresh Cycle High
- RES 4: 6673.37 2.236 proj of the May 23 - Jun 11 - 23 price swing
- RES 3: 6623.57 2.0% 10-dma envelope
- RES 2: 6600.00 Round number resistance
- RES 1: 6565.25 High Sep 10
- PRICE: 6543.00@ 07:22 BST Sep 11
- SUP 1: 6469.93 20-day EMA
- SUP 2: 6372.16 50-day EMA
- SUP 3: 6313.25 Low Aug 6
- SUP 4: 6239.50 Low Aug 1 and a key support
A bull cycle in S&P E-Minis remains intact and the latest pullback has once again proved to be a shallow correction. The contract traded to a fresh cycle high on Wednesday, breaching the Sep 5 high of 6541.75. This confirms a resumption of the uptrend and maintains the price sequence of higher highs and higher lows. Sights are on the 6600.00 handle next. Initial support to watch is 6469.93, the 20-day EMA.
COMMODITIES
BRENT TECHS: (X5) Gains Considered Corrective
- RES 4: $79.16 - 2.618 proj of the Apr 9 - 23 - May 5 price swing
- RES 3: $77.28 - 2.382 proj of the Apr 9 - 23 - May 5 price swing
- RES 2: $76.39 - High Jun 23 and a bull trigger
- RES 1: $69.53/71.93 - High Sep 2 / High Jul 30 and a key resistance
- PRICE: $67.37 @ 07:08 BST Sep 11
- SUP 1: $64.50 - Low Jun 30 and a key short-term support
- SUP 2: $60.82 - Low May 30
- SUP 3: $58.37 - Low May 5
- SUP 4: $57.81 - Low Apr 9 and a key support
Brent futures have recovered from their most recent lows. Short-term gains are for now, considered corrective and a bear cycle remains intact. A resumption of weakness would refocus attention on $64.50, the Jun 30 low, where a clear break would confirm a continuation of the bear leg. This would open $60.82, the May 30 low. Key short-term resistance has been defined at $71.93, the Jul 30 high. Clearance of this level would cancel a bear theme.
WTI TECHS: (V5) Still Looking For Weakness
- RES 4: $77.85 - 2.794 proj of the Apr 9 - 23 - May 5 price swing
- RES 3: $75.65 - 2.500 proj of the Apr 9 - 23 - May 5 price swing
- RES 2: $74.25 - High Jun 23 and a bull trigger
- RES 1: $66.03/69.36 - High Sep2 / High Jul 30 and key resistance
- PRICE: $63.58 @ 07:11 BST Sep 11
- SUP 1: $61.29 - Low Aug 13 and the bear trigger
- SUP 2: $57.71 - Low May 30
- SUP 3: $54.80 - Low May 5
- SUP 4: $54.03 - Low Apr 9 and a key support
The trend condition in WTI futures is unchanged - a bear cycle remains intact and short-term gains are considered corrective. The pullback from the Sep 2 high highlights a possible reversal and the end of the corrective phase. Initial resistance to watch is $66.03, the Sep 2 high. Key short-term resistance has been defined at $69.36, the Jul 30 high. A stronger resumption of weakness would pave the way for a move towards $57.71, the May 30 low.
GOLD TECHS: Bulls Remain In The Driver’s Seat
- RES 4: $3716.5 - 2.500 proj of the Dec 30 ’24 - Apr 3 - 7 price swing
- RES 3: $3700.0 - Round number resistance
- RES 2: $3674.8 - 2.382 proj of the Dec 30 ’24 - Apr 3 - 7 price swing
- RES 1: $3674.3 - High Sep 9
- PRICE: $3632.2 @ 07:25 BST Sep 11
- SUP 1: $3579.7 - Low Sep 8
- SUP 2: $3490.5 - 20-day EMA
- SUP 3: $3412.2 - 50-day EMA
- SUP 4: $3311.6 - Low Aug 20
Gold remains in a clear bull cycle and continues to trade closer to its recent highs. The yellow metal has traded to a fresh all-time high again this week. The break higher confirms a resumption of the primary uptrend and an extension of the sequence of higher highs and higher lows. The next objective is $3674.8, a Fibonacci projection. Initial firm support lies at $3474.7, the 20-day EMA.
SILVER TECHS: Trend Needle Points North
- RES 4: $42.606 - 2.236 proj of the Jul 31 - Aug 14 - 20 price swing
- RES 3: $42.323 - 1.764 proj of the Apr 7 - 25 - May 15 swing
- RES 2: $42.000 - Round number resistance
- RES 1: $41.671 - High Sep 8
- PRICE: $41.040 @ 08:05 BST Sep 11
- SUP 1: $39.820 - 20-day EMA
- SUP 2: $38.484 - 50-day EMA
- SUP 3: $36.216 - Low Jul 31 and a key support
- SUP 4: $35.285 - Low Jun 24
Trend signals in Silver remain bullish and the metal is trading closer to its recent highs. Resistance at $39.530, the Jul 23 high, has been cleared. This confirms a resumption of the uptrend and maintains the price sequence of higher highs and higher lows. Moving average studies are in a bull-mode position, reinforcing current trend conditions. Sights are on the $42.00 handle next. Initial support to watch is $39.820, the 20-day EMA.