MNI DAILY TECHNICAL ANALYSIS - Bunds Break Support
Price Signal Summary – Bunds Break Support
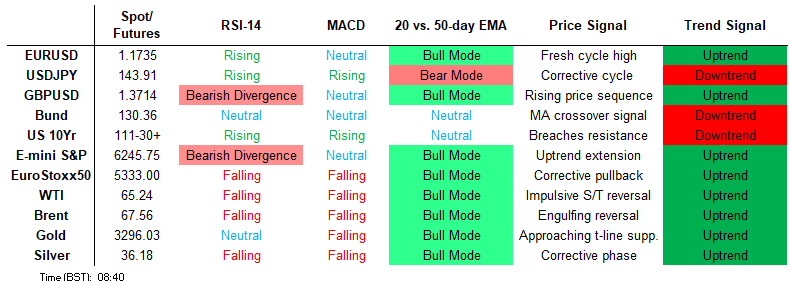
- The trend condition in S&P E-Minis is unchanged, it remains bullish and the contract has started this week on a firm note. Short-term resistance and a bull trigger at 6128.75, the Jun 11 high, has recently been breached. Trend signals in Eurostoxx 50 futures remain bearish, however, the recovery from last Monday’s low appears to be a reversal and the contract is holding on to its most recent gains.
- The trend needle in GBPUSD continues to point north and last week’s climb reinforces bullish conditions. Fresh cycle peaks maintain the price sequence of higher highs and higher lows. A bear threat in USDJPY remains present. The Jun 23 shooting star candle formation highlights a reversal of the recent recovery and price has traded through the 20- and 50-day EMAs. USDCAD is trading below its recent highs. The primary downtrend remains intact and short-term gains between Jun 16 - 23 appear to have been corrective. Key support and the bear trigger has been defined at 1.3540, the Jun 16 low.
- Gold traded lower Friday as the yellow metal extended the pullback from $3451.3, the Jun 16 high. Two key S/T levels have been breached; $3290.3, the 50-day EMA, and 3300.3, a trendline drawn from the Dec 30 ‘24 low. WTI futures maintain a softer tone following the reversal from last Monday’s high. Support to watch is at the 50-day EMA, at $64.58. It has been pierced, a clear break of it would signal scope for a deeper retracement.
- Bund futures traded lower Friday, resulting in a print below key short-term support at 130.12, the Jun 5 low. A clear break of this price point would highlight a bearish threat and undermine the recent bullish theme. A bullish condition in Gilt futures remains intact and recent weakness appears to have been a correction. Last week’s gains reinforce the current bullish theme. Key short-term support has been defined 92.23, the Jun 16 low.
FOREIGN EXCHANGE
EURUSD TECHS: Bulls Remain In The Driver’s Seat
- RES 4: 1.1923 2.000 proj of the Feb 28 - Mar 18 - 27 price swing
- RES 3: 1.1821 High Sep 16 2021
- RES 2: 1.1783 1.764 proj of the Feb 28 - Mar 18 - 27 price swing
- RES 1: 1.1753 High Jun 27
- PRICE: 1.1735 @ 06:14 BST Jun 30
- SUP 1: 1.1631 High Jun 12 and a recent breakout level
- SUP 2: 1.1529 20-day EMA
- SUP 3: 1.1446 Low Jun 19
- SUP 4: 1.1373 50-day EMA
The trend set-up in EURUSD remains bullish and last week’s gains reinforce the uptrend. Resistance and a bull trigger at 1.1631, the Jun 12 high, has been cleared. This confirms a resumption of the trend and sights are on 1.1783, a Fibonacci projection. Key short-term support to watch lies at 1.1529, the 20-day EMA. A clear break of this average is required to signal scope for a deeper retracement.
GBPUSD TECHS: Bullish Price Sequence
- RES 4: 1.3852 1.764 proj of the Feb 28 - Apr 3 - 7 price swing
- RES 3: 1.3835 High Oct 20 2021
- RES 2: 1.3800 Round number resistance
- RES 1: 1.3771 High Jun 26
- PRICE: 1.3738 @ 06:25 BST Jun 30
- SUP 1: 1.3632/3552 High Jun 13 / 20-day EMA
- SUP 2: 1.3414 50-day EMA
- SUP 3: 1.3318 Trendline support drawn from the Jan 13 low
- SUP 4: 1.3140 Low May 12 and key support
The trend needle in GBPUSD continues to point north and last week’s climb reinforces bullish conditions. Fresh cycle peaks maintain the price sequence of higher highs and higher lows. Note too that moving average studies are in a bull-mode position, highlighting a dominant medium-term uptrend. Sights are on 1.3800 next. Initial support to watch lies at 1.3552, the 20-day EMA. A break would signal scope for a corrective pullback.
EURGBP TECHS: Bullish Trend Condition
- RES 4: 0.8648 76.4% retracement of the Apr 11 - May 29 downleg
- RES 3: 0.8624 High Apr 21
- RES 2: 0.8592 61.8% retracement of the Apr 11 - May 29 downleg
- RES 1: 0.8575 High Jun 23
- PRICE: 0.8544 @ 06:45 BST Jun 30
- SUP 1: 0.8507/8478 20- and 50-day EMA values
- SUP 2: 0.8459 Low Jun 11
- SUP 3: 0.8407 Low Jun 4
- SUP 4: 0.8356 Low May 29 and the bear trigger
The trend condition in EURGBP remains bullish and the cross is trading closer to its recent highs. Moving average studies have recently crossed and are currently in a bull-mode position - this reinforces the current uptrend. Scope is seen for a test of 0.8592 next, a Fibonacci retracement. On the downside, support to watch lies at 0.8478, the 50-day EMA. Clearance of this level would highlight a possible reversal.
USDJPY TECHS: Bearish Threat
- RES 4: 150.49 High Apr 2
- RES 3: 149.28 High Apr 3
- RES 2: 148.65 High May 12 and a reversal trigger
- RES 1: 146.19/148.03 High Jun 24 / 23
- PRICE: 143.91 @ 07:02 BST Jun 30
- SUP 1: 143.75 Low Jun 26
- SUP 2: 142.80 Low Jun 13
- SUP 3: 142.12 Low May 27 and a key short-term support
- SUP 4: 141.96 76.4% retracement of the Apr 22 - May 12 upleg
A bear threat in USDJPY remains present. The Jun 23 shooting star candle formation highlights a reversal of the recent recovery and price has traded through the 20- and 50-day EMAs. A clear break of the averages would strengthen a bearish threat and signal scope for an extension towards 142.12, the May 27 low and a key short-term support. On the upside, a move above 148.03, the Jun 23 high, would reinstate a bullish theme.
EURJPY TECHS: Support Remains Intact
- RES 4: 171.09 High Jul 23 ‘24
- RES 3: 170.47 76.4% Fibonacci retracement for Jul - Aug ‘24 downleg
- RES 2: 169.91 1.236 proj of the Feb 28 - Mar 18 - Apr 7 price swing
- RES 1: 169.81 High Jun 27
- PRICE: 168.98 @ 07:59 BST Jun 30
- SUP 1: 167.92 Low Jun 24
- SUP 2: 166.94 20-day EMA
- SUP 3: 165.91 Low Jun 16
- SUP 4: 164.95 50-day EMA
The trend set-up in EURJPY is unchanged, it remains bullish. Recent gains have resulted in a break of 166.69, the Oct 31 ‘24 high. Scope is seen for a climb towards 170.47, a key Fibonacci retracement point. Note that the uptrend is in overbought territory, a pullback would unwind this condition. Support to watch lies at 166.94, the 20-day EMA. Clearance of this EMA would suggest potential for a deeper retracement.
AUDUSD TECHS: Trend Structure Remains Bullish
- RES 4: 0.6700 76.4% retracement of the Sep 30 ‘24 - Apr 9 bear leg
- RES 3: 0.6688 High Nov 7 ‘24
- RES 2: 0.6603 High Nov 11 ‘24
- RES 1: 0.6564 High June 26
- PRICE: 0.6539 @ 08:110 BST Jun 30
- SUP 1: 0.6492 20-day EMA
- SUP 2: 0.6454/6373 Low Jun 24 / 23 and a reversal trigger
- SUP 3: 0.6357 Low May 12
- SUP 4: 0.6275 Low Apr 14
The medium-term trend set-up in AUDUSD remains bullish. Strong gains last week reinforces a bull theme and confirms the end of the latest corrective pullback. Sights are on key resistance and the bull trigger, at 0.6552, the Jun 16 high. This level has been pierced, a clear break would confirm a resumption of the trend and open 0.6603, the Nov 11 2024 high. Key short-term support has been defined at 0.6373, the Jun 23 low.
USDCAD TECHS: Pivot Resistance Remains Intact
- RES 4: 1.4111 High Apr 4
- RES 3: 1.4016 High May 12 and 13 and a key resistance
- RES 2: 1.3920 High May 21
- RES 1: 1.3806 50-day EMA
- PRICE: 1.3654 @ 08:14 BST Jun 30
- SUP 1: 1.3618 Low Jun 26
- SUP 2: 1.3540 Low Jun 16 and the bear trigger
- SUP 3: 1.3503 1.618 proj of the Feb 3 - 14 - Mar 4 price swing
- SUP 4: 1.3473 Low Oct 2 2024
USDCAD is trading below its recent highs. The primary downtrend remains intact and short-term gains between Jun 16 - 23 appear to have been corrective. Key support and the bear trigger has been defined at 1.3540, the Jun 16 low. Clearance of this price point would resume the downtrend. Any reversal higher would instead signal scope for a stronger retracement. Pivot resistance to monitor is at the 50-day EMA, at 1.3806.
FIXED INCOME
BUND TECHS: (U5) Pierces Support
- RES 4: 132.42 2.000 proj of the May 14 - 20 - 22 price swing
- RES 3: 132.00 Round number resistance
- RES 2: 131.95 High Jun 13 and the bull trigger
- RES 1: 130.68/131.33 20-day EMA / High Jun 20
- PRICE: 130.21 @ 05:53 BST Jun 30
- SUP 1: 130.05 Low Jun 27
- SUP 2: 129.67 76.4% retracement of the May 14 - Jun 13 bull leg
- SUP 3: 129.30 Low May 22
- SUP 4: 128.97 Low May 14 and a reversal trigger
Bund futures traded lower Friday, resulting in a print below key short-term support at 130.12, the Jun 5 low. A clear break of this price point would highlight a bearish threat, undermine the recent bullish theme, and signal scope for an extension towards 129.30, the May 22 low. Key resistance has been defined at 131.95, the Jun 13 high. Clearance of this level would reinstate a bullish theme.
BOBL TECHS: (U5) Monitoring Support
- RES 4: 118.649 1.382 proj of the May 21 - Jun 3 - Jun 5 swing
- RES 3: 118.531 1.236 proj of the May 21 - Jun 3 - Jun 5 swing
- RES 2: 118.390 High Jun 13 and a bull trigger
- RES 1: 118.065 61.8% retracement of the Jun 13 - 16 downleg
- PRICE: 117.680 @ 06:02 BST Jun 30
- SUP 1: 117.530 Low Jun 5 and a key near-term support
- SUP 2: 117.470 Low May 21
- SUP 3: 117.470 Low May 21
- SUP 4: 116.660 Low Mar 27
Bobl futures are trading in a range. A bull cycle remains intact, however, the latest pullback has exposed key short-term support at 117.530, the Jun 5 low. A break of this level would highlight a stronger reversal and cancel the bull theme. This would open 117.470, the May 21 low. Key short-term resistance has been defined at 118.390, the Jun 13 high. Clearance of this level would be a bullish development.
SCHATZ TECHS: (U5) Support Remains Intact For Now
- RES 4: 107.690 High Apr 30
- RES 3: 107.610 High May 23 and a key near-term resistance
- RES 2: 107.430/475 High Jun 13 / High May 27
- RES 1: 107.335 High Jun 26
- PRICE: 107.245 @ 06:13 BST Jun 30
- SUP 1: 107.195/180 Low Jun 6 / 23
- SUP 2: 107.125 Low May 12 and a key support
- SUP 3: 107.000 Round number support
- SUP 4: 106.890 2.000 proj of the May 23 - 29 - 30 price swing
Schatz futures traded lower Friday but for now, remain inside a range and price is trading below the Jun 13 high. Support to watch is 107.195, the Jun 6 low. It has been pierced, a clear break of itl would reinstate a bearish threat and signal scope for an extension towards 107.125, the May 12 low. On the upside, clearance of 107.470, the May 30 high, is required to strengthen a bullish condition. Initial firm resistance is 107.430, the Jun 13 high.
GILT TECHS: (U5) Bull Cycle Intact For Now
- RES 4: 94.15 2.000 proj of the May 22 - 27 - 29 price swing
- RES 3: 94.00 Round number resistance
- RES 2: 93.73 1.764 proj of the May 22 - 27 - 29 price swing
- RES 1: 93.57/93.68 High Jun 25 / 13
- PRICE: 92.93 @ Close Jun 27
- SUP 1: 92.67 20-day EMA
- SUP 2: 92.23 Low Jun 16 and a key short-term support
- SUP 3: 91.56 Low Jun 9
- SUP 4: 91.44 Low Jun 8
A bullish condition in Gilt futures remains intact and recent weakness appears to have been a correction. Last week’s gains reinforce the current bullish theme. Key short-term support has been defined 92.23, the Jun 16 low. A break of this level is required to undermine a bull theme and signal scope for a deeper retracement. On the upside, sights are on 93.68, the Jun 13 high and bull trigger.
BTP TECHS: (U5) Trading Above Support
- RES 4: 122.71 2.764proj of the May 14 - 20 - 21 price swing
- RES 3: 122.35 2.500 proj of the May 14 - 20 - 21 price swing
- RES 2: 122.00 Round number resistance
- RES 1: 121.73 High Jun 13 and the bull trigger
- PRICE: 120.81 @ Close Jun 30
- SUP 1: 119.91 Low May 29
- SUP 2: 119.48 Low May 26
- SUP 3: 118.87 Low May 21
- SUP 4: 118.51 Low May 14 and key support
The trend condition in BTP futures remains bullish and recent weakness appears corrective. Gains earlier this month reinforce a bull theme and maintain the price sequence of higher highs and higher lows. Sights are on the 122.00 handle next. Key support to watch is unchanged at 118.51, the May 14 low. A clear break of this level would highlight a reversal. First support is 119.91, the May 29 low.
EQUITIES
EUROSTOXX50 TECHS: (U5) Potential Reversal Signal
- RES 4: 5486.00 High May 20 and a key bull trigger
- RES 3: 5456.00 High Jun 11
- RES 2: 5403.00 High Jun 12
- RES 1: 5365.00 Intraday high
- PRICE: 5352.00 @ 06:37 BST Jun 30
- SUP 1: 5194.00 Low Jun 23 and a bear trigger
- SUP 2: 5182.00 Low May 2
- SUP 3: 5100.94 38.2% retracement of the Apr 7 - May 20 bull leg
- SUP 4: 5078.00 Low Apr 30
Trend signals in Eurostoxx 50 futures remain bearish, however, the recovery from last Monday’s low appears to be a reversal and the contract is holding on to its most recent gains. Price has traded through the 20- and 50-day EMAs. A clear break of both averages would strengthen a reversal theme. This would open 5486.00, the May 20 high and bull trigger. On the downside, a breach of 5194.00, the Jun 23 low would reinstate a bearish theme.
E-MINI S&P: (U5) Bulls Remain In The Driver’s Seat
- RES 4: 6300.00 Round number resistance
- RES 3: 6281.12 1.618 proj of the Apr 7 - 10 - 21 price swing
- RES 2: 6277.50 High Feb 19 and a bull trigger
- RES 1: 6255.00 Intraday high
- PRICE: 6254.25 @ 07:21 BST Jun 30
- SUP 1: 6069.53/5952.84 20- and 50-day EMA values
- SUP 2: 5811.50 Low May 23
- SUP 3: 5645.75 Low May 7
- SUP 4: 5500.00 Low Apr 30
The trend condition in S&P E-Minis is unchanged, it remains bullish and the contract has started this week on a firm note. Short-term resistance and a bull trigger at 6128.75, the Jun 11 high, has recently been breached. The clear break confirms a resumption of the uptrend that started Apr 7. The 6200.00 handle has been cleared too, this opens 6277.50, Feb 21 high and bull trigger. Key support is at the 50-day EMA - at 5952.84.
COMMODITIES
BRENT TECHS: (U5) Maintains A Bearish Tone
- RES 4: $85.00 - Round number resistance
- RES 3: $81.99 - 2.764 proj of the Apr 9 - 23 - May 5 price swing
- RES 2: $80.72 - 2.618 proj of the Apr 9 - 23 - May 5 price swing
- RES 1: $72.66/79.40 - 50.0% of the Jun 23-30 range / High Jun 23
- PRICE: $66.75 @ 07:09 BST Jun 30
- SUP 1: $65.92 - Intraday low
- SUP 2: $61.39 - Low May 30
- SUP 3: $58.00 - Low May 5
- SUP 4: $57.70 - Low Apr 9 and a key support
Brent futures traded sharply lower on Jun 23, and for now, the contract maintains a softer tone. The move down has resulted in a breach of the 50-day EMA and note too that $66.17, the 61.8% retracement of the May 5 - Jun 23 bull leg, has been pierced. A continuation lower would expose $61.39 next, the May 30 low. Initial resistance to watch is $72.66, a Fibonacci retracement point.
WTI TECHS: (Q5) Support At The 50-Day EMA Has Been Pierced
- RES 4: $82.62 - 3.000 proj of the Apr 9 - 23 - May 5 price swing
- RES 3: $80.43 - 2.764 proj of the Apr 9 - 23 - May 5 price swing
- RES 2: $80.00 - Psychological round number
- RES 1: $71.20/78.40 - 50.0% of the Jun 23-24 range / High Jun 23
- PRICE: $65.21 @ 07:17 BST Jun 30
- SUP 1: $64.58/00 - 50-day EMA / Low Jun 24
- SUP 2: $58.87 - Low May 30
- SUP 3: $54.81 - Low May 5
- SUP 4: $54.13 - Low Apr 9 and a key support
WTI futures maintain a softer tone following the reversal from last Monday’s high. Support to watch is at the 50-day EMA, at $64.58. It has been pierced, a clear break of it would signal scope for a deeper retracement. This would expose $58.87, the May 30 low. On the upside, initial resistance to watch is $71.20, the 50.0% retracement of the Jun 23 - 24 high-low range. Key resistance is at $78.40, the Jun 23 high.
GOLD TECHS: Breaches Short-Term Support
- RES 4: $3578.0 - 2.000 proj of the Dec 19 - Feb 24 - Feb 28 swing
- RES 3: $3547.9 - 1.764 proj of the Feb 28 - Apr 3 - Apr 7 price swing
- RES 2: $3500.1 - High Apr 22 and bull trigger
- RES 1: $3339.6/3451.3 - 20-day EMA / High Jun 16
- PRICE: $3290.9 @ 07:24 BST Jun 30
- SUP 1: $3245.5 - Low May 29
- SUP 2: $3204.7 - Low May 20
- SUP 3: $3121.0 - Low May 15 and key support
- SUP 4: $3085.0 - 76.4% retracement of the Apr 7 - 22 bull leg
Gold traded lower Friday as the yellow metal extended the pullback from $3451.3, the Jun 16 high. Two key S/T levels have been breached; $3290.3, the 50-day EMA, and 3300.3, a trendline drawn from the Dec 30 ‘24 low. A clear break of both support points would signal scope for a deeper correction - this would expose $3245.5. A reversal higher would refocus attention $3451.3, Jun 16 high. Initial resistance is at $3339.6, the 20-day EMA.
SILVER TECHS: Bullish Structure Intact
- RES 4: $39.026 - 1.382 proj of the Apr 7 - 25 - May 15 swing
- RES 3: $38.246 - 1.236 proj of the Apr 7 - 25 - May 15 swing
- RES 2: $38.000 - Round number resistance
- RES 1: $37.317 - High Jun 18
- PRICE: $36.213@ 08:17 BST Jun 30
- SUP 1: $35.766 - 20-day EMA
- SUP 2: $34.595/31.651 - 50-day EMA / Low May 15
- SUP 3: $30.915/28.351 - Low Apr 11 / 7 and the bear trigger
- SUP 4: $27.686 - Low Sep 6 ‘24
A bull wave in Silver remains in play and the latest pullback is considered corrective. The metal has recently traded through resistance at $34.903, the Oct 23 ‘24 high and a key bull trigger. The break of it marks an important medium-term bullish development. Sights are on the $38.00 handle next. On the downside, initial support to watch lies at $35.766, the 20-day EMA. It has been pierced, a clear break of it would open $34.595, the 50-day EMA.