MNI DAILY TECHNICAL ANALYSIS - Bund Bear Cycle Intact
Price Signal Summary - Bear Cycle In Bunds Extends
- In the equity space, a bullish theme in S&P E-Minis is intact and the contract continues to appreciate. Note that recent gains signal the likely end of the corrective cycle between Oct 30 and Nov 21. A continuation higher would highlight potential for a move towards the key resistance and bull trigger at 6953.75, the Oct 30 high. First support is at 6788.55, the 20-day EMA. A bull cycle in EUROSTOXX 50 futures remains intact. Sights are on 5742.40 next (pierced), the 76.4% retracement of the Nov 13 - 21 bear leg. Clearance of this price point would pave the way for an extension towards 5825.00, the Nov 13 high and a key resistance. First key support lies at 5617.30, the 50-day EMA.
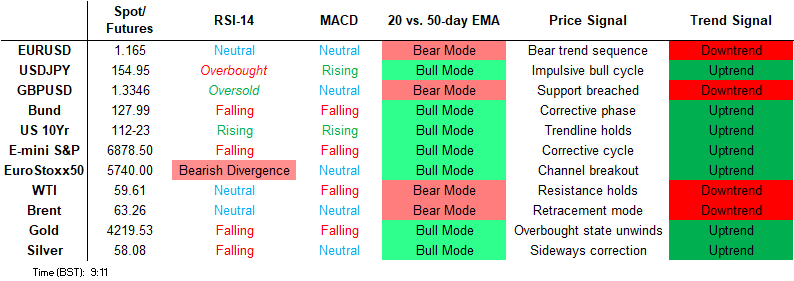
- In FX, a bullish theme in EURUSD remains intact. Gains this week resulted in a breach of key short-term resistance at 1.1656, the Nov 13 high and a bull trigger. Clearance of this level opens 1.1694 next, the 50.0% retracement of the Sep 17 - Nov 5 bear leg. Clearance of this retracement point would strengthen the developing bull theme. On the downside, initial support to watch is 1.1597, the 20-day EMA. A bull theme in GBPUSD remains intact. The pair rallied sharply higher Wednesday to clear resistance around the 50-day EMA, at 1.3262. The break undermines a recent bearish theme and highlights a stronger reversal towards 1.3452, 50.0% retracement of the Sep 17 - Nov 4 bear leg. Initial firm support is seen at 1.3215, the 20-day EMA. A corrective cycle in USDJPY remains in play and a deeper retracement is allowing a recent overbought condition to unwind. Support at 155.30, the 20-day EMA, has been breached. The extension lower exposes the 50-day EMA at 153.41. Moving average studies remain in a bull-mode position, highlighting a dominant medium-term uptrend. A resumption of the trend would open 158.00.
- On the commodity front, the trend needle in Gold continues to point north. The bear phase between Oct 20 and 28 appears to have been a correction. Key support to watch lies at the 50-day EMA, at $4024.3. Clearance of this EMA would signal scope for a deeper retracement. Sights are on key resistance and the bull trigger at $4381.5, the Oct 20 high. Short-term gains in WTI futures appear corrective. Note that moving average studies are in a bear-mode position, highlighting a dominant downtrend. A resumption of the bear leg would open the key support and the bear trigger at $55.99, the Oct 20 low. Key short-term resistance to watch is $61.84, the Oct 24 high. A clear break of this hurdle would signal scope for a stronger correction.
- In the FI space, Bund futures remain in a bear-mode cycle. The move down this week resulted in a break of key short-term support at 128.67, the Nov 20 low. This confirms a resumption of the bear cycle that started on Oct 17 and sets the scene for an extension towards 128.18 next, a 1.382 projection of the Nov 12 - 20 - 26 price swing. Initial resistance is at 128.75, the Dec 3 high. A bullish short-term condition in Gilt futures remains intact and the pullback between Nov 27 - Dec 2 appears to have been a correction. A continuation of gains would signal scope for a climb towards 92.55, the Nov 11 high. A gap in the daily chart has been filled and initial resistance to watch is 91.93, the Nov 27 high. For bears, a stronger reversal would instead refocus attention on support at 90.53, the Nov 26 low.
[CROSS ASSET] MNI Tech Trend Monitor - November Refresh
- We refresh our Global Tech Trend Monitor, adding longer-term techs for USDMXN, EURHUF, EURGBP, Bitcoin and the USD Index as well as refreshing levels for Spot Gold, Silver, USDJPY, UK Gilt Yields and the Europe Banking Stock Index (SX7E).
See full document here: https://emedia.marketnews.com/marketnewsintl/TechTrendMonitorNov.pdf
FOREIGN EXCHANGE
EURUSD TECHS: Breach Of Resistance Strengthens A Bull Theme
- RES 4: 1.1779 High Oct 1
- RES 3: 1.1747 50.0% retracement of the Sep 17 - Nov 5 bear leg
- RES 2: 1.1728 High Oct 17
- RES 1: 1.1694 50.0% retracement of the Sep 17 - Nov 5 bear leg
- PRICE: 1.1655 @ 06:18 GMT Dec 5
- SUP 1: 1.1597 20-day EMA
- SUP 2: 1.1547 Low Nov 26
- SUP 3: 1.1491/1469 Low Nov 21
- SUP 4: 1.1469 Low Nov 5 and the bear trigger
A bullish theme in EURUSD remains intact. Gains this week resulted in a breach of key short-term resistance at 1.1656, the Nov 13 high and a bull trigger. Clearance of this level highlights a potential reversal and opens 1.1694 next, a Fibonacci retracement. Clearance of this retracement point would strengthen the developing bull theme. On the downside, initial support to watch is 1.1597, the 20-day EMA. A break of the EMA would be bearish.
GBPUSD TECHS: Bull Cycle
- RES 4: 1.3471 High Oct 17
- RES 3: 1.3452 50.0% retracement of the Sep 17 - Nov 4 bear leg
- RES 2: 1.3416 High Oct 21
- RES 1: 1.3385 High Dec 04
- PRICE: 1.3349 @ 06:38 GMT Dec 5
- SUP 1: 1.3262 50-day EMA
- SUP 2: 1.3215 20-day EMA
- SUP 3: 1.3125 Low Nov 26
- SUP 4: 1.3038/10 Low Nov 20 / Low Nov 4 & 5 and the bear trigger
A bull theme in GBPUSD remains intact. The pair rallied sharply higher Wednesday to clear resistance around the 50-day EMA, at 1.3262. The break undermines a recent bearish theme and highlights a stronger reversal. This paves the way for an extension towards 1.3452, a Fibonacci retracement point. Initial firm support is seen at 1.3215, the 20-day EMA. A move below this average would be a bearish development.
EURGBP TECHS: Bearish Threat
- RES 4: 0.8840 High Nov 20
- RES 3: 0.8818 High Nov 26
- RES 2: 0.8802 High Dec 2 and a key near-term resistance
- RES 1: 0.8776 20-day EMA
- PRICE: 0.8734 @ 06:47 GMT Dec 5
- SUP 1: 0.8720 Low Oct 27
- SUP 2: 0.8706 76.4% retracement of the Oct 8 - Nov 14 bull leg
- SUP 3: 0.8670 Low Oct 21
- SUP 4: 0.8656 Low Oct 8 and a key support
The trend set-up in EURGBP is bullish and the current spell of weakness appears corrective - for now. However, the cross has breached the 50-day EMA, currently at 0.8754. The break highlights a stronger reversal and a bear threat plus scope for a deeper retracement, towards 0.8706, a Fibonacci retracement. Initial resistance to watch is 0.8802, the Dec 2 high. A breach of this hurdle would be a bullish development.
USDJPY TECHS: Corrective Cycle Remains In Play
- RES 4: 158.87 High Jan 10 and a key resistance
- RES 3: 158.29 2.618 projection of the Sep 17 - 26 - Oct 1 price swing
- RES 2: 158.00 Round number resistance
- RES 1: 156.58/157.89 High Nov 28 / 20 and the bull trigger
- PRICE: 154.55 @ 06:58 GMT Dec 5
- SUP 1: 154.46 Intraday low
- SUP 2: 153.41 50-day EMA
- SUP 3: 152.82 Low Nov 7
- SUP 4: 151.54 Low Oct 29
A corrective cycle in USDJPY remains in play and a deeper retracement is allowing a recent overbought condition to unwind. Support at 155.30, the 20-day EMA, has been breached. The extension lower exposes the 50-day EMA at 153.41. Moving average studies remain in a bull-mode position, highlighting a dominant medium-term uptrend. A resumption of the trend would open 158.00.
EURJPY TECHS: Bullish Outlook
- RES 4: 184.34 2.236 proj of the Jul 31 - Sep 29 - Oct 2 price swing
- RES 3: 183.90 Bull channel top drawn from the Feb 28 low
- RES 2: 183.07 2.000 proj of the Jul 31 - Sep 29 - Oct 2 price swing
- RES 1: 182.01 High Nov 20 and the bull trigger
- PRICE: 180.51 @ 08:37 GMT Dec 5
- SUP 1: 180.11 20-day EMA
- SUP 2: 178.98/178.08 Low Nov 14 / 50-day EMA
- SUP 3: 175.77 Bull channel support drawn from the Feb 28 low
- SUP 4: 175.71 Low Nov 5
EURJPY is unchanged and a bullish theme remains intact. A flag formation has appeared on the daily chart - a trend continuation signal that reinforces the bull theme. Moving average studies are in a bull-mode position, highlighting a dominant uptrend. A continuation of the trend would signal scope for a climb towards 183.90, the top of a bull channel drawn from the Feb 28 low. First key support lies at 180.11, the 20-day EMA.
AUDUSD TECHS: Bullish Impulsive Wave Extends
- RES 4: 0.6723 High Oct 21 ‘24
- RES 3: 0.6707 High Sep 17 and a key resistance
- RES 2: 0.6660 High Sep 18
- RES 1: 0.6640 76.4% retracement of the Sep 17 - Nov 21 bear leg
- PRICE: 0.6623 @ 08:02 GMT Dec 5
- SUP 1: 0.6580/6533 High Nov 13 / 20-day EMA
- SUP 2: 0.6517 Low Nov 27
- SUP 3: 0.6466/21 Low Nov 26 / 21
- SUP 4: 0.6415 Low Aug 21 / 22 and a bear trigger
A strong bullish impulsive wave in AUDUSD remains intact and the pair continues to appreciate. Recent gains have cleared a number of important short-term resistance points, strengthening a bull theme and highlighting scope for a continuation higher. Sights are on 0.6640 next, a Fibonacci retracement point. First key support to watch is at 0.6533, the 20-day EMA. A pullback would be considered corrective.
USDCAD TECHS: Bull Channel Base Pierced
- RES 4: 1.4140 High Nov 5 and a key resistance
- RES 3: 1.4131 High Nov 21
- RES 2: 1.4051 High Nov 28
- RES 1: 1.4016 20-day EMA
- PRICE: 1.3948 @ 08:05 GMT Dec 5
- SUP 1: 1.3942/25 Bull channel base from the Jul 23 low / Low Dec 04
- SUP 2: 1.3888 Low Oct 29 and a key support
- SUP 3: 1.3840 50.0% retracement of the Jun 16 - Nov 6 bull cycle
- SUP 4: 1.3812 Low Sep 23
A bear theme in USDCAD remains intact. The pair has pierced 1.3942, the base of a bull channel drawn from the Jul 23 low, raising further downside risk in the pair. A clear break of the channel base would expose 1.3888, the Oct 29 low. On the upside, a reversal higher is required to refocus attention on 1.4140, the Nov 5 high and key resistance. Initial resistance to watch is 1.4016, 20-day EMA.
FIXED INCOME
BUND TECHS: (H6) Fresh Cycle Low
- RES 4: 129.55 High Nov 26 and key resistance
- RES 3: 129.45 High Nov 28
- RES 2: 129.07 20-day EMA
- RES 1: 128.75 High Dec 3
- PRICE: 128.32 @ 08:30 GMT Dec 5
- SUP 1: 128.29 Intraday low
- SUP 2: 128.18 1.382 projection of the Nov 12 - 20 - 26 price swing
- SUP 3: 128.00 Round number support
- SUP 4: 127.80 1.764 projection of the Nov 12 - 20 - 26 price swing
Bund futures remain in a bear-mode cycle. The move down this week resulted in a break of key short-term support at 128.67, the Nov 20 low. This confirms a resumption of the bear cycle that started on Oct 17 and sets the scene for an extension towards 128.18 next, a Fibonacci projection. Moving average studies on the continuation chart have recently crossed to highlight a bear-mode condition. Key S/T resistance is 129.55, Nov 26 high.
BOBL TECHS: (H6) Southbound
- RES 4: 117.140 High Nov 26 and key resistance
- RES 3: 117.070 High Nov 27
- RES 2: 116.960 High Dec 1
- RES 1: 116.770 High Dec 3
- PRICE: 116.490 @ 08:30 GMT Dec 5
- SUP 1: 116.470 Intraday low
- SUP 2: 116.400 2.000 proj of the Nov 6 - 14 - 26 price swing
- SUP 3: 116.313 2.236 proj of the Nov 6 - 14 - 26 price swing
- SUP 4: 116.259 2.382 proj of the Nov 6 - 14 - 26 price swing
The short-term trend theme in Bobl futures remains bearish and this week’s sell-off reinforces current conditions. The contract has traded through support at the 116.790 level, the Nov 14 and 20 low. This confirms a resumption of the downtrend that started mid-October. Sights are on 116.400 next, a Fibonacci projection. Key short-term resistance is at 117.140, the Nov 26 high. Short-term gains would be considered corrective.
SCHATZ TECHS: (H6) Trend Signals Remain Bearish
- RES 4: 107.060 High Nov 21 and a key resistance
- RES 3: 107.010 High Nov 27
- RES 2: 106.975 High Dec 1
- RES 1: 106.945 High Dec 3
- PRICE: 106.885 @ 08:32 GMT Dec 5
- SUP 1: 106.880 Intraday low
- SUP 2: 106.862 2.236 proj of the Nov 21 - 24 - 26 minor price swing
- SUP 3: 106.851 2.382 proj of the Nov 21 - 24 - 26 minor price swing
- SUP 4: 106.843 2.500 proj of the Nov 21 - 24 - 26 minor price swing
A sharp sell-off in Schatz futures on Monday confirms a resumption of a bear cycle that started mid-October. The contract has breached 106.965, the Nov 17 low. Note that on the continuation chart, moving average studies are in a bear-mode position, highlighting a dominant downtrend. Sights are on 106.862 next, a Fibonacci projection. Key short-term resistance has been defined at 107.060, the Nov 21 high.
GILT TECHS: (H6) Resistance Still Exposed
- RES 4: 92.55 High Nov 11
- RES 3: 92.31 High Nov 12
- RES 2: 92.00 Round number resistance
- RES 1: 91.93 High Nov 27
- PRICE: 91.76 @ Close Dec 4
- SUP 1: 90.87/90.53 Low Dec 2 / Low Nov 25
- SUP 2: 90.28 Low Nov 21
- SUP 3: 90.00 Round number support
- SUP 4: 89.86 Low Nov 19 and the bear trigger
A bullish short-term condition in Gilt futures remains intact and the pullback between Nov 27 - Dec 2 appears to have been a correction. A continuation of gains would signal scope for a climb towards resistance at 92.55, the Nov 11 high. A gap in the daily chart has been filled and initial resistance to watch is 91.93, the Nov 27 high. For bears, a stronger reversal would instead refocus attention on support at 90.53, the Nov 26 low.
BTP TECHS: (H6) Support Remains Intact For Now
- RES 4: 121.33 High Oct 21 and a key resistance area
- RES 3: 121.37 High Nov 13
- RES 2: 121.24 High Nov 26
- RES 1: 120.77 High Dec 3
- PRICE: 120.39 @ Close Dec 4
- SUP 1: 120.17 Low Nov 20 and key short-term support
- SUP 2: 119.76 1.236 proj of the Nov 13 - 20 - 26 price swing
- SUP 3: 119.30 1.618 proj of the Nov 13 - 20 - 26 price swing
- SUP 4: 119.00 Round number support
The trend set-up in BTP futures is bullish and the sell-off this week appears corrective - for now. Key short-term support to watch has been defined at 120.17, the Nov 20 low. A clear breach of this level would undermine a bull theme and resume a recent bear leg. Note that the moving average studies on the continuation chart highlight a dominant uptrend. A resumption of gains would expose the bull trigger at 121.33, the Oct 21 high.
US 10YR FUTURE TECHS: (H6) Bearish Tone
- RES 4: 114-00 Round number resistance
- RES 3: 113-29+ High Oct 17 and a key resistance
- RES 2: 113-23 High Oct 23
- RES 1: 113-11/22+ High Dec 1 / High Nov 25
- PRICE: 112-25+ @ 16:04 GMT Dec 4
- SUP 1: 112-22 Low Dec 02 & 04
- SUP 2: 112-10+ Low Nov 20
- SUP 3: 112-07 Low Nov 5 and a key support
- SUP 4: 112-02+ Low Sep 25
A bearish theme in Treasuries remains intact. Price has this week pierced support around the 50-day EMA, at 112-27. A clear breach of this average would undermine a recent bull theme and signal scope for a deeper retracement. This would open 112-07, the Nov 5 high and a bear trigger. A reversal higher is required to once again refocus attention on the key resistance and bull trigger at 113-29+, the Oct 17 high.
EQUITIES
EUROSTOXX50 TECHS: (Z5) Maintains A Bullish Theme
- RES 4: 5858.59 1.618 proj of the Aug 1 - 22 - Sep 2 price swing
- RES 3: 5825.00 High Nov 13 and a key resistance
- RES 2: 5800.00 Round number resistance
- RES 1: 5742.40 76.4% retracement of the Nov 13 - 21 bear leg
- PRICE: 5736.00 @ 06:38 GMT Dec 5
- SUP 1: 5617.30/5475.00 50-day EMA / Low Nov 21 and bear trigger
- SUP 2: 5427.01 61.8% retracement of the Aug 1 - Nov 13 bull cycle
- SUP 3: 5383.00 Low Sep 18
- SUP 4: 5366.00 Low Sep 17
A bull cycle in EUROSTOXX 50 futures remains intact. Price has recently cleared the 20- and 50-day EMAs, signalling scope for a stronger recovery. Sights are on 5742.40 next (pierced), the 76.4% retracement of the Nov 13 - 21 bear leg. Clearance of this price point would pave the way for an extension towards 5825.00, the Nov 13 high and a key resistance. First key support lies at 5617.30, the 50-day EMA.
E-MINI S&P: (Z5) Continues To Appreciate
- RES 4: 7000.00 Psychological round number
- RES 3: 6953.75 High Oct 30 and bull trigger
- RES 2: 6900.50 High Nov 12
- RES 1: 6880.75 Intraday high
- PRICE: 6881.75 @ 07:23 GMT Dec 5
- SUP 1: 6788.55 20-day EMA
- SUP 2: 6674.50/6525.00 Low Nov 25 / 21
- SUP 3: 6500.00 Round number support
- SUP 4: 6476.62 23.6% retracement of the Apr 7 - Oct 30 uptrend
A bullish theme in S&P E-Minis is intact and the contract continues to appreciate. Price remains above the 20- and 50- day EMAs. Note that recent gains signal the likely end of the corrective cycle between Oct 30 and Nov 21. A continuation higher would highlight potential for a move towards the key resistance and bull trigger at 6953.75, the Oct 30 high. Key support lies at 6525.00, the Nov 21 low. First support is at 6788.55, the 20-day EMA.
COMMODITIES
BRENT TECHS: (G6) Trend Theme Remains Bearish
- RES 4: $70.86 - 76.4% retracement of the Jun 23 - Oct 17 bear leg
- RES 3: $70.33 - High Jul 30
- RES 2: $68.86 - High Sep 26 and a key resistance
- RES 1: $65.25 - High Oct 24
- PRICE: $63.28 @ 07:09 GMT Dec 5
- SUP 1: $59.93 - Low Nov 20 and the bear trigger
- SUP 2: $58.92 - Low May 5
- SUP 3: $58.11 - Low Apr 9 and a key support
- SUP 4: $56.22 - 2.00 proj of the Jul 30 - Aug 13 - Sep 26 price swing
Trend conditions in Brent futures are unchanged. The move down since Oct 24, continues to highlight a bearish theme. A resumption of weakness would expose key support and the bear trigger at $59.93, the Oct 20 low. Clearance of this level would confirm a continuation of the bear cycle. Key short-term resistance to watch is $65.25, the Oct 24 high. Clearance of this level would instead signal scope for a stronger correction.
WTI TECHS: (F6) Attention Is On Support
- RES 4: $71.38 - High Jun 23 and a key medium-term resistance
- RES 3: $67.16 - High Jul 30
- RES 2: $65.33 - High Sep 26 and key resistance
- RES 1: $61.84 - High Oct 24
- PRICE: $59.60 @ 07:17 GMT Dec 5
- SUP 1: $55.99 - Low Oct 20 and bear trigger
- SUP 2: $55.33 - Low May 1
- SUP 3: $54.72 - Low Apr 9 and a key support
- SUP 4: $53.53 - 1.764 proj of the Jul 30 - Aug 13 - Sep 26 price swing
Short-term gains in WTI futures appear corrective. Note that moving average studies are in a bear-mode position, highlighting a dominant downtrend. A resumption of the bear leg would open the key support and the bear trigger at $55.99, the Oct 20 low. Clearance of this level would resume the downtrend. Key short-term resistance to watch is $61.84, the Oct 24 high. A clear break of this hurdle would signal scope for a stronger correction.
GOLD TECHS: Trend Needle Points North
- RES 4: $4404.9 - 3.500 proj of the May 15 - Jun 16 - 30 price swing
- RES 3: $4400.0 - Round number resistance
- RES 2: $4381.5 - High Oct 20 and bull trigger
- RES 1: $4264.7 - 76.4% retracement of the Oct 20 - 28 correction
- PRICE: $4227.5 @ 07:23 GMT Dec 4
- SUP 1: $4139.7/4024.23 - 20- and 50-day EMA values
- SUP 2: $3886.6 - Low Oct 28 and a reversal trigger
- SUP 3: $3800.00 Round number support
- SUP 4: $3760.9 - Low Sep 29
The trend needle in Gold continues to point north. The bear phase between Oct 20 and 28 appears to have been a correction and note that the recovery since Oct 28 signals the end of that corrective cycle. Key support to watch lies at the 50-day EMA, at $4024.3. Clearance of this EMA would signal scope for a deeper retracement. Sights are on key resistance and the bull trigger at $4381.5, the Oct 20 high.
SILVER TECHS: Northbound
- RES 4: $60.852 - 1.382 proj of the Oct 28 - Nov 13 - 21 price swing
- RES 3: $60.000 - Psychological round number
- RES 2: $59.563 - 1.236 proj of the Oct 28 - Nov 13 - 21 price swing
- RES 1: $58.979 - High Dec 3
- PRICE: $58.228 @ 08:17 GMT Dec 5
- SUP 1: $53.546 - 20-day EMA
- SUP 2: $50.215/45.557 - 50-day EMA / Low Oct 28
- SUP 3: $41.135 - Low Sep 17
- SUP 4: $38.087 - Low Aug 27
Trend signals in Silver remain bullish - price has traded to a fresh all-time high this week. This confirms a resumption of the uptrend and maintains the bullish price sequence of higher highs and higher lows. The move above $55.00 signals scope for a climb towards $59.563 next, a Fibonacci projection. Sights are also on the $60.00 psychological handle. Initial support lies at $53.546, the 20-day EMA.