MNI DAILY TECHNICAL ANALYSIS - Bullish AUD Theme Intact
Price Signal Summary – Bullish AUD Theme Intact
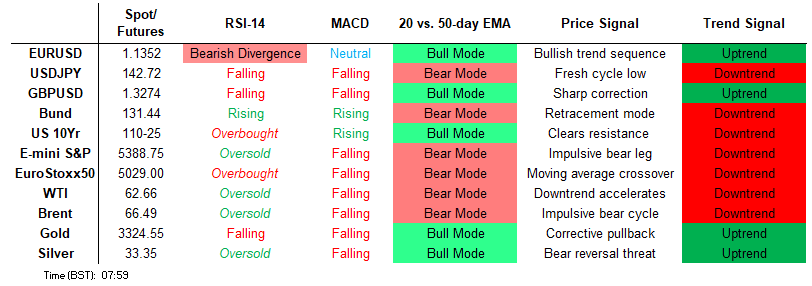
- The bull cycle in S&P E-Minis that started on Apr 7 is considered corrective. The trend condition has been oversold following recent weakness and gains have allowed this to unwind. Price has traded above the 20-day EMA, at 5423.30. This exposes 5528.75, the Apr 10 high. Eurostoxx 50 futures have recovered from Tuesday’s low. Recent gains highlight a corrective cycle and the rally marks an unwinding of a recent oversold trend condition. The 20-day EMA has been cleared.
- The trend direction in GBPUSD remains up and the latest pullback appears corrective. A pullback would allow a S/T overbought condition to unwind. The pair has recently breached 1.3207, the Apr 3 high and a bull trigger. EURJPY is unchanged and in consolidation mode. The recent pullback appears corrective and the trend condition is bullish. Key S/T support has been defined at 158.30, the Apr 7 low. A break of this level is required to signal scope for a deeper retracement. AUDUSD continues to trade closer to its recent highs and a bullish theme is intact. The pair has recently breached a key resistance at 0.6409, the Dec 9 ‘24 high.
- The trend needle in Gold continues to point north and this week’s fresh cycle high reinforces bullish conditions. The latest move down appears corrective and is allowing an overbought trend condition to unwind. A bearish theme in WTI futures remains intact and the recovery since Apr 9 is - for now - considered corrective. The move higher is allowing an oversold trend condition to unwind.
- Bund futures continue to trade just below their recent highs. A bull cycle is in play and the pullback between Apr 7 - 9 is considered corrective. Attention is on resistance at 132.03, the Apr 7 high and a bull trigger. Gilt futures traded sharply higher yesterday before pulling back. For now, the climb marks an extension of the recovery that started Apr 9. The rally cancels a recent bearish theme. 92.63, the Apr 8 high, has been breached, exposing 93.44.
FOREIGN EXCHANGE
EURUSD TECHS: Corrective Pullback
- RES 4: 1.1696 1.618 proj of the Feb 28 - Mar 18 - 27 price swing
- RES 3: 1.1625 1.500 proj of the Feb 28 - Mar 18 - 27 price swing
- RES 2: 1.1608 High Nov 9 2021
- RES 1: 1.1573 High Apr 21
- PRICE: 1.1350 @ 16:03 BST Apr 23
- SUP 1: 1.1308 Low Apr 23
- SUP 2: 1.1181 20-day EMA and a key support
- SUP 3: 1.0934 50-day EMA and a short-term pivot level
- SUP 4: 1.0805 Low Apr 3
The trend in EURUSD remains bullish and the move down from Monday’s cycle high is considered corrective. A bullish price sequence of higher highs and higher lows remains intact and note that MA studies are in a bull-mode position too, signalling a continued dominant uptrend. The focus is on 1.1608 next, the Nov 9 2021 high. Key support is unchanged at the 20-day EMA, at 1.1181. A break of this average would signal scope for a deeper retracement.
GBPUSD TECHS: Trend Needle Points North
- RES 4: 1.3550 High Feb 24 ‘22
- RES 3: 1.3500 Round number resistance
- RES 2: 1.3434 High Sep 26 ‘24 and a key resistance
- RES 1: 1.3424 High Apr 22 and the bull trigger
- PRICE: 1.3269 @ 06:17 BST Apr 24
- SUP 1: 1.3234 Low Apr 23
- SUP 2: 1.3114 20-day EMA
- SUP 3: 1.3041/2936 Low Apr 14 / 50-day EMA
- SUP 4: 1.2807 Low Apr 10
The trend direction in GBPUSD remains up and the latest pullback appears corrective. A pullback would allow a S/T overbought condition to unwind. The pair has recently breached 1.3207, the Apr 3 high and a bull trigger. This highlights a resumption of the uptrend. Note that moving average studies are in a bull-mode position, signalling a dominant uptrend. Sights are on 1.3434 next, the Sep 26 ‘24 high. Support to watch is 1.3114, the 20-day EMA.
EURGBP TECHS: Corrective Cycle
- RES 4: 0.8800 Round number resistance
- RES 3: 0.8781 2.236 proj of the Mar 3 - 11 - 28 price swing
- RES 2: 0.8768 High Nov 20 ‘23
- RES 1: 0.8624/0.8738 High Apr 21/ High Apr 11 and the bull trigger
- PRICE: 0.8544 @ 06:41 BST Apr 24
- SUP 1: 0.8526 20-day EMA
- SUP 2: 0.8477 61.8% retracement of the Mar 28 - Apr 11 rally
- SUP 3: 0.8451 50-day EMA
- SUP 4: 0.8415 76.4% retracement of the Mar 28 - Apr 11 rally
EURGBP is trading closer to its recent lows. The retracement that started on Apr 11, appears corrective and this has allowed an overbought trend condition to unwind. Support to watch lies at 0.8526, the 20-day EMA. Below this level, support at the 50-day EMA is at 0.8451. The area between these two averages represents a key support zone. For bulls, a resumption of gains would refocus attention on 0.8738, the Apr 11 high and bull trigger.
USDJPY TECHS: Trend Needle Points South
- RES 4: 148.27 High Apr 9
- RES 3: 147.60 50-day EMA
- RES 2: 144.76 20-day EMA
- RES 1: 143.57 High Apr 23
- PRICE: 142.82 @ 06:50 BST Apr 24
- SUP 1: 139.79 1.382 proj of the Feb 12 - Mar 11 - 28 price swing
- SUP 2: 138.82 1.500 proj of the Feb 12 - Mar 11 - 28 price swing
- SUP 3: 138.07 LowJul 28 ‘23
- SUP 4: 137.85 1.618 proj of the Feb 12 - Mar 11 - 28 price swing
The trend condition in USDJPY remains bearish and the latest recovery is considered corrective. Recent fresh cycle lows confirm a resumption of the downtrend and maintain the price sequence of lower lows and lower highs. Note too that moving average studies are in a bear-mode position highlighting a dominant downtrend. Sights are on 139.79 next, a Fibonacci projection. Initial firm resistance to watch is the 20-day EMA, at 144.76.
EURJPY TECHS: Bullish Trend Structure
- RES 4: 165.43 High Nov 8
- RES 3: 164.90 High Dec 30 ‘24 and a key medium-term resistance
- RES 2: 164.55 High Jan 7
- RES 1: 163.55/164.19 High Apr 14 / High Mar 18 and the bull trigger
- PRICE: 162.05 @ 07:06 GMT Apr 24
- SUP 1: 161.25/159.48 50-day EMA / Low Apr 9
- SUP 2: 158.30 Low Apr 7 and key support
- SUP 3: 157.02 76.4% retracement of the Feb 28 - Mar 18 bull cycle
- SUP 4: 155.60 Low Low Mar 4
EURJPY is unchanged and in consolidation mode. The recent pullback appears corrective and the trend condition is bullish. Key S/T support has been defined at 158.30, the Apr 7 low. A break of this level is required to signal scope for a deeper retracement. This would open 157.02, a Fibonacci retracement. For bulls, a resumption of gains would expose 164.19, the Mar 18 high and a bull trigger. Clearance of this hurdle would resume the uptrend.
AUDUSD TECHS: Bullish Theme
- RES 4: 0.6550 61.8% retracement of the Sep 30 ‘24 - Apr 9 bear leg
- RES 3: 0.6528 High Nov 29 ‘24
- RES 2: 0.6471 High Dec 9 ‘24
- RES 1: 0.6439 High Apr 22
- PRICE: 0.6366 @ 07:34 BST Apr 24
- SUP 1: 0.6344/6305 Intraday low / 20-day EMA
- SUP 2: 0.6181 Low Apr 11
- SUP 3: 0.6116 Low Apr 10
- SUP 4: 0.5915 Low Apr 9 and key support
AUDUSD continues to trade closer to its recent highs and a bullish theme is intact. The pair has recently breached a key resistance at 0.6409, the Dec 9 ‘24 high. This reinforces bullish conditions and signals scope for a continuation higher near-term. Sights are on 0.6471 next, the Dec 9 2024 high. Initial key support to monitor is 0.6305, the 20-day EMA. A clear break of this EMA would be a concern for bulls.
USDCAD TECHS: Corrective Bounce
- RES 4: 1.4415 High Apr 1
- RES 3: 1.4296 High Apr 7
- RES 2: 1.4165 50-day EMA
- RES 1: 1.3906/4029 High Apr 17 / 20-day EMA
- PRICE: 1.3871 @ 16:29 BST Apr 23
- SUP 1: 1.3781 Low Apr 21
- SUP 2: 1.3744 76.4% retracement of Sep 25 ‘24 - Feb 3 bull run
- SUP 3: 1.3696 Low Oct 10 2024
- SUP 4: 1.3643 Low Oct 9 ‘24
A bearish theme in USDCAD remains intact for now despite Wednesday’s spot rally. Fresh cycle lows continue to highlight a resumption of the downtrend and signal scope for a continuation near-term. Potential is seen for a move towards 1.3744, a Fibonacci retracement. Moving average studies are in a bear -mode position, highlighting a dominant downtrend. First resistance to watch is 1.4029, the 20-day EMA.
FIXED INCOME
BUND TECHS: (M5) Trend Needle Points North
- RES 4: 133.90 1.236 proj of the Mar 25 - Apr 7- 9 price swing
- RES 3: 133.00 round number resistance
- RES 2: 132.56 High Feb 28 and a key resistance
- RES 1: 132.03 High Apr 7 and the bull trigger
- PRICE: 131.42 @ 05:45 BST Apr 24
- SUP 1: 130.40/129.92 20-day EMA / Low Apr 11
- SUP 2: 129.02 Low Apr 10
- SUP 3: 128.60 Low Apr 9 and a key support
- SUP 4: 128.47 Low Mar 28
Bund futures continue to trade just below their recent highs. A bull cycle is in play and the pullback between Apr 7 - 9 is considered corrective. Attention is on resistance at 132.03, the Apr 7 high and a bull trigger. Clearance of this level would confirm a resumption of the uptrend and open 132.56, the Feb 28 high. Firm support lies at 128.60, the Apr 9 low. A break below this level would alter the picture.
BOBL TECHS: (M5) Outlook Remains Bullish
- RES 4: 120.20 High Dec 12 ‘24 (cont)
- RES 3: 120.000 Psychological round number
- RES 2: 119.960 High Apr 7 and the bull trigger
- RES 1: 119.780 High Apr 22
- PRICE: 119.630 @ 05:55 BST Apr 23
- SUP 1: 119.030 Low Apr 17
- SUP 2: 118.758 20-day EMA
- SUP 3: 118.060 Low Apr 10
- SUP 4: 117.680 Low Apr 9 and a key support
Bobl futures are holding on to the bulk of their latest gains. Recent weakness between Apr 7 - 9 appears corrective and a bullish theme remains intact. The early April rally resulted in a break of key resistance at 119.040, the Feb 28 high. This strengthens bullish conditions. The focus is on the 120.000 handle next. Firm support lies at 117.680, the Apr 9 low. The 20-day EMA, an important short-term support, is at 118.758.
SCHATZ TECHS: (M5) Structure Remains Bullish
- RES 4: 107.812 0.618 proj of the Mar 6 - Apr 7 - 9 price swing
- RES 3: 107.800 Round number resistance
- RES 2: 107.775 High Apr 7 and the bull trigger
- RES 1: 107.735 High Apr 22
- PRICE: 107.490 @ 06:10 BST Apr 24
- SUP 1: 107.370 Low Apr 17
- SUP 2: 107.315 20-day EMA
- SUP 3: 107.125 Low Apr 10
- SUP 4: 106.965 Low Apr 9 and a key support
Schatz futures maintain a firmer tone despite Wednesday’s pullback and sights are on 107.775, the Apr 7 high and bull trigger. The recent move down between Apr 7 - 9, appears corrective. Clearance of 107.775 would confirm a resumption of the uptrend and open 107.812, a Fibonacci projection. Moving average studies remain in a bull-mode position, highlighting a dominant uptrend. Firm support to watch lies at 107.315, the 20-day EMA.
GILT TECHS: (M5) Monitoring Support
- RES 4: 94.50 High Apr 7 and key resistance
- RES 3: 94.00 Round number resistance
- RES 2: 93.44 76.4% retracement of the Apr 7-9 sell-off
- RES 1: 93.32 High Apr 23
- PRICE: 92.52 @ Close Apr 23
- SUP 1: 92.02 20-day EMA
- SUP 2: 91.73/91.43 Low Apr 17 / 15
- SUP 3: 90.47/89.99 Low Apr 11 / 9
- SUP 4: 89.68 Low Jan 15 (cont)
Gilt futures traded sharply higher yesterday before pulling back. For now, the climb marks an extension of the recovery that started Apr 9. The rally cancels a recent bearish theme. 92.63, the Apr 8 high, has been breached, exposing 93.44, the 76.4% retracement of the Apr 7-9 sell-off. A break of this level would strengthen the current bull cycle and expose 94.50, the Apr 7 high and a key resistance. Support to watch is 92.02, the 20-day EMA.
BTP TECHS: (M5) Maintains A Positive Tone
- RES 4: 120.65 1.382 proj of the Mar 14 - Apr 4 - 9 price swing
- RES 3: 120.39 High Feb 28
- RES 2: 120.12 High High Mar 4
- RES 1: 120.04 High Apr 23
- PRICE: 119.69 @ Close Apr 23
- SUP 1: 119.07/118.53 High Apr 4 / 20-day EMA
- SUP 2: 117.28 Low Apr 10
- SUP 3: 116.06 Low Apr 9
- SUP 4: 115.75 Low Apr 14 and a bear trigger
BTP futures have traded higher this week and the contract maintains a bullish tone. Recent gains resulted in a break of resistance at 119.07, the Apr 4 high. The breach confirms the end of the Apr 4 - 9 correction and cancels a recent bearish threat. Note too that, 119.29, 76.4% of the Feb 28 - Mar 14 bear leg, has been cleared - a bullish development. This opens 120.12 next, the Mar 4 high. Initial support to watch lies at 118.53, the 20-day EMA.
EQUITIES
EUROSTOXX50 TECHS: (M5) Corrective Cycle Still In Play
- RES 4: 5263.01 76.4% retracement of the Mar 3 - Apr 7 bear leg
- RES 3: 5165.00 HIgh Apr 3
- RES 2: 5102.45 50-day EMA
- RES 1: 5079.00 High Apr 23
- PRICE: 5035.00 @ 06:31 BST Apr 24
- SUP 1: 4812.00 Low Apr 16
- SUP 2: 4664.00 Low Apr 10
- SUP 3: 4444.00 Low Apr 7 and the bear trigger
- SUP 4: 4336.00 Low Nov 28 ‘23 (cont)
Eurostoxx 50 futures have recovered from Tuesday’s low. Recent gains highlight a corrective cycle and the rally marks an unwinding of a recent oversold trend condition. The 20-day EMA has been cleared. The next key resistance to watch is 5102.45, the 50-day EMA. Key support and the bear trigger has been defined at 4444.00, the Apr 7 low. A break of this level would confirm a resumption of the downtrend.
E-MINI S&P: (M5) Gains Considered Corrective
- RES 4: 5773.25 High Apr 2
- RES 3: 5630.01 50-day EMA
- RES 2: 5528.75 High Apr 10 and the bull trigger
- RES 1: 5499.75 High Apr 23
- PRICE: 5387.25 @ 07:20 BST Apr 24
- SUP 1: 5098.16 61.8% retracement of the Apr 7 - 10 bounce
- SUP 2: 4996.43 76.4% retracement of the Apr 7 - 10 bounce
- SUP 3: 4832.00 Low Apr 7 and the bear trigger
- SUP 4: 4760.88 1.618 proj of the Feb 19 - Mar 13 - 25 price swing
The bull cycle in S&P E-Minis that started on Apr 7 is considered corrective. The trend condition has been oversold following recent weakness and gains have allowed this to unwind. Price has traded above the 20-day EMA, at 5423.30. This exposes 5528.75, the Apr 10 high. Note that resistance at the 50-day EMA - a key level too - is at 5630.01. For bears, a resumption of weakness would refocus attention on 4832.00, the Apr 7 low and bear trigger.
COMMODITIES
BRENT TECHS: (M5) Holding On To The Bulk Of Its Recent Gains
- RES 4: $77.75 - High Jan 20
- RES 3: $76.26 - High Feb 20
- RES 2: $75.47 - High Apr 2 and a bull trigger
- RES 1: $69.70 - 50-day EMA
- PRICE: $66.15 @ 07:04 BST Apr 24
- SUP 1: $62.00/58.40 - Low Apr 10 / 9 and the bear trigger
- SUP 2: $58.85 - 2.000 proj of the Feb 20 - Mar 5 - Apr 2 price swing
- SUP 3: $56.89 - 2.236 proj of the Feb 20 - Mar 5 - Apr 2 price swing
- SUP 4: $55.00 - Round number support
Brent futures are holding on to the bulk of their recent gains and continue to trade above the Apr 9 low. For now, the latest bounce is considered corrective and has allowed a recent oversold condition to unwind. The primary trend direction remains down and a resumption of weakness would open $56.89, a Fibonacci projection. On the upside, the next important resistance to monitor is at the 50-day EMA, at $69.70.
WTI TECHS: (M5) Corrective Phase Still In Play
- RES 4: $75.51 - High Jan 15 and a key resistance
- RES 3: $72.56 - High Feb 20
- RES 2: $66.12/71.76 - 50-day EMA / High Apr 2 and key resistance
- RES 1: $64.49 Low Mar 5 low and a recent breakout level.
- PRICE: $62.36 @ 07:13 BST Apr 24
- SUP 1: $58.29/54.67 - Low Apr 10 / 9 and the bear trigger
- SUP 2: $53.72 - 2.236 proj of the Feb 20 - Mar 5 - Apr 2 price swing
- SUP 3: $52.54 - 2.382 proj of the Jan 15 - Feb 4 - 11 price swing
- SUP 4: $50.00 - Psychological round number
A bearish theme in WTI futures remains intact and the recovery since Apr 9 is - for now - considered corrective. The move higher is allowing an oversold trend condition to unwind. Recent weakness has resulted in the breach of a number of important support levels, reinforcing a bearish threat. A resumption of the bear cycle would open $53.72, a Fibonacci projection. Resistance to watch is 65.96, the 50-day EMA.
GOLD TECHS: Support Remains Intact
- RES 4: $3600.0 - Round number resistance
- RES 3: $3578.0 - 2.000 proj of the Dec 19 - Feb 24 - Feb 28 swing
- RES 2: $3547.9 - 1.764 proj of the Feb 28 - Apr 3 - Apr 7 price swing
- RES 1: $3386.6/3500.1 - High Apr 23 / 22
- PRICE: $3318.5 @ 07:20 BST Apr 24
- SUP 1: $3230.0 - Low Apr 16
- SUP 2: $3194.1 - 20-day EMA
- SUP 3: $3167.8 - High Apr 3 and a recent breakout level
- SUP 4: $3056.4 - 50-day EMA
The trend needle in Gold continues to point north and this week’s fresh cycle high reinforces bullish conditions. The latest move down appears corrective and is allowing an overbought trend condition to unwind. Moving average studies are unchanged, they remain in a bull-mode position highlighting a dominant uptrend. The next objective is $3547.9, a Fibonacci projection. Initial firm support to watch lies at 3194.1, the 20-day EMA.
SILVER TECHS: Bull Cycle Extends
- RES 4: $36.000 - Round number resistance
- RES 3: $34.903 - High Oct 23 ‘24 and the bull trigger
- RES 2: $34.590 - High Mar 28
- RES 1: $33.685 - Intraday high
- PRICE: $33.361 @ 08:00 BST Apr 24
- SUP 1: $32.087 - Low Apr 17
- SUP 2: $30.577/28.351 - Low Apr 10 / 7 and the bear trigger
- SUP 3: $27.686 - Low Sep 6 ‘24
- SUP 4: $27.180 - Low Aug 14 ‘24
A strong rally in Silver yesterday reinforces the current bullish theme. The metal has cleared $33.117, the 76.4% retracement of the Mar 28 - Apr 7 bear leg. This paves the way for a climb towards $34.590, the Mar 28 high. On the downside, initial firm support to watch has been defined at $32.087, the Apr 17 low. A break of this level would undermine the bull cycle and signal a potential reversal.