MNI DAILY TECHNICAL ANALYSIS - Bull Cycle Grips EURJPY
Price Signal Summary – Bull Cycle Grips EURJPY
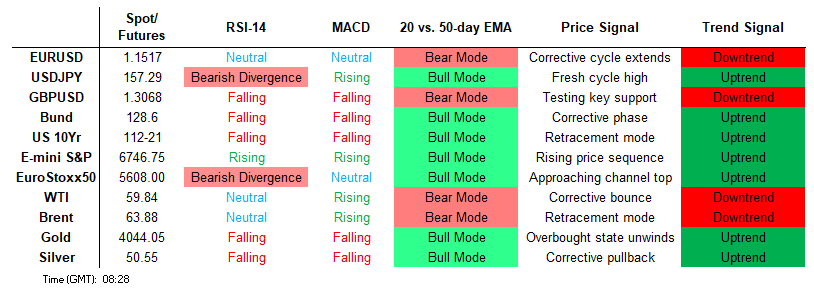
- S&P E-Minis maintain a softer S/T tone - for now - despite the recovery from Tuesday’s low. The recent breach of 6655.70, the Nov 7 low cancels recent bullish signals and signals scope for an extension of the current corrective cycle. A medium-term bull trend in EUROSTOXX 50 futures remains intact, however, recent weakness highlights a stronger corrective cycle. The contract has breached two key support points; 5601.75, the 50-day EMA, and 5615.50, the base of a bull channel.
- A sharp sell-off in GBPUSD yesterday, reinforces a bearish theme and highlights the fact that gains since Nov 4 have been corrective. Furthermore moving average studies are in a bear-mode condition. A firm bull cycle in EURJPY remains intact and this week’s strong gains reinforce the bull theme. The move higher confirms a resumption of the uptrend and maintains the bullish price sequence of higher highs and higher lows. USDCAD rallied Wednesday, potentially undermining a bear theme. A continuation higher would expose 1.4140, the Nov 5 high and the next notable resistance. For now the short-term outlook is bearish.
- The bearish phase in Gold between Oct 20 and 28 appears to have been a correction and has allowed a recent overbought condition to unwind. The recovery since Oct 28 suggests that correction is over. WTI futures are trading in a range. A sell-off on Nov 12 strengthens a bearish theme. A resumption of the bear leg would pave the way for a move towards key support and the bear trigger at $55.99, the Oct 20 low.
- A bear cycle in Bund futures remains intact and price is trading at its trend lows. The contract has recently pierced support at 128.52, the 76.4% retracement of the Sep 25 - Oct 17 bull leg. A sharp sell-off in Gilt futures yesterday strengthens a bearish threat and cancels a recent bullish condition. The contract has traded through support at 91.82, the Sep 11 high, and the move down signals scope for a deeper retracement.
[CROSS ASSET]: Refreshing the MNI Tech Trend Monitor, Adding Gold, Silver, JPY
- We refresh our Global Tech Trend Monitor, adding longer-term techs for Spot Gold, Silver and USDJPY, while refreshing levels for UK Gilt 10y and 30y yields as well as the Europe Banking Stock Index (SX7E).
- See full document here: https://emedia.marketnews.com/marketnewsintl/MNITechTrendMonitorOct25.pdf
FOREIGN EXCHANGE
EURUSD TECHS: Key Support Remains Exposed
- RES 4: 1.1728 High Oct 17
- RES 3: 1.1694 50.0% retracement of the Sep 17 - Nov 5 bear leg
- RES 2: 1.1669 High Oct 28 and key resistance
- RES 1: 1.1586/1656 20-day EMA / High Nov 13
- PRICE: 1.1520 @ 06:07 GMT Nov 20
- SUP 1: 1.1510/1469 Intraday low / Low Nov 5 and the bear trigger
- SUP 2: 1.1425 1.500 proj of the Oct 17 - 22 - 28 price swing
- SUP 3: 1.1392 Low Aug 1 and bear trigger
- SUP 4: 1.1313 Low May 30
The trend structure in EURUSD remains bearish and the pullback from the Nov 13 high, reinforces a bear theme. Resistance to watch is 1.1669, the Oct 28 high. Clearance of this hurdle would highlight a stronger reversal. Moving average studies are in a bear-mode position, highlighting a dominant downtrend and continue to suggest that gains since Nov 5 are corrective. Sights are on key support at 1.1469, the Nov 5 low.
GBPUSD TECHS: Approaching The Bear Trigger
- RES 4: 1.3368 50.0% retracement of the Sep 17 - Nov 4 bear leg
- RES 3: 1.3287 50-day EMA
- RES 2: 1.3284 38.2% retracement of the Sep 17 - Nov 4 bear leg
- RES 1: 1.3185/3206 20-day EMA / High Nov 13
- PRICE: 1.3059 @ 06:21 GMT Nov 20
- SUP 1: 1.3038/10 Low Nov 19 / Low Nov 4 & 5 and the bear trigger
- SUP 2: 1.2971 1.382 proj of the Sep 17 - 25 - Oct 1 price swing
- SUP 3: 1.2945 50.0% retracement of the Jan 13 - Jul 1 bull leg
- SUP 4: 1.2877 1.618 proj of the Sep 17 - 25 - Oct 1 price swing
A sharp sell-off in GBPUSD yesterday, reinforces a bearish theme and highlights the fact that gains since Nov 4 have been corrective. Furthermore moving average studies are in a bear-mode condition, highlighting a dominant downtrend. A reversal through 1.3010, the NOv 4 / 5 low, would confirm the next phase lower. Key short-term resistance is at the 20-day EMA, at 1.3185. A clear break of it would signal a stronger corrective cycle.
EURGBP TECHS: Trend Needle Points North
- RES 4: 0.8893 2.000 proj of the Sep 15 - 25 - Oct 8 price swing
- RES 3: 0.8875 High Apr 25
- RES 2: 0.8868 61.8% retracement of the 2022 - 2024 bear leg
- RES 1: 0.8865 High Nov 14
- PRICE: 0.8820 @ 06:41 GMT Nov 20
- SUP 1: 0.8788 20-day EMA
- SUP 2: 0.8769 Low Nov 10
- SUP 3: 0.8740 50-day EMA
- SUP 4: 0.8706 Low Oct 24 and a key support
The trend needle in EURGBP continues to point north. A fresh cycle high on Nov 14 confirmed a resumption of the uptrend and has maintained the price sequence of higher highs and higher lows. Sights are on 0.8868 next, a Fibonacci retracement. On the downside, initial key short-term support to monitor lies at 0.8788, the 20-day EMA. A clear break of the average would signal scope for a deeper retracement.
USDJPY TECHS: Uptrend Accelerates
- RES 4: 158.87 High Jan 10 and a key resistance
- RES 3: 158.29 2.618 projection of the Sep 17 - 26 - Oct 1 price swing
- RES 2: 158.00 Round number resistance
- RES 1: 157.76 2.500 projection of the Sep 17 - 26 - Oct 1 price swing
- PRICE: 157.68 @ 06:56 GMT Nov 20
- SUP 1: 155.21/154.01 Low Nov 19 / 20-day EMA
- SUP 2: 152.82 Low Nov 7
- SUP 3: 151.95 50-day EMA
- SUP 4: 150.47 Low Oct 21
USDJPY continues to appreciate, reinforcing current strong bullish conditions. Yesterday’s gains signal an acceleration of the bull cycle. Note too that moving average studies remain in a bull-mode position, highlighting a dominant uptrend. Sights are on the 158.00 handle next. Support to watch is 154.01, the 20-day EMA. Note that the pair has entered overbought territory. A pullback would be considered corrective.
EURJPY TECHS: Northbound
- RES 4: 183.07 1.764 proj of the Jul 31 - Sep 29 - Oct 2 price swing
- RES 3: 182.75 Bull channel top drawn from the Feb 28 low
- RES 2: 182.00 Round number resistance
- RES 1: 181.80 1.764 proj of the Jul 31 - Sep 29 - Oct 2 price swing
- PRICE: 181.71 @ 07:03 GMT Nov 20
- SUP 1: 179.78 Low Nov 19
- SUP 2: 178.44/176.50 20- and 50-day EMA values
- SUP 3: 175.71 Low Nov 5
- SUP 4: 174.61 Bull channel support drawn from the Feb 28 low
A firm bull cycle in EURJPY remains intact and this week’s strong gains reinforce the bull theme. The move higher confirms a resumption of the uptrend and maintains the bullish price sequence of higher highs and higher lows. Sights are 181.80 next, a Fibonacci projection point. Further out, scope is seen for a move towards and above the 182.00 handle. First key support lies at 178.44, the 20-day EMA.
AUDUSD TECHS: Bearish Threat Still Present
- RES 4: 0.6660 High Sep 18
- RES 3: 0.6644 76.4% retracement of the Sep-Oct bear leg
- RES 2: 0.6618 High Oct 29 and a key near-term resistance
- RES 1: 0.6519/6580 20-day EMA / High Nov 13
- PRICE: 0.6475 @ 08:02 GMT Nov 20
- SUP 1: 0.6451 Low Nov 19
- SUP 2: 0.6440 Low Oct 14 and key support
- SUP 3: 0.6415 Low Aug 21 / 22 and a bear trigger
- SUP 4: 0.6373 Low Jun 23
A bear threat in AUDUSD remains present. The latest sell-off reinforces a short-term bearish signal on Nov 13 - a shooting star (inverted hammer) candle formation. Note too that moving average studies are in a bear-mode position, highlighting a dominant downtrend. Key short-term pivot resistance has been defined at 0.6580, the Nov 13 high. Sights are on the next key support at 0.6440, the Oct 14 low.
USDCAD TECHS: Strong Bounce
- RES 4: 1.4200 Round number resistance
- RES 3: 1.4177 Channel top drawn from Jul 23 low
- RES 2: 1.4140/67 High Nov 5 / 50.0% of the Feb 3 - Jun 16 bear leg
- RES 1: 1.4065 High Nov 19
- PRICE: 1.4062 @ 08:09 GMT Nov 20
- SUP 1: 1.3972 50-day EMA
- SUP 2: 1.3901 Bull channel base drawn from the Jul 23 low
- SUP 3: 1.3888 Low Oct 29 and a key support
- SUP 4: 1.3833 Low Sep 24
USDCAD rallied Wednesday, potentially undermining a bear theme. A continuation higher would expose 1.4140, the Nov 5 high and the next notable resistance. For now the short-term outlook is bearish. The pair is trading inside a bull channel drawn from the Jul 23 low. The top of the channel provided a firm resistance on Nov 11. The subsequent move down highlights scope for an extension towards the base of the channel at 1.3901.
FIXED INCOME
BUND TECHS: (Z5) Bear Cycle Intact
- RES 4: 129.73 High Oct 28
- RES 3: 129.40 High Nov 13 and a key resistance
- RES 2: 129.12 High Nov 14
- RES 1: 129.07 50-day EMA
- PRICE: 128.55 @ 05:46 GMT Nov 20
- SUP 1: 128.50 Low Nov 17
- SUP 2: 128.25 Low Oct 7
- SUP 3: 127.88 Low Sep 25 and key support
- SUP 4: 127.61 Low Sep 3 and a key M/T support
A bear cycle in Bund futures remains intact and price is trading at its trend lows. The contract has recently pierced support at 128.52, the 76.4% retracement of the Sep 25 - Oct 17 bull leg. A clear break of this price point would signal scope for an extension towards 128.25, the Oct 7 low. Key short-term resistance is seen at 129.40, the Nov 13 high. Clearance of this hurdle would signal a reversal. First resistance is 129.07, the 50-day EMA.
BOBL TECHS: (Z5) Bearish Cycle
- RES 4: 118.600 High Oct 24
- RES 3: 118.360 High Oct 28
- RES 2: 118.270 High Nov 5 118.360/600 High Oct 28 / 24
- RES 1: 118.107 50-day EMA.
- PRICE: 117.870 @ 05:57 GMT Nov 20
- SUP 1: 117.800 Low Nov 17 / 18
- SUP 2: 117.710 Low Oct 6
- SUP 3: 117.630 Low Oct 1
- SUP 4: 117.470 Low Sep 15 and a key support
The short-term trend condition in Bobl futures remains bearish and a fresh cycle low this week reinforces current conditions. Recent weakness resulted in a breach of 118.043, 61.8% of the Sep 25 - Oct 17 bull cycle. Note that 117.824, the 76.4% retracement, has been pierced. A continuation lower would open 117.630, the Oct 1 low. Initial firm resistance is seen at 118.107, the 50-day EMA.
SCHATZ TECHS: (Z5) Bearish Theme
- RES 4: 107.235 High Oct 22
- RES 3: 107.175 High Oct 24
- RES 2: 107.067 50-day EMA
- RES 1: 107.029 20-day EMA
- PRICE: 106.980 @ 06:16 GMT Nov 20
- SUP 1: 106.945 Low Nov 17
- SUP 2: 106.920 Low Sep 25 and a key support
- SUP 3: 106.900 Round number support
- SUP 4: 106.830 Low Mar 27 (cont.)
A short-term bear cycle in Schatz futures remains intact. Recent weakness paves the way for an extension towards 106.920, the Sep 25 low and a key support. Clearance of this level would strengthen a bear theme. Initial firm resistance to watch is 107.029, the 20-day EMA. Resistance at the 50-day EMA is at 107.067. The area between the two averages represents a key short-term resistance zone.
GILT TECHS: (Z5) Bear Cycle Extends
- RES 4: 93.33 Low Nov 13 a gap high on the daily chart
- RES 3: 92.82 20-day EMA
- RES 2: 92.60 High Nov 18
- RES 1: 91.94 Low Nov 17
- PRICE: 91.70 @ Close Nov 19
- SUP 1: 91.59 Low Nov 19
- SUP 2: 91.01 High Oct 13 and a gap low on the daily chart
- SUP 3: 91.12 61.8% retracement of the Sep 3 - Nov 4 bull leg
- SUP 4: 91.01 Low Oct 13
A sharp sell-off in Gilt futures yesterday strengthens a bearish threat and cancels a recent bullish condition. The contract has traded through support at 91.82, the Sep 11 high, and the move down signals scope for a deeper retracement that opens 91.12, a Fibonacci retracement point. On the upside, initial key resistance is seen at 92.82, the 20-day EMA. A clear break of the average is required to signal a reversal.
BTP TECHS: (Z5) Corrective Cycle
- RES 4: 123.14 1.764 proj of the Sep 3 - 11 - 25 price swing
- RES 3: 122.81 1.618 proj of the Sep 3 - 11 - 25 price swing
- RES 2: 122.53 1.500 proj of the Sep 3 - 11 - 25 price swing
- RES 1: 121.94 High Oct 17 / 22 and the bull trigger
- PRICE: 120.81 @ Close Nov 20
- SUP 1: 120.53 Low Nov 14
- SUP 2: 120.15 50.0% retracement of the Sep 3 - Oct 17 bull leg
- SUP 3: 119.73 61.8% retracement of the Sep 3 - Oct 17 bull leg
- SUP 4: 119.07 Low Sep 25
The trend set-up in BTP futures is bullish and the latest pullback appears corrective. However, the contract has breached support at 120.74, the Aug 5 high, and pierced the 50-day EMA, at 120.76. A continuation lower would highlight potential for a deeper correction and expose 120.15, a Fibonacci retracement. Key resistance and the bull trigger has been defined at 121.94, the Oct 17 high. A break of this hurdle would resume the uptrend.
EQUITIES
EUROSTOXX50 TECHS: (Z5) Bearish Following Breach Of Support
- RES 4: 5858.59 1.618 proj of the Aug 1 - 22 - Sep 2 price swing
- RES 3: 5825.00 High Nov 13 and the bull trigger
- RES 2: 5744.00 High Nov 14
- RES 1: 5652.52 20-day EMA
- PRICE: 5541.00 @ 06:41 GMT Nov 19
- SUP 1: 5509.00 Low Nov 19
- SUP 2: 5503.00 50.0% retracement of the Aug 1 - Nov 13 bull cycle
- SUP 3: 5458.00 Low Sep 26
- SUP 4: 5427.01 61.8% retracement of the Aug 1 - Nov 13 bull cycle
A medium-term bull trend in EUROSTOXX 50 futures remains intact, however, recent weakness highlights a stronger corrective cycle. The contract has breached two key support points; 5601.75, the 50-day EMA, and 5615.50, the base of a bull channel drawn from the Aug 1 low. The breach signals scope for a deeper pullback and opens 5503.00, a Fibonacci retracement. Initial firm resistance to watch is 5652.52, the 20-day EMA.
E-MINI S&P: (Z5) Monitoring Resistance
- RES 4: 6993.12 3.500 proj of the Aug 20 - 28 - Sep 2 price swing
- RES 3: 6953.75 High Oct 30 and bull trigger
- RES 2: 6900.50 High Nov 12
- RES 1: 6767.81 20-day EMA
- PRICE: 6748.00 @ 07:04 GMT Nov 20
- SUP 1: 6594.00 Low Nov 18
- SUP 2: 6571.25 Low Oct 17
- SUP 3: 6540.25 Low Oct 10 and a key support
- SUP 4: 6476.62 23.6% retracement of the Apr 7 - Oct 30 uptrend
S&P E-Minis maintain a softer S/T tone - for now - despite the recovery from Tuesday’s low. The recent breach of 6655.70, the Nov 7 low cancels recent bullish signals and signals scope for an extension of the current corrective cycle. Note that price has also traded through support at the 50-day EMA. A resumption of weakness would open 6540.25, the Oct 10 low and the next key support. Initial firm resistance to watch is 6767.81, the 20-day EMA.
COMMODITIES
BRENT TECHS: (F6) Short-Term Resistance Remains Intact For Now
- RES 4: $71.45 - 76.4% retracement of the Jun 23 - Oct 20 bear leg
- RES 3: $70.69 - High Jul 30
- RES 2: $69.29 - High Sep 26 and a key resistance
- RES 1: $65.95 - High Oct 24
- PRICE: $63.67 @ 07:08 GMT Nov 20
- SUP 1: $59.97 - Low Nov 20 and the bear trigger
- SUP 2: $58.72 - Low May 5
- SUP 3: $57.99 - Low Apr 9 and a key support
- SUP 4: $56.05 - 2.00 proj of the Jul 30 - Aug 13 - Sep 26 price swing
Brent futures continue to trade inside a range. A sell-off on Nov 12 highlights a bearish development. A resumption of weakness would expose key support and the bear trigger at $59.97, the Oct 20 low. Clearance of this support would confirm a resumption of the bear cycle. Note it is still possible that a bullish corrective cycle remains in play. A move above resistance at $65.95, the Oct 24 high, would signal scope for a stronger recovery near-term.
WTI TECHS: (F6) Bear Threat Intact For Now
- RES 4: $71.38 - High Jun 23 and a key medium-term resistance
- RES 3: $67.16 - High Jul 30
- RES 2: $65.33 - High Sep 26 and key resistance
- RES 1: $61.84 - High Oct 24
- PRICE: $59.29 @ 07:20 GMT Nov 20
- SUP 1: $55.99 - Low Oct 20 and bear trigger
- SUP 2: $55.33 - Low May 1
- SUP 3: $54.72 - Low Apr 9 and a key support
- SUP 4: $53.53 - 1.764 proj of the Jul 30 - Aug 13 - Sep 26 price swing
WTI futures are trading in a range. A sell-off on Nov 12 strengthens a bearish theme. A resumption of the bear leg would pave the way for a move towards key support and the bear trigger at $55.99, the Oct 20 low. Clearance of this level would resume the downtrend. Note that it is still possible a bullish corrective cycle remains in play. Resistance to watch is $61.84, the Oct 24 high. Clearance of this hurdle would signal scope for a stronger correction.
GOLD TECHS: Trading Above Support
- RES 4: $4404.9 - 3.500 proj of the May 15 - Jun 16 - 30 price swing
- RES 3: $4381.5 - High Oct 20 and bull trigger
- RES 2: $4264.7 - 76.4% retracement of the Oct 20 - 28 correction
- RES 1: $4132.9/4245.2 - High Nov 19 / 13
- PRICE: $4062.1 @ 07:26 GMT Nov 20
- SUP 1: $3943.0 - 50-day EMA
- SUP 2: $3886.6 - Low Oct 28 and a reversal trigger
- SUP 3: $3800.00 Round number support
- SUP 4: $3760.9 - Low Sep 29
The bearish phase in Gold between Oct 20 and 28 appears to have been a correction and has allowed a recent overbought condition to unwind. The recovery since Oct 28 suggests that correction is over. Key support to watch lies at the 50-day EMA, at $3943.0. Clearance of this EMA would signal scope for a deeper retracement. The first short-term bull trigger has been defined at $4245.23, the Nov 13 high.
SILVER TECHS: Trend Structure Remains Bullish
- RES 4: $56.153 2.500 proj of the Aug 20 - Sep 16 - 17 price swing
- RES 3: $55.444 2.382 proj of the Aug 20 - Sep 16 - 17 price swing
- RES 2: $55.000 Round number resistance
- RES 1: $54.480 - High Oct 17 and the bull trigger
- PRICE: $50.9000 @ 08:11 GMT Nov 20
- SUP 1: $49.363 - Low Nov 18
- SUP 2: $47.671/45.557 - 50-day EMA / Low Oct 28
- SUP 3: $41.135 - Low Sep 17
- SUP 4: $38.087 - Low Aug 27
Trend signals in Silver remain bullish and the latest pullback appears corrective, for now. Support to watch lies at the 50-day EMA, at $47.671. A clear breach of this average would signal scope for a deeper retracement. On the upside, a resumption of gains would refocus attention on the bull trigger at $54.480, the Oct 17 high. Clearance of this level would confirm a resumption of the primary uptrend and open $55.444, a Fibonacci projection.