MNI DAILY TECHNICAL ANALYSIS - Bearish Break in USDCAD
Price Signal Summary – Bearish Break in USDCAD
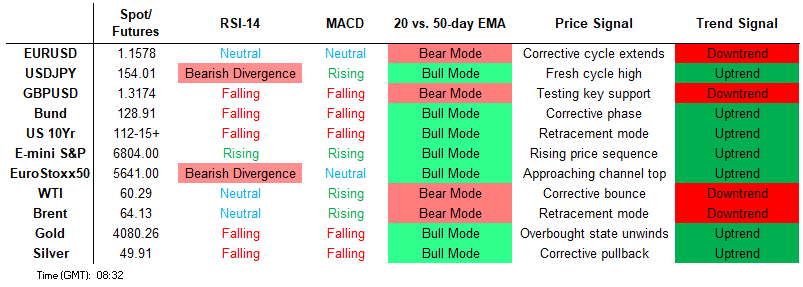
- The trend condition in S&P E-Minis remains bullish and the pullback since the Oct 30 high appears corrective. The contract has managed to find support below the 50-day EMA, currently at 6710.28 and a key support. A medium-term bull trend in EUROSTOXX 50 futures remains intact and recent weakness is considered corrective. Price has managed to find support below two important price points; the 50-day EMA, at 5576.77, and 5571.50, the base of a bull channel.
- A bear trend in GBPUSD remains intact and the latest recovery appears corrective. The move higher is allowing an oversold trend condition to unwind. Firm short-term resistance to watch is at the 20-day EMA, at 1.3237. The trend structure in USDJPY is unchanged, it remains bullish and the latest shallow pullback appears corrective. Moving average studies are in a bull-mode position, highlighting a dominant uptrend. Friday’s move lower in USDCAD highlights a potential bearish development and a possible reversal of the recent bull cycle. Last week’s gains stalled at the top of a bull channel, currently at 1.4147.
- The downleg in Gold that started Oct 20 appears to have been a correction and has allowed an overbought condition to unwind. Price remains above a key support area at the 50-day EMA, at $3880.7. Recent weakness in WTI futures appears to be a flag formation - a bullish continuation pattern. This suggests that a bullish corrective cycle remains intact for now. Price has recently traded through the 50-day EMA, at $60.87, signalling scope for a stronger recovery.
- A short-term bear cycle in Bund futures remains intact and the contract is trading lower this morning. The move down undermines a recent bear theme and the contract has cleared a number of important support points. The trend structure in Gilt futures remains bullish and a recent shallow correction reinforces this theme - for now. Note that moving average studies are in a bull-mode position, highlighting a dominant uptrend.
[CROSS ASSET]: Refreshing the MNI Tech Trend Monitor, Adding Gold, Silver, JPY
- We refresh our Global Tech Trend Monitor, adding longer-term techs for Spot Gold, Silver and USDJPY, while refreshing levels for UK Gilt 10y and 30y yields as well as the Europe Banking Stock Index (SX7E).
- See full document here: https://emedia.marketnews.com/marketnewsintl/MNITechTrendMonitorOct25.pdf
FOREIGN EXCHANGE
EURUSD TECHS: Monitoring Resistance
- RES 4: 1.1728 High Oct 17
- RES 3: 1.1669 High Oct 28 and key resistance
- RES 2: 1.1627 50-day EMA
- RES 1: 1.1587/91 20-day EMA / High Nov 7
- PRICE: 1.1562 @ 06:07 GMT Nov 10
- SUP 1: 1.1469 Low Nov 5 and the bear trigger
- SUP 2: 1.1425 1.500 proj of the Oct 17 - 22 - 28 price swing
- SUP 3: 1.1392 Low Aug 1 and bear trigger
- SUP 4: 1.1313 Low May 30
EURUSD has recovered from its recent lows. The move higher, for now, appears corrective. A short-term recovery is allowing a recent oversold condition to unwind. Resistance to watch is the 20-day EMA, at 1.1587. It has been pierced, a clear break of it would signal scope for an extension towards the 50-day EMA, at 1.1627. The trend remains bearish. A reversal would refocus attention on the bear trigger at 1.1469, the Nov 5 low.
GBPUSD TECHS: Corrective Cycle
- RES 4: 1.3471 High Oct 17 and a key short-term resistance
- RES 3: 1.3340 50-day EMA
- RES 2: 1.3237 20-day EMA
- RES 1: 1.3175 High Nov 7
- PRICE: 1.3153 @ 06:25 GMT Nov 10
- SUP 1: 1.3010 Low Nov 4 and 5 and the bear trigger
- SUP 2: 1.2971 1.382 proj of the Sep 17 - 25 - Oct 1 price swing
- SUP 3: 1.2945 50.0% retracement of the Jan 13 - Jul 1 bull leg
- SUP 4: 1.2877 1.618 proj of the Sep 17 - 25 - Oct 1 price swing
A bear trend in GBPUSD remains intact and the latest recovery appears corrective. The move higher is allowing an oversold trend condition to unwind. Firm short-term resistance to watch is at the 20-day EMA, at 1.3237. A break of this hurdle would signal scope for an extension towards the 50-day EMA, at 1.3340. A resumption of the downtrend would pave the way for an extension towards 1.2971. The bear trigger is 1.3010, the Nov 4 and 5 low.
EURGBP TECHS: Bullish Structure
- RES 4: 0.8865 1.764 proj of the Sep 15 - 25 - Oct 8 price swing
- RES 3: 0.8848 1.618 proj of the Sep 15 - 25 - Oct 8 price swing
- RES 2: 0.8835 High May 3 2023
- RES 1: 0.8830 High Nov 5
- PRICE: 0.8788 @ 06:42 GMT Nov 10
- SUP 1: 0.8763 Low Nov 3
- SUP 2: 0.8754 20-day EMA
- SUP 3: 0.8716 50-day EMA
- SUP 4: 0.8656 Low Oct 8 and a key support
A bullish condition in EURGBP remains intact and recent gains reinforce current conditions. The move higher has confirmed a resumption of the uptrend and maintains a bullish price sequence of higher highs and higher lows. Sights are on 0.8835, the May 3 2023 high. Initial support lies at 0.8763, the Nov 3 low and just above the 20-day EMA, at 0.8755. Note that the trend is overbought, a pullback would be considered corrective.
USDJPY TECHS: Trend Needle Points North
- RES 4: 155.89 High Feb 3
- RES 3: 155.53 2.00% retracement of the Jan 10 - Apr 22 bear leg
- RES 2: 154.80 High Feb 12
- RES 1: 154.48 High Nov 4 and the bull trigger
- PRICE: 154.04 @ 06:54 GMT Nov 10
- SUP 1: 152.55 20-day EMA
- SUP 2: 151.54 Low Oct 29
- SUP 3: 150.77 50-day EMA
- SUP 4: 149.38 Low Oct 17
The trend structure in USDJPY is unchanged, it remains bullish and the latest shallow pullback appears corrective. Moving average studies are in a bull-mode position, highlighting a dominant uptrend. The bull trigger is 154.48, the Nov 4 high. A break of this level would confirm a resumption of the uptrend and open 154.80, the Feb 12 high. First important support to watch lies at 152.46, the 20-day EMA.
EURJPY TECHS: Bullish Trend Sequence
- RES 4: 180.37 1.500 proj of the Jul 31 - Sep 29 - Oct 2 price swing
- RES 3: 180.00 Psychological round number
- RES 2: 178.94 1.236 proj of the Jul 31 - Sep 29 - Oct 2 price swing
- RES 1: 178.82 High Oct 30 and the bull trigger
- PRICE: 178.13 @ 07:14 GMT Nov 10
- SUP 1: 175.29 50-day EMA
- SUP 2: 174.82 Low Oct 17
- SUP 3: 173.92 Low Oct 6 and a gap high on the daily chart
- SUP 4: 173.77 Bull channel support drawn from the Feb 28 low
The trend in EURJPY remains bullish and a price sequence of higher highs and higher lows is intact. Moving average studies are in a bull-mode position too, highlighting a dominant uptrend. Recent gains signal scope for an extension towards 178.94 next, a 1.236 projection of the Jul 31 - Sep 29 - Oct 2 price swing. Support to watch lies at the 50-day EMA, at 175.29. A clear break of this EMA would signal scope for a deeper retracement.
AUDUSD TECHS: Bear Threat Remains Present Despite S/T Gains
- RES 4: 0.6707 High Sep 17 and a bull trigger
- RES 3: 0.6663 2.0% 10-dma Envelope
- RES 2: 0.6644 76.4% retracement of the Sep-Oct bear leg
- RES 1: 0.6537/0.6618 50-day EMA / High Oct 29
- PRICE: 0.6531 @ 08:05 GMT Nov 10
- SUP 1: 0.6459 Low Nov 5
- SUP 2: 0.6440 Low Oct 14 and key support
- SUP 3: 0.6415 Low Aug 21 / 22 and a bear trigger
- SUP 4: 0.6373 Low Jun 23
Despite today’s early gains, a bearish short-term tone in AUDUSD remains intact. The recent breach of the 50-day EMA undermines a recent bullish theme. This has exposed the next key support at 0.6440, the Oct 14 low. Key resistance and a short-term bull trigger is at 0.6618, the Oct 29 high. Initial resistance to monitor is at 0.6537, the 50-day EMA. A clear break of the average would strengthen a bullish case.
USDCAD TECHS: Breaches Support At The 20-Day EMA
- RES 4: 1.4274 High Apr 9
- RES 3: 1.4200 Round number resistance
- RES 2: 1.4167 50.0% retracement of the Feb 3 - Jun 16 bear leg
- RES 1: 1.4147 Channel top drawn from Jul 23 low
- PRICE: 1.4012 @ 08:10 GMT Nov 10
- SUP 1: 1.4011 Intraday low
- SUP 2: 1.3952 50-day EMA
- SUP 3: 1.3888 Low Oct 29 and a key support
- SUP 4: 1.3870 Bull channel base drawn from the Jul 23 low
Friday’s move lower in USDCAD highlights a potential bearish development and a possible reversal of the recent bull cycle. Last week’s gains stalled at the top of a bull channel, currently at 1.4147. The bull channel is drawn from the Jul 23 low. The pair has today breached support at the 20-day EMA, at 1.4021. This exposes the 50-day EMA at 1.3952. For bulls, a break of the channel top would confirm a resumption of the uptrend.
FIXED INCOME
BUND TECHS: (Z5) Bear Leg Extends
- RES 4: 130.59 High Oct 17 and the bull trigger
- RES 3: 130.07 High Oct 24
- RES 2: 129.73 High Oct 28
- RES 1: 129.33 20-day EMA
- PRICE: 128.82 @ 05:44 GMT Nov 10
- SUP 1: 128.70 Low Oct 10
- SUP 2: 128.52 76.4% retracement of the Sep 25 - Oct 17 bull leg
- SUP 3: 128.25 Low Oct 7
- SUP 4: 127.88 Low Sep 25 and key support
A short-term bear cycle in Bund futures remains intact and the contract is trading lower this morning. The move down undermines a recent bear theme and the contract has cleared a number of important support points. The 50-day EMA, at 129.14, has been cleared and price is through 128.92, the 61.8% retracement of the Sep 25 - Oct 17 bull leg. Sights are on 128.52, the 76.4% retracement. Resistance is at 129.33, the 20-day EMA.
BOBL TECHS: (Z5) Bearish Theme
- RES 4: 118.970 High Oct 17 and key resistance
- RES 3: 118.770 High Oct 22
- RES 2: 118.360/600 High Oct 28 / 24
- RES 1: 118.213 20-day EMA.
- PRICE: 117.980 @ 05:42 GMT Nov 10
- SUP 1: 117.900 Low Oct 10
- SUP 2: 117.824 76.4% retracement of the Sep 25 - Oct 17 bull cycle
- SUP 3: 117.710 Low Oct 6
- SUP 4: 117.630 Low Oct 1
A short-term bear cycle in Bobl futures remains intact for now. The contract is trading lower today as it starts the week on a bearish note. Price is through 118.043, 61.8% of the Sep 25 - Oct 17 bull cycle. This signals scope for an extension towards 117.824, the 76.4% Fibonacci projection. Initial resistance is seen at 118.213, the 20-day EMA. A clear break of the EMA would signal a possible reversal.
SCHATZ TECHS: (Z5) Resistance Remains Intact For Now
- RES 4: 107.348 50.0% retracement of Apr 7 - Sep 25 bear leg (cont)
- RES 3: 107.320 High Oct 17 and the bull trigger
- RES 2: 107.235 High Oct 22
- RES 1: 107.094/175 50-day EMA / High Oct 24
- PRICE: 107.015 @ 05:58 GMT Nov 10
- SUP 1: 107.010 Low Oct 30 and the bear trigger
- SUP 2: 106.995 Low Oct 8
- SUP 3: 106.965 Low Oct 6
- SUP 4: 106.920 Low Sep 25 and a key support
Schatz futures are trading at their recent lows. A short-term bear cycle remains intact - for now. The downleg that started Oct 17 is considered corrective and has allowed a recent overbought trend condition to unwind. Note that 107.014, 76.4% of the Sep 25 - Oct 17 bull leg and the next important support, has been pierced. A clear break of it would signal scope for a deeper retracement. Initial resistance is at 107.094, the 50-day EMA.
GILT TECHS: (Z5) Pullback Considered Corrective
- RES 4: 94.60 1.764proj of the Sep 3 - 11 - 26 price swing
- RES 3: 94.24 1.618 proj of the Sep 3 - 11 - 26 price swing
- RES 2: 94.00 Round number resistance
- RES 1: 93.98 High Nov 4 and the bull trigger
- PRICE: 92.92 @ 08:18 GMT Nov 10
- SUP 1: 92.98/75 20-day EMA / Intraday low
- SUP 2: 92.38 Low Oct 20
- SUP 3: 92.26 50-day EMA
- SUP 4: 91.82 High Sep 11
The trend structure in Gilt futures remains bullish and a recent shallow correction reinforces this theme - for now. Note that moving average studies are in a bull-mode position, highlighting a dominant uptrend. Support to watch lies at 92.98, the 20-day EMA. It has been pierced, a clear break of it would signal scope for a deeper correction and allow a recent overbought trend condition to unwind. The bull trigger is 93.98, the Nov 4 high.
BTP TECHS: (Z5) Unwinding An Overbought Trend Condition
- RES 4: 123.14 1.764 proj of the Sep 3 - 11 - 25 price swing
- RES 3: 122.81 1.618 proj of the Sep 3 - 11 - 25 price swing
- RES 2: 122.53 1.500 proj of the Sep 3 - 11 - 25 price swing
- RES 1: 121.94 High Oct 17 / 22 and the bull trigger
- PRICE: 121.02 @ Close Nov 7
- SUP 1: 120.74 High Aug 5 and a recent breakout level
- SUP 2: 120.60 50-day EMA
- SUP 3: 120.13 Low Oct 10
- SUP 4: 119.48 Low Oct 7
The trend set-up in BTP futures remains bullish and recent weakness - for now - appears corrective. Note the moving average studies are in a bull-mode position, highlighting a dominant uptrend. The bull trigger is 121.94, the Oct 17 / 24 high. Initial firm support to watch is 120.74, the Aug 5 high. The contract is overbought, a deeper retracement would allow this condition to unwind.
EQUITIES
EUROSTOXX50 TECHS: (Z5) Support Remains Intact For Now
- RES 4: 5826.00 Bull channel top drawn from the Aug 1 low
- RES 3: 5800.00 Round number resistance
- RES 2: 5777.41 1.382 proj of the Aug 1 - 22 - Sep 2 price swing
- RES 1: 5696.00/5742.00 High Nov 5 / High Oct 29 and the bull trigger
- PRICE: 5648.00 @ 06:33 GMT Nov 10
- SUP 1: 5576.77 50-day EMA
- SUP 2: 5571.50 Bear channel base drawn from the Aug 1 low
- SUP 3: 5527.70 38.2% retracement of the Aug 1 - Oct 29 bull leg
- SUP 4: 5497.00 Low Oct 14
A medium-term bull trend in EUROSTOXX 50 futures remains intact and recent weakness is considered corrective. Price has managed to find support below two important price points; the 50-day EMA, at 5576.77, and 5571.50, the base of a bull channel drawn from the Aug 1 low. A clear break of both levels would strengthen a bear theme and highlight a stronger reversal. The bull trigger is 5742.00, the Oct 29 high.
E-MINI S&P: (Z5) Doji Reversal Candle
- RES 4: 7000.00 Psychological round number
- RES 3: 6993.12 3.500 proj of the Aug 20 - 28 - Sep 2 price swing
- RES 2: 6974.04 3.382 proj of the Aug 20 - 28 - Sep 2 price swing
- RES 1: 6857.75/6953.75 High Nov 5 / High Oct 30 and the bull trigger
- PRICE: 6801.50 @ 07:27 GMT Nov 10
- SUP 1: 6655.70 Low Nov 7 and key short-term support
- SUP 2: 6571.25 Low Oct 17
- SUP 3: 6540.25 Low Oct 10 and a key support
- SUP 4: 6476.62 23.6% retracement of the Apr 7 - Oct 30 bull cycle
The trend condition in S&P E-Minis remains bullish and the pullback since the Oct 30 high appears corrective. The contract has managed to find support below the 50-day EMA, currently at 6710.28 and a key support. Friday’s activity also highlights a potential reversal signal - a bullish doji candle. This defines key support at 6655.50, the Oct 7 low. A continuation higher would signal the end of a correction and open 6953.75, Oct 30 high and bull trigger.
COMMODITIES
BRENT TECHS: (F6) Bull Flag Suggest Corrective Cycle Remains Intact
- RES 4: $71.45 - 76.4% retracement of the Jun 23 - Oct 20 bear leg
- RES 3: $70.69 - High Jul 30
- RES 2: $69.29 - High Sep 26 and a key resistance
- RES 1: $65.98 - High Oct 9
- PRICE: $64.16 @ 07:09 GMT Nov 10
- SUP 1: $62.84/59.97 - Low Nov 6 / 20 and the bear trigger
- SUP 2: $58.72 - Low May 5
- SUP 3: $57.99 - Low Apr 9 and a key support
- SUP 4: $56.05 - 2.00 proj of the Jul 30 - Aug 13 - Sep 26 price swing
The latest pullback in Brent futures appears to be a flag formation - a bullish continuation pattern. This suggests that a corrective cycle remains intact for now. Price has recently traded through the 50-day EMA, at $64.58. Clearance of this hurdle signals scope for a stronger recovery. The next resistance to monitor is $65.98, the Oct 9 high. A clear breach of it would expose a key resistance at $69.29, the Sep 26 high. Key support lies at $59.97, Oct 20 low.
WTI TECHS: (Z5) Bullish Short-Term Price Pattern
- RES 4: $71.47 - High Jun 23 and a key medium-term resistance
- RES 3: $67.68 - High Jul 30
- RES 2: $65.77/68.43 - High Sep 26 and key resistance
- RES 1: $62.59 - High Oct 24
- PRICE: $60.22 @ 07:19 GMT Nov 10
- SUP 1: $58.83/55.96 - Low Nov 6 / Low Oct 20 and bear trigger
- SUP 2: $54.85 - Low May 5
- SUP 3: $54.16 - Low Apr 9 and a key support
- SUP 4: $53.23 - 1.764 proj of the Jul 30 - Aug 13 - Sep 26 price swing
Recent weakness in WTI futures appears to be a flag formation - a bullish continuation pattern. This suggests that a bullish corrective cycle remains intact for now. Price has recently traded through the 50-day EMA, at $60.87, signalling scope for a stronger recovery. Note too that resistance at $62.34, the Oct 8 high, has been pierced. A clear move through it would expose key resistance at $65.77, Sep 26 high. The bear trigger is $55.96, the Oct 20 low.
GOLD TECHS: Key Support Is Intact
- RES 4: $4404.9 - 3.500 proj of the May 15 - Jun 16 - 30 price swing
- RES 3: $4400.0 - Round number resistance
- RES 2: $4381.5 - High Oct 20 and bull trigger
- RES 1: $4161.4 - High Oct 22
- PRICE: $4075.1 @ 07:27 GMT Nov 10
- SUP 1: $3886.6 - Low Oct 28
- SUP 2: $3880.7 - 50-day EMA
- SUP 3: $3800.00 Round number support
- SUP 4: $3751.3 - 50.0% retracement of the May 15 - Oct 20 bull leg
The downleg in Gold that started Oct 20 appears to have been a correction and has allowed an overbought condition to unwind. Price remains above a key support area at the 50-day EMA, at $3880.7. Clearance of this EMA would strengthen a short-term bear theme and signal scope for a deeper retracement. Initial resistance is at $4161.4, the Oct 22 high. A stronger recovery would refocus attention on $4381.5, the Oct 20 high and bull trigger.
SILVER TECHS: Trading Above Support
- RES 4: $56.153 2.500 proj of the Aug 20 - Sep 16 - 17 price swing
- RES 3: $55.444 2.382 proj of the Aug 20 - Sep 16 - 17 price swing
- RES 2: $54.480 - High Oct 17 and the bull trigger
- RES 1: $51.071 - 61.8% retracement of Oct 17 - 28 bear leg
- PRICE: $49.888 @ 08:19 GMT Nov 10
- SUP 1: $46.320/45.557 - 50-day EMA / Low Oct 28
- SUP 2: $41.135 - Low Sep 17
- SUP 3: $40.000 - Round number support
- SUP 4: $38.087 - Low Aug 27
Trend signals in Silver remain bullish and recent weakness is considered corrective. The trend has recently been in overbought territory and the retracement has allowed this to unwind. Price remains above support at the 50-day EMA, at $46.320. A clear break of the average would signal scope for a deeper retracement. Key resistance has been defined at $54.480, the Oct 17 high. Initial resistance is $51.071, a Fibonacci retracement.