MNI DAILY TECHNICAL ANALYSIS - Bear Cycle Grips Global Stocks
Price Signal Summary – Bear Cycle Grips Global Equities
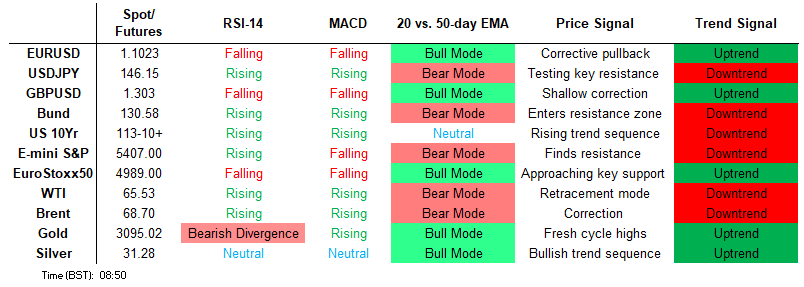
- S&P E-Minis have traded in a volatile manner and traded sharply lower. A bearish theme remains intact and the latest fresh cycle lows, strengthens current conditions. A resumption of weakness would signal scope for an extension towards 5366.97. Eurostoxx 50 futures remain in a bear cycle following recent weakness and the latest fresh cycle lows strengthen the bearish condition. The sell-off has resulted in a break of support at 5229.00.
- EURUSD is holding on to its latest gains and maintains a firmer tone. The pair has breached key short-term resistance at 1.0955, the Mar 18 high. Clearance of this level confirms a resumption of the uptrend and paves the way for a climb towards 1.1188. USDJPY traded sharply lower Thursday, extending the pullback from the recent 151.21 high on Mar 28. The trend condition is bearish and note that key support and the bear trigger at 146.54, the Mar 11 low, has been breached. USDCAD traded sharply lower Thursday. The move down has confirmed a clear reversal of the bull cycle between Sep 25 ‘24 and Feb 3. Price is through a key support at 1.4151, the Feb 14 low.
- The trend condition in Gold is unchanged, it remains bullish and Thursday’s fresh cycle high reinforces current conditions. Moving average studies remain in a bull-mode position highlighting a dominant uptrend and positive market sentiment. WTI futures traded sharply lower Thursday as the reversal from Wednesday’s high accelerates. The move down has resulted in a break of both the 20- and 50-day EMAs and undermines the recent bullish theme.
- A bull cycle in Bund futures remains in play and the contract is once again trading higher. Fresh short-term cycle highs signal scope for a continuation of the uptrend. Gilt futures maintain a firmer tone and today’s gap higher reinforces current bullish conditions. A key resistance 93.79, the Mar 4 high, has been cleared. The break strengthens a bullish condition and exposes 94.00, where a break would open 94.35.
FOREIGN EXCHANGE
EURUSD TECHS: Trend Needle Points North
- RES 4: 1.1276 High Jul 18 ‘23
- RES 3: 1.1214 High Sep 25 2024 and a key resistance
- RES 2: 1.1188 0.764 proj of the Feb 28 - Mar 18 - 27 price swing
- RES 1: 1.1144 High Oct 1 2024 / High Apr 3
- PRICE: 1.1098 @ 06:14 BST Apr 4
- SUP 1: 1.0955 High Mar 18 and a recent breakout level
- SUP 2: 1.0810 20-day EMA
- SUP 3: 1.0733 Low Mar 27 and a key short-term support
- SUP 4: 1.0684 50-day EMA and a short-term pivot level
EURUSD is holding on to its latest gains and maintains a firmer tone. The pair has breached key short-term resistance at 1.0955, the Mar 18 high. Clearance of this level confirms a resumption of the uptrend and paves the way for a climb towards 1.1188 next, a Fibonacci projection. Moving average studies remain in a bull-mode position highlighting a dominant uptrend. Key trend support has been defined at 1.0733, the Mar 27 low.
GBPUSD TECHS: Bulls Remain In The Driver’s Seat
- RES 4: 1.3434 High Sep 26 ‘24 and a key resistance
- RES 3: 1.3305 High Oct 2 ‘24
- RES 2: 1.3274 High Oct 3 ‘24
- RES 1: 1.3207 High Apr 3
- PRICE: 1.3110 @ 06:26 BST Apr 4
- SUP 1: 1.3015 High Mar 20 and a recent breakout level
- SUP 2: 1.2921/1.2871 20-day EMA / Low Mar 27 and key support
- SUP 3: 1.2788 50-day EMA
- SUP 4: 1.2679 Low Mar 4
Thursday’s gains in GBPUSD resulted in a break of resistance at 1.3015, the Mar 20 high, to confirm a resumption of the uptrend that started Jan 13. This maintains the bullish price sequence of higher highs and higher lows and note too that moving average studies remain in a bull-mode position, highlighting a dominant uptrend. The rally signals scope for a climb towards 1.3274, the Oct 3 ‘24 high. Key short-term support is 1.2871, the Mar 27 low.
EURGBP TECHS: Approaching Key Resistance
- RES 4: 0.8530 76.4% retracement of the Aug 8 - Dec 19 ‘24 bear leg
- RES 3: 0.8523 High Aug 22 ‘24
- RES 2: 0.8494 High Aug 26 ‘24
- RES 1: 0.8474 High Jan 20 and a key resistance
- PRICE: 0.8463 @ 06:49 BST Apr 4
- SUP 1: 0.8432/0.8366 Intraday low / 20-day EMA
- SUP 2: 0.8316 Low Mar 28 and a key near-term support
- SUP 3: 0.8299 Low Mar 5
- SUP 4: 0.8251 Low Mar 4
EURGBP traded sharply higher Thursday and the contract maintains a firmer tone. The rally confirms a reversal of the Mar 11 - 28 correction and also potentially highlights a resumption of the uptrend. The next key resistance is 0.8474, the Jan 20 high. Clearance of this hurdle would highlight an important technical break and strengthen a bullish condition. This would open 0.8494, the Aug 26 ‘24 high. Initial firm support is seen at 0.8359, the 20-day EMA.
USDJPY TECHS: Bear Threat Remains Present
- RES 4: 151.30 High Mar 3
- RES 3: 150.57/151.21 50-day EMA / High Mar 28 and reversal trigger
- RES 2: 149.35 20-day EMA
- RES 1: 148.18 Low Mar 20
- PRICE: 145.85 @ 06:59 BST Apr 4
- SUP 1: 145.20 Low Apr 03
- SUP 2: 145.00 Round number support
- SUP 3: 144.13 76.4% retracement of the Sep 16 ‘24 - Jan 10 bull leg
- SUP 4: 142.95 1.00 proj of the Feb 12 - Mar 11 - 28 price swing
USDJPY traded sharply lower Thursday, extending the pullback from the recent 151.21 high on Mar 28. The trend condition is bearish and note that key support and the bear trigger at 146.54, the Mar 11 low, has been breached, to confirm a resumption on the downtrend. Sights are on 145.00 next and 144.13, a Fibonacci retracement point. On the upside, a move above the Mar 28 high is required to signal a reversal.
EURJPY TECHS: Monitoring Support At The 50-Day EMA
- RES 4: 165.43 High Nov 8
- RES 3: 164.90 High Dec 30 ‘24 and a key medium-term resistance
- RES 2: 164.55 High Jan 7
- RES 1: 163.04/164.19 High Apr 3 / High Mar 18 and the bull trigger
- PRICE: 161.61 @ 07:26 GMT Apr 4
- SUP 1: 160.82/12 50-day EMA / Low Apr 3
- SUP 2: 160.06 Low Mar 13
- SUP 3: 158.90 Low Mar 10
- SUP 4: 158.39 61.8% retracement of the Feb 28 - Mar 18 bull cycle
The trend structure in EURJPY is unchanged, it remains bullish and recent weakness appears corrective - for now. The pullback has allowed an overbought condition to unwind. Pivot support is 160.82, the 50-day EMA. It has been pierced, a clear break of the EMA would signal potential for a deeper retracement, towards 160.06 initially, Mar 13 low. For bulls, clearance of 164.19, the Mar 18 high, would confirm a resumption of the uptrend.
AUDUSD TECHS: Remains Above Support For Now
- RES 4: 0.6471 High Dec 9
- RES 3: 0.6414 38.2% retracement of the Sep 30 ‘24 - Feb 3 bear leg
- RES 2: 0.6409 High Feb 21 and a bull trigger
- RES 1: 0.6389 High APr 3
- PRICE: 0.6238 @ 08:03 BST Apr 4
- SUP 1: 0.6219 Low Mar 31
- SUP 2: 0.6187 Low Feb 4
- SUP 3: 0.6171/6088 Low Feb 4 / 3 and a key support
- SUP 4: 0.6045 1.500 proj of the Sep 30 - Nov 6 - 7 price swing
AUDUSD is trading lower today but for now, continues to trade above Monday’s 0.6219 low. Attention remains on key short-term resistance at 0.6409, the Feb 21 high. Clearance of this level would confirm a resumption of the short-term bull cycle and signal scope for a climb towards 0.6471, the Dec 9 2024 high. On the downside, the first key support to watch is 0.6219, the Mar 31 low, where a break is required to reinstate a bearish threat.
USDCAD TECHS: Bearish Structure
- RES 4: 1.4452/4543 High Mar 13 / 4 and a bull trigger
- RES 3: 1.4415 High Apr 1
- RES 2: 1.4308 50-day EMA
- RES 1: 1.4151 Low Feb 14 and a recent breakout level
- PRICE: 1.4117 @ 08:06 BST Apr 4
- SUP 1: 1.4028 Low Apr 3
- SUP 2: 1.3986 Low Dec 2 ‘24
- SUP 3: 1.3944 61.8% retracement of Sep 25 ‘24 - Feb 3 bull run
- SUP 4: 1.3894 Low Nov 11 ‘24
USDCAD traded sharply lower Thursday. The move down has confirmed a clear reversal of the bull cycle between Sep 25 ‘24 and Feb 3. Price is through a key support at 1.4151, the Feb 14 low. This signals scope for an extension towards 1.3944, a Fibonacci retracement. On the upside, key short-term resistance is seen at 1.4308, the 50-day EMA. Initial resistance is the 1.4151 level (Feb 14 low).
FIXED INCOME
BUND TECHS: (M5) Bull Cycle Remains In Play
- RES 4: 132.04 High Mar 3
- RES 3: 131.14 76.4% retracement of the Feb 28 - Mar 11 bear leg
- RES 2: 130.88 Low Mar 3
- RES 1: 130.48 Intraday high
- PRICE: 130.43 @ 08:10 BST Apr 4
- SUP 1: 128.86/128.47 20-day EMA / Low Mar 28
- SUP 2: 127.74 Low Mar 25 and a key short-term support
- SUP 3: 127.20 Low Mar 17
- SUP 4: 126.53 Low Mar 11 and the bear trigger
A bull cycle in Bund futures remains in play and the contract is once again trading higher. Fresh short-term cycle highs signal scope for a continuation of the uptrend. The contract has cleared 130.26, the 61.8% retracement of the Feb 28 - Mar 11 bear leg. Clearance of this level strengthens the bullish condition and opens 130.88, the Mar 13 low. Initial firm support to watch lies at 128.86, the 20-day EMA.
BOBL TECHS: (M5) Northbound
- RES 4: 119.040 High Feb 28 and a key resistance
- RES 3: 118.950 High Mar 4
- RES 2: 118.852 2.382 proj of the Mar 6 - 11 - 12 price swing
- RES 1: 118.800 Intraday high
- PRICE: 118.740 @ 08:23 BST Apr 4
- SUP 1: 118.140/117.641 Low Apr 3 / 20-day EMA
- SUP 2: 117.410 Low Mar 27
- SUP 3: 117.080 Low Mar 25 and a ey short-term support
- SUP 4: 116.800 Low Mar 17
Bobl futures have traded to a fresh short-term cycle high once again, today. The contract has cleared 118.382, the 76.4% retracement of the bear leg between Feb 28 - Mar 6. The breach of this price point strengthens current bullish conditions and paves the way for a climb towards 119.040, the Feb 28 high and a key resistance. On the downside, initial firm support to watch lies at 117.641, the 20-day EMA.
SCHATZ TECHS: (M5) Has Cleared Key Resistance
- RES 4: 107.393 1.382 retracement proj of the Mar 4 - 6 bear leg
- RES 3: 107.365 High Dec 12 ‘24 a(cont) and a key resistance
- RES 2: 107.289 1.236 retracement proj of the Mar 4 - 6 bear leg
- RES 1: 107.275 Intraday high
- PRICE: 107.250 @ 08:24 BST Apr 4
- SUP 1: 107.080 Low Apr 3
- SUP 2: 106.930 Low Apr 2
- SUP 3: 106.864 20-day EMA
- SUP 4: 106.715 Low Mar 25
Schatz futures maintain a firmer tone and today’s fresh cycle high once again, reinforces a bullish theme. The contract has traded through a key resistance at 107.120, the Mar 4 high. This confirms a full reversal of the Apr 3 - 6 impulsive sell-off. The break also highlights a stronger bull cycle and signals scope for a climb towards 107.289 next, a Fibonacci projection. Initial firm support is seen at 106.864, the 20-day EMA.
GILT TECHS: (M5) Clears Key Resistance
- RES 4: 95.00 Round number resistance
- RES 3: 94.75 76.4% retracement of the Dec 3 - Jan 13 bear leg (cont)
- RES 2: 94.35 High Feb 6 (cont)
- RES 1: 94.00 Round number resistance
- PRICE: 93.92 @ 08:11 BST Apr 4
- SUP 1: 93.01 High Mar 20
- SUP 2: 91.97 20-day EMA
- SUP 3: 91.59 Low Mar 31
- SUP 4: 91.03 Low mar 28
Gilt futures maintain a firmer tone and today’s gap higher reinforces current bullish conditions. A key resistance 93.79, the Mar 4 high, has been cleared. The break strengthens a bullish condition and exposes 94.00, where a break would open 94.35, the Feb 6 high on the continuation chart. On the downside, initial support lies at 93.01, the Mar 20 high. A firmer support is seen at 91.97, the 20-day EMA.
BTP TECHS: (M5) Bull Phase Still In Play
- RES 4: 120.39 High Feb 28 and a key resistance
- RES 3: 119.31 Low Mar 4 and a gap high on the daily chart
- RES 2: 119.00 Round number resistance
- RES 1: 118.89 Intraday high
- PRICE: 118.82 @ 08:25 BST Apr 4
- SUP 1: 117.64 20-day EMA
- SUP 2: 116.89 Low Mar 25 and a key short-term support
- SUP 3: 116.15 Low Mar 17
- SUP 4: 115.75 Low Mar 14
BTP futures maintain a firmer short-term tone. A continuation of the bull phase signals scope for an extension towards 119.00. The 61.8% retracement of the Feb 28 - Mar 14 bear leg has been cleared, the clear strengthens the bullish theme. On the downside, initial firm support to watch is 117.64, the 20-day EMA. A break of this average would highlight a potential reversal.
EQUITIES
EUROSTOXX50 TECHS: (M5) Southbound
- RES 4: 5341.00 High Mar 27
- RES 3: 5299.50 20-day EMA
- RES 2: 5229.00 Low Mar 11 and a recent breakout level
- RES 1: 5157.00 Low Mar 31
- PRICE: 5026.00 @ 06:42 BST Apr 4
- SUP 1: 5000.00 Round number support
- SUP 2: 4964.73 1.764 proj of the Mar 3 - 11 - 19 price swing
- SUP 3: 4931.00 Low Jan 13 (cont)
- SUP 4: 4905.74 76.4% retracement of the Nov 19 ‘ 24 - Mar 3 bull leg
Eurostoxx 50 futures remain in a bear cycle following recent weakness and the latest fresh cycle lows strengthen the bearish condition. The sell-off has resulted in a break of support at 5229.00, the Mar 11 low. The contract has breached 5079.00, the Feb 3 low, and sights are on the 5000.00 handle next, a Fibonacci projection. Initial firm resistance is 5299.50, the 20-day EMA. A clear break of this average is required to highlight a reversal.
E-MINI S&P: (M5) Impulsive Bear Cycle Remains Intact
- RES 4: 5837.25 High Mar 25 and a reversal trigger
- RES 3: 5773.25 High Apr 2
- RES 2: 5723.04 20-day EMA
- RES 1: 5564.75 High Apr 3
- PRICE: 5417.00 @ 07:24 BST Apr 4
- SUP 1: 5380.50 Intraday low
- SUP 2: 5366.97 76.4% of the Aug 5 ‘24 - Feb 19 bull leg (cont)
- SUP 3: 5396.00 2.382 proj of the Dec 6 ‘24 - Jan 13 - Feb 19 swing
- SUP 4: 5329.00 0764 proj of the Feb 19 - Mar 13 - 25 price swing
S&P E-Minis have traded in a volatile manner and traded sharply lower. A bearish theme remains intact and the latest fresh cycle lows, strengthens current conditions. A resumption of weakness would signal scope for an extension towards 5366.97, a Fibonacci retracement. Moving average studies are in a bear-mode position, highlighting a dominant downtrend. Key short-term resistance has been defined at 5837.25, the Mar 25 high.
COMMODITIES
BRENT TECHS: (M5) Impulsive Reversal
- RES 4: $78.96 - High Jan 15 and a reversal trigger
- RES 3: $77.75 - High Jan 20
- RES 2: $76.26 - High Feb 20
- RES 1: $72.59/75.47 - 50-day EMA / High Apr 2 and a bull trigger
- PRICE: $69.55 @ 07:00 BST Apr 4
- SUP 1: $69.28 - Intraday low
- SUP 2: $67.95 - Low Mar 5 and the bear trigger
- SUP 3: $67.87 - Low Sep 10 ‘24 and a key medium-term support
- SUP 4: $66.55 1.618 proj of the Jan 15 - Feb 4 - 20 price swing
Brent futures have traded in a volatile manner and also traded sharply lower this week. The move down cancels a recent bullish theme. Price has traded through both the 20- and 50-day EMAs. This signals scope for a continuation towards $67.95, the Mar 5 low and a key support. A break of this level would strengthen a bearish theme. On the upside, key resistance has been defined at $75.47, the Apr 2 high.
WTI TECHS: (K5) Strong Reversal
- RES 4: $76.57 - High Jan 15 and the bull trigger
- RES 3: $74.66 - High Jan 22
- RES 2: $72.91 - High Feb 11
- RES 1: $69.34/$72.28 - 50-day EMA / High Apr 2 and key resistance
- PRICE: $66.40 @ 07:08 BST Apr 4
- SUP 1: $65.98 - Low Apr 3
- SUP 2: $64.85 - Low Mar 5 and the bear trigger
- SUP 3: $63.73 - Low Sep 10 ‘24 and a key medium-term support
- SUP 4: $60.98 - 1.764 proj of the Jan 15 - Feb 4 - 11 price swing
WTI futures traded sharply lower Thursday as the reversal from Wednesday’s high accelerates. The move down has resulted in a break of both the 20- and 50-day EMAs and undermines the recent bullish theme. A continuation lower would signal scope for a move towards key support at $64.85, the Mar 5 low. Key resistance has been defined at $72.28,Wednesday’s high, where a break is required to reinstate a bull theme.
GOLD TECHS: Trend Needle Points North
- RES 4: $3223.8 - 3.382 proj of the Nov 14 - Dec 12 - 19 price swing
- RES 3: $3200.00 - Round number resistance
- RES 2: $3196.2 - 3.236 proj of the Nov 14 - Dec 12 - 19 price swing
- RES 1: $3167.8 - High Apr 3
- PRICE: $3107.6 @ 07:14 BST Apr 4
- SUP 1: $3054.3 - Low Apr 3
- SUP 2: $3035.0 - 20-day EMA
- SUP 3: $2999.5 - Low Mar 21
- SUP 4: $2932.8 - 50-day EMA
The trend condition in Gold is unchanged, it remains bullish and Thursday’s fresh cycle high reinforces current conditions. Moving average studies remain in a bull-mode position highlighting a dominant uptrend and positive market sentiment. The next upside objective is $3196.2, a Fibonacci projection, ahead of the $3200.0 handle. On the downside, key short-term support lies at $2939.9, the 20-day EMA.
SILVER TECHS: Impulsive Reversal Wave
- RES 4: $35.463 - 1.000 proj of the Dec 19 - Feb 14 - 28 price swing
- RES 3: $34.903 - High Oct 23 ‘24 and the bull trigger
- RES 2: $33.301/34.590 - 20-day EMA / High Mar 28
- RES 1: $32.610 - 50-day EMA
- PRICE: $31.419 @ 08:10 BST Apr 4
- SUP 1: $31.126 - Low Mar 3
- SUP 2: $30.815 - Low Feb 28 and key support
- SUP 3: $30.127 - 76.4% of the Dec 19 ‘24 - Mar 28 bull leg
- SUP 4: $29.509 - Low Jan 13
Silver has confirmed a clear reversal of its recent uptrend. Thursday’s impulsive sell-off saw the metal trade through support at $32.665, the Mar 21 low. Furthermore, price is through both the 20- and 50-day EMAs. This signals scope for a continuation down with sights on the next key support at $30.815, the Feb 28 low. Initial firm resistance is at $33.301, the 20-day EMA. Key resistance has been defined at $34.590, the Mar 28 high.