MNI DAILY TECHNICAL ANALYSIS - AUD Corrective Cycle Underway
Price Signal Summary – Corrective Cycle Underway in AUD
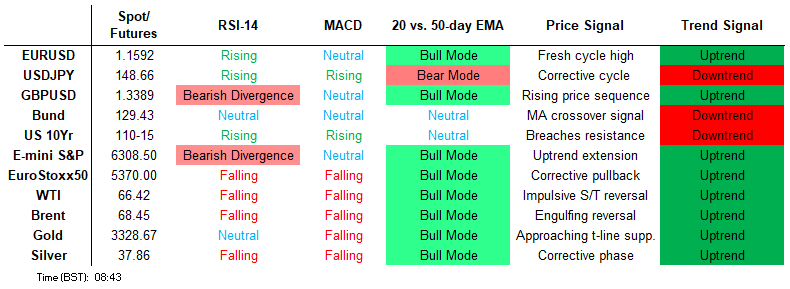
- S&P E-Minis are still trading in a range, closer to their recent highs. The trend condition remains bullish. Recent activity has resulted in a break of resistance at 6128.75, the Jun 11 high. The breach confirmed a resumption of the uptrend that started Apr 7. A bull cycle in Eurostoxx 50 futures remains in play and the latest pullback still appears corrective. Support to watch lies at 5281.00, the low on Jul 1 and 4. A clear break of this price point would strengthen a bearish threat.
- Despite the sharp intraday volatility in EURUSD on Wednesday, a corrective cycle remains in play. The 20-day EMA has recently been cleared. This signals scope for a test of the 50-day EMA, at 1.1511. A short-term bull cycle in USDJPY remains firmly in place and the recovery from Wednesday’s volatile low reinforces current conditions. The latest rally has resulted in a breach of resistance at 148.03, the Jun 23 high, and a move through key resistance. The trend set-up in AUDUSD remains bullish, however, a corrective cycle remains in play for now. Note that the pair has traded through an important support at 0.6490, the 50-day EMA.
- A bull cycle in Gold that started Jun 30, remains intact and the yellow metal is holding on to the bulk of its recent gains. Note that medium-term trend conditions are bullish - moving average studies are in a bull-mode position highlighting a dominant uptrend. A bearish tone in WTI futures remains intact. The sharp reversal from the Jun 23 high continues to highlight scope for an extension lower and this suggests that recent gains have been corrective.
- Bund futures are trading above their latest lows, however, a bear cycle remains intact. Recent weakness resulted in a break of 129.30, the May 22 low. The breach strengthens the current bearish theme and exposes the next key support at 128.97. A bear cycle in Gilt futures remains in play and this week’s volatile bearish activity reinforces this theme. The contract has recently breached support at 91.63, the Jul 2 low.
FOREIGN EXCHANGE
EURUSD TECHS: Monitoring Support
- RES 4: 1.1949 2.0% 10-dma envelope
- RES 3: 1.1923 2.000 proj of the Feb 28 - Mar 18 - 27 price swing
- RES 2: 1.1851 High Sep 10 2021
- RES 1: 1.1750/1829 High Jul 10 / 01 and the bull trigger
- PRICE: 1.1626 @ 06:09 BST Jul 17
- SUP 1: 1.1582 1.0% 10-dma envelope
- SUP 2: 1.1563 Low Jul 16
- SUP 3: 1.1511 50-day EMA
- SUP 4: 1.1446 Low Jun 19
Despite the sharp intraday volatility in EURUSD on Wednesday, a corrective cycle remains in play. The 20-day EMA has recently been cleared. This signals scope for a test of the 50-day EMA, at 1.1511. A clear break of the average is required to highlight a stronger reversal. For now, trend signals continue to highlight a dominant uptrend. A resumption of gains would open 1.1829, the Jul 1 high and a bull trigger.
GBPUSD TECHS: Bear Threat Remains Present
- RES 4: 1.3835 High Oct 20 2021
- RES 3: 1.3800 Round number resistance
- RES 2: 1.3681/3789 High Jul 04 / 01 and the bull trigger
- RES 1: 1.3542 20-day EMA
- PRICE: 1.3396 @ 06:32 BST Jul 17
- SUP 1: 1.3365 Low Jul 16
- SUP 2: 1.3335 Low May 20
- SUP 3: 1.3245 Low May 19
- SUP 4: 1.3144 38.2% retracement of the Jan 13 - Jul 1 bull cycle
A short-term bear cycle in GBPUSD remains in place and the pair continues to trade closer to its recent lows. A move down has resulted in a breach of both 20- and 50-day EMAs. Tuesday’s sell-off resulted in a break of trendline support at 1.3450. The trendline is drawn from the Jan 13 low and the break strengthens a bearish threat, exposing 1.3335 next, the May 20 low. Initial firm resistance to watch is 1.3542, the 20-day EMA.
EURGBP TECHS: Trading Closer To Its Recent High
- RES 4: 0.8800 Round number resistance
- RES 3: 0.8781 2.236 pro of the Mar 3 - 11 - 28 price swing
- RES 2: 0.8738 High Apr 11 high and a key resistance
- RES 1: 0.8698 High Jul 16
- PRICE: 0.8677 @ 06:42 BST Jul 17
- SUP 1: 0.8630 Low Jul 14
- SUP 2: 0.8606 20- day EMA
- SUP 3: 0.8543 50-day EMA
- SUP 4: 0.8508 Low Jun 27
EURGBP remains in a bull cycle and price is trading closer to its recent highs. Fresh cycle highs this week maintain the price sequence of higher highs and higher lows and note too that moving average studies are in a bull-mode position, highlighting a dominant uptrend. Scope is seen for a climb towards key resistance at 0.8738, the Apr 11 high. Support to watch lies at 0.8606, the 20-day EMA.
USDJPY TECHS: Trend Needle Points North
- RES 4: 151.21 High Mar 28
- RES 3: 150.49 High Apr 2
- RES 2: 149.38 50.0% retracement of the Jan 10 - Apr 22 bear leg
- RES 1: 149.18 High Jul 16
- PRICE: 148.39 @ 06:54 BST Jul 17
- SUP 1: 146.92 Low Jul 16
- SUP 2: 146.08 20-day EMA
- SUP 3: 145.54 50-day EMA
- SUP 4: 144.23 Low Jul 7
A short-term bull cycle in USDJPY remains firmly in place and the recovery from Wednesday’s volatile low reinforces current conditions. The latest rally has resulted in a breach of resistance at 148.03, the Jun 23 high, and a move through key resistance at 148.65, the May 12 high. The break strengthens a bull theme and sights are on 149.38, a Fibonacci retracement. On the downside, support to watch is 145.54, the 50-day EMA.
EURJPY TECHS: Trend Needle Points North
- RES 4: 175.43 High Jul 11 ‘24 and a key medium-term resistance
- RES 3: 174.86 1.764 proj of the Feb 28 - Mar 18 - Apr 7 price swing
- RES 2: 173.43 High Jul 12 ‘24
- RES 1: 173.24 High Jul 15
- PRICE: 172.51 @ 07:17 BST Jul 17
- SUP 1: 171.60 Low Jul 14
- SUP 2: 170.22 20-day EMA
- SUP 3: 169.32 Low Jul 3
- SUP 4: 167.50 50-day EMA
A bull phase in EURJPY remains in play and fresh cycle highs this week reinforce current conditions. The move higher also maintains the price sequence of higher highs and higher lows and note that MA studies are in a bull-mode position, highlighting a dominant uptrend. Sights are on 173.43, the Jul 12 ‘24 high. Support to watch lies at 170.22, the 20-day EMA.
AUDUSD TECHS: Trades Through The 50-Day EMA
- RES 4: 0.6700 76.4% retracement of the Sep 30 ‘24 - Apr 9 bear leg
- RES 3: 0.6688 High Nov 7 ‘24
- RES 2: 0.6603 High Nov 11 ‘24
- RES 1: 0.6595 High Jul 11 and the bull trigger
- PRICE: 0.6471 @ 08:00 BST Jul 17
- SUP 1: 0.6467 Intraday low
- SUP 2: 0.6435 23.6% retracement of the Sep 9 - Jul 11 bull leg
- SUP 3: 0.6373 Low Jun 23 and a bear trigger
- SUP 4: 0.6357 Low May 12
The trend set-up in AUDUSD remains bullish, however, a corrective cycle remains in play for now. Note that the pair has traded through an important support at 0.6490, the 50-day EMA. A clear break of this EMA would highlight a stronger reversal and signal scope for an extension initially towards 0.6435, a Fibonacci retracement. Key short-term resistance has been defined at 0.6595, a break of it would resume the uptrend.
USDCAD TECHS: Attention Is On The 50-Day EMA
- RES 4: 1.3920 High May 21
- RES 3: 1.3862 High May 29
- RES 2: 1.3798 High Jun 23
- RES 1: 1.3747/56 50-day EMA / High Jul 16
- PRICE: 1.3735 @ 08:06 BST Jul 17
- SUP 1: 1.3639/3557 Low Jul 08 / 03
- SUP 2: 1.3540 Low Jun 16 and the bear trigger
- SUP 3: 1.3503 1.618 proj of the Feb 3 - 14 - Mar 4 price swing
- SUP 4: 1.3473 Low Oct 2 2024
Attention in USDCAD is on resistance at 1.3747, the 50-day EMA. It was pierced yesterday. A clear break of the average is required to highlight a possible stronger short-term reversal. This would open 1.3798, the Jun 23 high. For now, a bear trend remains firmly in place. A resumption of weakness would refocus attention on key support at 1.3540, the Jun 16 low. Clearance of this level would confirm a resumption of the downtrend.
FIXED INCOME
BUND TECHS: (U5) Bear Cycle Still In Play
- RES 4: 131.95 High Jun 13 and the bull trigger
- RES 3: 131.33 High Jun 20
- RES 2: 130.76 High Jul 4
- RES 1: 129.97/130.25 20- and 50-day EMA values
- PRICE: 129.59 @ 05:45 BST Jul 17
- SUP 1: 129.08 Low Jul 14
- SUP 2: 128.97 Low May 14 and a reversal trigger
- SUP 3: 128.90 Low Apr 10
- SUP 4: 128.40 Low Apr 9
Bund futures are trading above their latest lows, however, a bear cycle remains intact. Recent weakness resulted in a break of 129.30, the May 22 low. The breach strengthens the current bearish theme and exposes the next key support at 128.97, the May 14 low and a bear trigger. On the upside, resistance around the the 50-day EMA, at 130.25, marks the key short-term hurdle. A clear breach of it is required to highlight a possible reversal.
BOBL TECHS: (U5) Gains Considered Corrective
- RES 4: 118.390 High Jun 13 and a key resistance
- RES 3: 118.060 High Jun 20
- RES 2: 117.980 High Jul 4
- RES 1: 117.710 High Jul 8
- PRICE: 117.570 @ 06:00 BST Jul 17
- SUP 1: 117.200 Low Jul 11
- SUP 2: 117.009 1.236 proj of the Jun 13 - 16 - 20 price swing
- SUP 3: 117.000 Round number support
- SUP 4: 116.885 1.382 proj of the Jun 13 - 16 - 20 price swing
A bear cycle in Bobl futures remains intact and the latest recovery appears corrective - for now. Recent weakness resulted in a breach of 117.530, the Jun 5 low. The break highlights a stronger reversal and cancels a recent bull theme. 117.210, a 1.000 projection of the Jun 13 - 16 - 20 price swing, has been pierced. Clearance of this level would open 117.000. Resistance to watch is 117.710, the Jul 8 high.
SCHATZ TECHS: (U5) Support Remains Exposed
- RES 4: 107.475 High May 27
- RES 3: 107.430 High Jun 13
- RES 2: 107.365 High Jun 7 and key short-term resistance
- RES 1: 107.315 High Jul 16
- PRICE: 107.270 @ 06:23 BST Jul 17
- SUP 1: 107.200/120 Low Jul 15 and 16 / Low Jul 11 and bear trigger
- SUP 2: 107.112 1.236 proj of the May 23 - 29 - 30 price swing
- SUP 3: 107.000 Round number support
- SUP 4: 106.890 2.000 proj of the May 23 - 29 - 30 price swing
Schatz futures traded lower last week and for now, a bear cycle remains in play. Short-term gains appear corrective. A recent move down resulted in a breach of support at 107.195 and 107.180, the Jun 6 and 23 lows respectively. This highlighted a range breakout. A resumption of weakness would open 107.112, a Fibonacci projection, and the 117.000 handle. Key near-term resistance is at 107.365, the Jul 7 high.
GILT TECHS: (U5) Bearish Cycle
- RES 4: 93.41 High Jul 2
- RES 3: 93.00 Round number resistance
- RES 2: 92.79 High Jul 4
- RES 1: 92.15/24 20-day EMA / HIgh Jul 15
- PRICE: 91.53 @ Close Jul 16
- SUP 1: 91.17 Low Jul 16
- SUP 2: 90.97 76.4% retracement of the May 22 - Jul 1 bull leg
- SUP 3: 90.59 Low May 29
- SUP 4: 90.46 Low May 23
A bear cycle in Gilt futures remains in play and this week’s volatile bearish activity reinforces this theme. The contract has recently breached support at 91.63, the Jul 2 low. Price has also traded through 91.50, the 61.8% retracement of the May 22 - Jul 1 bull leg. The move down exposes 90.97, the 76.4% retracement point. Clearance of this level would strengthen a bearish theme. Initial firm resistance is at 92.29, the 20-day EMA.
BTP TECHS: (U5) Still In A Corrective Cycle
- RES 4: 122.71 2.764proj of the May 14 - 20 - 21 price swing
- RES 3: 122.35 2.500 proj of the May 14 - 20 - 21 price swing
- RES 2: 122.00 Round number resistance
- RES 1: 120.54/121.73 20-day EMA / High Jun 13 and the bull trigger
- PRICE: 120.34 @ Close Jul 16
- SUP 1: 119.84 Low Jul 14
- SUP 2: 119.48 Low May 26
- SUP 3: 118.87 Low May 21
- SUP 4: 118.51 Low May 14 and key support
The trend condition in BTP futures is unchanged, it remains bullish. However, a corrective cycle is in play and this has resulted in a breach of support at 120.09, the Jul 23 low. The break signals scope for a deeper retracement, potentially towards 118.87, the May 21 low. On the upside, key resistance and the bull trigger has been defined at 121.73, the Jun 13 high. Initial resistance to watch is 120.54, the 20-day EMA.
EQUITIES
EUROSTOXX50 TECHS: (U5) Outlook Remains Bullish
- RES 4: 5575.00 High Mar 3 and a major resistance (cont)
- RES 3: 5526.00 High Mar 19 / 20 (cont)
- RES 2: 5486.00/88.00 High May 20 and a bull trigger / High Jul 10
- RES 1: 5415.00 High Jul 15
- PRICE: 5368.00 @ 06:35 BST Jul 17
- SUP 1: 5303.00 Low Jul 16
- SUP 2: 5281.00/5194.00 Low Jul 1 & 4 / Low Jun 23 and bear trigger
- SUP 3: 5138.00 High Apr 30
- SUP 4: 5078.00 Low Apr 30
A bull cycle in Eurostoxx 50 futures remains in play and the latest pullback still appears corrective. Support to watch lies at 5281.00, the low on Jul 1 and 4. A clear break of this price point would strengthen a bearish threat. Recent gains have exposed key resistance and the bull trigger at 5486.00, the May 20 high. It has been pierced, a clear breach of it would resume the medium-term bull cycle that began Apr 7 and open the 5500.00 handle.
E-MINI S&P: (U5) Bullish Trend Conditions
- RES 4: 6402.44 1.382 proj of the May 23 - Jun 11 - 23 price swing
- RES 3: 6381.00 1.764 proj of the Apr 7 - 10 - 21 price swing
- RES 2: 6356.12 1.236 proj of the May 23 - Jun 11 - 23 price swing
- RES 1: 6343.00 High Jul 15
- PRICE: 6310.75 @ 07:40 BST Jul 17
- SUP 1: 6241.00 Low Jul 16
- SUP 2: 6226.62/6082.03 20- and 50-day EMA values
- SUP 3: 5811.50 Low May 23
- SUP 4: 5645.75 Low May 7
S&P E-Minis are still trading in a range, closer to their recent highs. The trend condition remains bullish. Recent activity has resulted in a break of resistance at 6128.75, the Jun 11 high. The breach confirmed a resumption of the uptrend that started Apr 7. This was followed by a break of key resistance and a bull trigger at 6277.50, the Feb 21 high. Sights are on 6356.12, a Fibonacci projection. Key support is at the 50-day EMA, at 6082.03.
COMMODITIES
BRENT TECHS: (U5) Still Looking For Weakness
- RES 4: $85.00 - Round number resistance
- RES 3: $81.99 - 2.764 proj of the Apr 9 - 23 - May 5 price swing
- RES 2: $80.72 - 2.618 proj of the Apr 9 - 23 - May 5 price swing
- RES 1: $72.66/79.40 - 50.0% of the Jun 23-30 range / High Jun 23
- PRICE: $68.66 @ 07:14 BST Jul 17
- SUP 1: $65.92 - Low Jun 30
- SUP 2: $61.39 - Low May 30
- SUP 3: $58.00 - Low May 5
- SUP 4: $57.70 - Low Apr 9 and a key support
Short-term conditions in Brent futures remain bearish and the climb that started Jun 30 appears corrective. The sell-off on Jun 23 also highlights a bearish theme. Recent weakness has resulted in a print below the 50-day EMA and note too that $66.17, 61.8% of the May 5 - Jun 23 bull leg, has been pierced. A resumption of the downtrend would expose $61.39, the May 30 low. Initial resistance to watch is $72.66, a Fibonacci retracement point.
WTI TECHS: (Q5) Resistance Remains Intact
- RES 4: $82.62 - 3.000 proj of the Apr 9 - 23 - May 5 price swing
- RES 3: $80.43 - 2.764 proj of the Apr 9 - 23 - May 5 price swing
- RES 2: $80.00 - Psychological round number
- RES 1: $71.20/78.40 - 50.0% of the Jun 23-24 range / High Jun 23
- PRICE: $66.58 @ 07:22 BST Jul 17
- SUP 1: $65.54/64.00 - 50-day EMA / Low Jun 24
- SUP 2: $58.87 - Low May 30
- SUP 3: $54.81 - Low May 5
- SUP 4: $54.13 - Low Apr 9 and a key support
A bearish tone in WTI futures remains intact. The sharp reversal from the Jun 23 high continues to highlight scope for an extension lower and this suggests that recent gains have been corrective. Support to watch is the 50-day EMA, at $65.54. The average has been pierced, a clear break of it would expose $58.87, the May 30 low. Initial resistance to monitor is $71.20, the 50.0% retracement of the Jun 23 - 24 high-low range.
GOLD TECHS: Trading Above Support
- RES 4: $3547.9 - 1.764 proj of the Feb 28 - Apr 3 - Apr 7 price swing
- RES 3: $3500.1 - High Apr 22 and bull trigger
- RES 2: $3395.1/3451.3 - High Jun 23 / 16
- RES 1: $3377.3 - High Jul 16
- PRICE: 3330.6 @ 07:29 BST Jul 17
- SUP 1: $3282.8/3248.7 - Low Jul 9 / Low Jun 30 and the bear trigger
- SUP 2: $3204.7 - Low May 20
- SUP 3: $3121.0 - Low May 15 and key support
- SUP 4: $3085.0 - 76.4% retracement of the Apr 7 - 22 bull leg
A bull cycle in Gold that started Jun 30, remains intact and the yellow metal is holding on to the bulk of its recent gains. Note that medium-term trend conditions are bullish - moving average studies are in a bull-mode position highlighting a dominant uptrend. An extension would expose $3395.1, the Jun 23 high, and $3451.3, the Jun 16 high. On the downside, the bear trigger is $3248.7, the Jun 30 low. First support to watch is 3282.8, the Jul 9 low.
SILVER TECHS: Bullish Wave Still In Play
- RES 4: $40.285 - 1.618 proj of the Apr 7 - 25 - May 15 swing
- RES 3: $40.000 - Psychological round number
- RES 2: $39.655 - 1.500 proj of the Apr 7 - 25 - May 15 swing
- RES 1: $39.132 - High Jul 14
- PRICE: $37.854 @ 08:15 BST Jul 17
- SUP 1: $36.861 - 20-day EMA
- SUP 2: $35.624 - 50-day EMA
- SUP 3: $33.967 - Low Jun 3
- SUP 4: $32.615 - Low May 22
Trend conditions in Silver are unchanged, a strong impulsive bull wave remains intact and recent gains reinforce current conditions. The metal on Jul 11 cleared key short-term resistance at $37.317, the Jun 18 high. This confirmed a resumption of the uptrend and sights are on the $39.655 next, a Fibonacci projection. On the downside, initial support to watch lies at $36.750, the 20-day EMA.