MNI ASIA MARKETS ANALYSIS: Focus Turns to Wednesday's PPI
HIGHLIGHTS
- Treasuries quickly reversed post-CPI knee-jerk bid amid clear signs that tariffs are starting to show up in the core goods data.
- Stocks look to finish steady (SPX eminis) to mixed, the tech-heavy Nasdaq buoyed by chip makers after Nvidia green-lighted for exports to China.
- Boston Fed President Collins (2025 voter) reiterated in a speech Tuesday that she advocates an "actively patient" approach to policymaking.
- Focus turns to Wednesday morning's June PPI data followed by several Fed speakers before the Late Friday's policy Blackout starts.
US TSYS
MNI US TSY FUTURES: Testing Support, Focus on June PPI Inflation Data
- Treasury futures are extending lows in the last few minutes, Sep'25 10Y futures -15.5 at 110-09, through support at 110-10.5 (Low Jun 16). Next level to watch: 110-03 (76.4% retracement of the May 22 - Jul 1 bull leg).
- Futures have been holding to a lower, narrow band since midmorning - better than average volumes (TYU5 over 1.66M) sees a modest pick up in selling in the last hour. Curves flatter, but well off early lows: 2s10s -.687 at 52.452 (46.396 low), 5s30s -2.342 at 96.329 (64.760 low).
- Futures had rejected the initial post-CPI rally (TYU5 110-30 high) as markets woke up to the fact there were clear signs that tariffs are starting to show up in the core goods data. Higher than expected Empire Mfg contributed to the sell-off at the margins.
- Cross asset roundup: Bbg US$ index near highs (BBDXY +5.55 at 1208.05) after broader increase in core goods across 56 items for a second month, with a median increase of 0.44% M/M in June is another marked acceleration, threatening to delay the Fed hitting their inflation target.
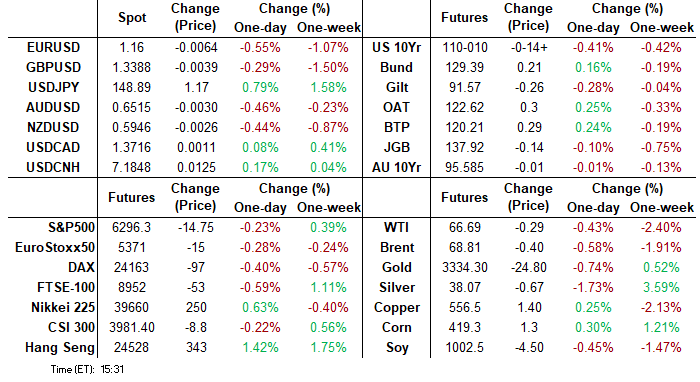
- Stocks near steady (SPX eminis) to mixed, the Nasdaq outperforming (+147.0 at 20787), buoyed by chip makers after Nvidia green-lighted for exports to China. Gold weaker (-14.32 at 3329.19), crude lower (WTI -0.52 at 66.46).
- Look ahead: June PPI data tomorrow morning followed by several Fed speakers before the Late Friday's policy Blackout starts.
REFERENCE RATES (PRIOR SESSION)
US TSYS: Repo Reference Rates
- Secured Overnight Financing Rate (SOFR): 4.33% (+0.02), volume: $2.759T
- Broad General Collateral Rate (BGCR): 4.32% (+0.02), volume: $1.125T
- Tri-Party General Collateral Rate (TCR): 4.32% (+0.02), volume: $1.094T
- (rate, volume levels reflect prior session)
STIR: FRBNY EFFR for prior session:
- Daily Effective Fed Funds Rate: 4.33% (+0.00), volume: $104B
- Daily Overnight Bank Funding Rate: 4.33% (+0.00), volume: $261B
FED Reverse Repo Operation:
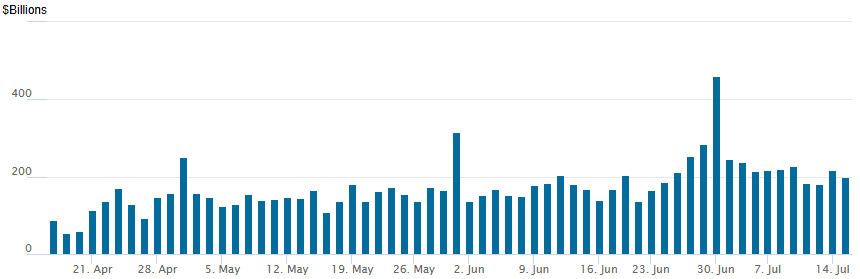
RRP usage retreats to $198.277B this afternoon from $217.841B yesterday, total number of counterparties at 36. Usage had fallen to $54.772B on Wednesday, April 16 -- lowest level since April 2021 - compares to yesterday's (July 1) $460.731B highest usage since December 31.
US SOFR/TREASURY OPTION SUMMARY
SOFR & Treasury options saw better put volume Tuesday, outright and spd, as underlying futures rejected the initial post-CPI rally. Focus turns to Wednesday's June PPI data. Curves hold flatter profiles/well off lows, 2s10s -0.067 at 53.072, projected rate cut pricing continues to soften vs morning/pre-data (*) levels: Jul'25 steady at -0.6bp, Sep'25 at -14.1bp (-15.7bp), Oct'25 at -27.1bp (-29.4bp), Dec'25 at -43.7bp (-46.7bp).
SOFR Options
Block/pit, -11,500 SFRU5 95.25/95.75 put spds, 3.5 ref 95.815
Block, 5,000 SFRU5 95.68/95.81 2x1 put spds, 4.25
Block, -10,000 SFRZ5 96.25/96.50/96.75/97.00 call condors, 4.0 net ref 96.125
1,250 SFRZ5 95.75/95.87/96.25/96.37 call condors
Block, +20,000 SFRU5 95.62 puts, cab
-16,000 SFRH6 96.00/96.50 put spds 23.75 vs. 96.385/0.30%
10,250 SFRU5 95.81 puts, ref 95.84
+2,000 SFRU5 95.87/96.00/96.06/96.18 call condors, 2.75
2,000 SFRU5 95.56/95.68 2x1 put spds ref 95.85
+2,500 SFRU5 95.25/95.75 put spds, 3.5
+5,000 SFRZ5 95.75/95.87/96.00 put trees, 2
4,000 SFRQ5 95.75/95.81 put spds
Block/screen +14,100 SFRU5 95.62/95.75/95.81/95.87 broken put condors, 0.5
+2,500 SFRU5 96.12/96.37 call spds, 1.25
Treasury Options:
13,200 TYV5 108.5 puts, 32 ref 110-08
Block, 10,000 TYV5 108/TYX5 107.5 put strip, 54 vs. 110-10/0.20%
+10,000 TYV5 113/115 call spds 12
Block - adds to below w/ another 18,600 USU5 108 puts, 34-35 with 13,400 at 32 on screen
Block, total 22,500 USU5 108 puts, 28-29 vs. 112-09/0.16%
6,500 TYQ5/wk3 TY 110 put spds, 4
5,000 TYQ5 112 calls, 4
2,000 TUQ5 103.25/103.37/103.62/103.75 put condors ref 103-20.38
-10,000 TYU5 109.5/112 strangles, 38
-2,500 wk3 TY 111.25 calls, 6 vs. 110-24.5/0.25%
-2,000 FVQ5 107.75/108 put spds, 6
+3,500 TYQ5 109.75 puts, 5 vs. 110-25/0.08%
2,000 TYQ5 111.5 calls, 9 vs. 110-24.5/0.21%
-1,000 FVU5 108 straddles, 104.5 vs. 108-04/0.10%
+20,000 FVQ5 107.75 puts, 7.5
+4,000 Wednesday wkly TY 111.5/111.75 call spds, 1 ref 110-23.5 to -24.5
+10,000 TYQ5 112 calls, 4
MNI BONDS: EGBs-GILTS CASH CLOSE: Early Rally Reverses After US CPI
Bunds outperformed Gilts Tuesday as a rally in the first half of the session reversed.
- Core FI saw solid gains through the morning, with 10Y Bund yields erasing most of the previous three sessions' rise, and Gilt yields touching the lowest intraday levels in 6 sessions.
- There was no major catalyst for the move, which looked through stronger-than-expected German ZEW and Eurozone industrial production data.
- The initial read of US CPI data extended the rally as core came in softer than expected, but global FI sold off about an hour later as it became clear that the report indicated rising tariff-related goods price pressures, pushing up breakeven inflation expectations.
- The German curve twist flattened, with the UK's leaning bear steeper. Periphery/semi-core EGB spreads were little changed on the day. PM Bayrou's 2026 budget announcement didn't bring any major moves in OAT spreads vs Bund.
- After hours we hear from BOE's Bailey and Chancellor Reeves at the Mansion House event.
- Wednesday's calendar highlight is UK CPI - MNI's preview is here (including our outlook for Thursday's labour market report). For CPI, we are watching headline closely and the biggest risk to this month’s print seems to be food inflation continuing to surprise to the upside.
Closing Yields / 10-Yr EGB Spreads To Germany
- Germany: The 2-Yr yield is up 1.1bps at 1.887%, 5-Yr is down 1.5bps at 2.263%, 10-Yr is down 1.7bps at 2.712%, and 30-Yr is down 1.9bps at 3.226%.
- UK: The 2-Yr yield is up 2.4bps at 3.836%, 5-Yr is up 1.6bps at 4.031%, 10-Yr is up 2.5bps at 4.625%, and 30-Yr is up 2.8bps at 5.458%.
- Italian BTP spread down 0.3bps at 86bps / French OAT down 0.4bps at 70bps
MNI OPTIONS: Spread Buying Seen Across Euribor And Sonia
Tuesday's Europe rates/bond options flow included:
- RXU5 128/127/126/125 put condor 7K given at 13/12
- RXU5 123.50 puts paper paid 3 on +4.5K
- ERU5 97.875/98.00 call spread 14K given at 11
- ERZ5 98.50/98.25 1x2 put spread 4.5K sold down to 6
- SFIM6 97.40/97.50 call spread paper paid 1.25 on 10K
- SFIZ5 96.25/96.05/95.85 put fly paper paid 3.25 on 5.5K. Was also lifted in 5.5K Monday
MNI FOREX: USDJPY Leads Impressive Greenback Rally Following US Inflation Data
- Despite the initial dip lower for the greenback following the softer-than-expected core and supercore readings for US inflation, a deeper dive into the data prompted a swift and significant recovery for the greenback. A broader increase in core goods across 56 items for a second month, with a median increase of 0.44% M/M in June is another marked acceleration, threatening to delay the Fed hitting their inflation target.
- With US yields rising in reflection of this dynamic, the broad dollar reversal higher was swift and then persistent throughout the session. The most recent USD index recovery has now extended to around 2.3% from cycle lows printed on July 01. The rally marks the cleanest evidence yet of a material break of the downtrend posted off the February high, bolstered by a breach of the 20-day EMA.
- The rally has been led by a powerful 0.75% advance for USDJPY, where topside momentum was exacerbated on a break of the June and July highs at 148.03 and 148.65 respectively. The peak so far today stands at 149.02 as the market continues to extend its short squeeze, and the next focus will be on 149.38, the 50.0% retracement of the Jan 10 - Apr 22 bear leg, and 150.49, the Apr 2 high.
- While JPY weakness stands out today, the Swedish krona sits at the bottom of the G10 leaderboard. A continued reversal following last week’s inflation data provides an interesting positioning dynamic here, as the market may prefer to be positioned for a dovish Riskbank ahead.
- The likes of EUR, AUD and NZD have all declined around 0.4% against the dollar. EURUSD has hit fresh pullback lows towards the 1.16 mark as downside momentum has picked up following a breach of the 20-day EMA.
- Although sterling moderately outperforms, GBPUSD has breached important trendline support below 1.3430, drawn from the Jan 13 low. A clear break of the trendline would strengthen a bearish threat and expose 1.3335, the May 20 low. Sentiment will be affected by both CPI and labour market reports, due on Wed and Thu respectively. US PPI is also due.
EQUITIES
MNI US STOCKS: Late Equities Roundup: Chip Makers Buoyed as Export Curbs Lifted
- Stocks continue to trade near steady (SPX eminis) to mixed late Tuesday, the tech-heavy Nasdaq outperforming after the White House rescinded a ban on high speed chips to China. At the moment, the DJIA trades down 327.71 points (-0.74%) at 44134.32, S&P E-Minis down 6 points (-0.1%) at 6305.25, Nasdaq up 119.8 points (0.6%) at 20760.16.
- Semiconductor makers supported the the tech heavy Nasdaq after several were greenlighted for exports to China. Leading gainers included: Advanced Micro Devices +6.52%, NVIDIA +4.07%, Broadcom +2.38%, KLA Corp +2.15% and Lam Research +2.02%.
- On the flipside, the DJIA continued to underperform in late trade with the Materials sector, specifically mining stocks w/ Gold lower, and Health Care sectors weighed by pharmaceuticals.
- Weighing on the Materials sector: Newmont Corp -6.15%, Freeport-McMoRan -3.62%, Vulcan Materials -2.59% and Albemarle -2.21%. Pharmaceuticals weighed on the Health Care sector: Agilent Technologies -5.08%, Regeneron Pharmaceuticals -4.10%, Moderna -3.80%, Eli Lilly -3.51% and Biogen Inc -3.34%.
- Individually, some banks and services underperforming after reporting earnings this morning, namely: State Street Corp -6.38%, Wells Fargo -6.26%, Blackrock -5.15%, Invesco -2.77% and American Express -2.70%.
- Earnings announcements expected early Wednesday: Prologis, Progressive, First Horizon, PNC Financial Services, Bank of America Corp, Johnson & Johnson, Goldman Sachs and Morgan Stanley. After the close: United Airlines Holdings, Rexford Industrial Realty, Alcoa Corp and Kinder Morgan.
MNI EQUITY TECHS: E-MINI S&P: (U5) Trend Needle Points North
- RES 4: 6402.44 1.382 proj of the May 23 - Jun 11 - 23 price swing
- RES 3: 6381.00 1.764 proj of the Apr 7 - 10 - 21 price swing
- RES 2: 6356.12 1.236 proj of the May 23 - Jun 11 - 23 price swing
- RES 1: 6343.00 Intraday high
- PRICE: 6323.25@ 14:54 BST Jul 15
- SUP 1: 6246.25 Low Jul 7
- SUP 2: 6211.67/6064.44 20- and 50-day EMA values
- SUP 3: 5811.50 Low May 23
- SUP 4: 5645.75 Low May 7
The trend condition in S&P E-Minis remains bullish and the contract is trading at its latest highs. Recent activity has resulted in a break of resistance at 6128.75, the Jun 11 high. The breach confirmed a resumption of the uptrend that started Apr 7. This was followed by a break of key resistance and a bull trigger at 6277.50, the Feb 21 high. Sights are on 6356.12, a Fibonacci projection. Key support is at the 50-day EMA, at 6064.44.
MNI COMMODITIES: Crude Falls, Gold Dips Amid Dollar Gains
- Oil has fallen further today, having begun its reversal on Monday as President Trump gave a 50-day deadline to Russian sanctions, easing fears of any short-term disruption.
- WTI Aug 25 is down by 0.7% at $66.5/bbl.
- OPEC expects global trade tensions to ease in the coming weeks, supporting its outlook for oil demand to remain steady.
- WTI futures maintain a bearish tone following the reversal from the June 23 high, with support to watch at $65.50, the 50-day EMA. A clear break of this level would signal scope for a deeper retracement, exposing $58.87, the May 30 low.
- Initial resistance to monitor is $71.20, the 50.0% retracement of the June 23 - 24 high-low range.
- Meanwhile, spot gold has fallen by 0.5% to $3,328/oz amid the bounce in the US dollar following today’s US CPI data.
- Despite today’s dip, ongoing trade uncertainties are expected to remain a support for gold, with analysts at City Index suggesting that the yellow metal could easily retest of even breach recent highs if trade talks deteriorate before August.
- A bull cycle in gold that started June 30 remains intact and an extension higher would expose $3,395.1, the June 23 high, and $3,451.3, the June 16 high.
- On the downside, first support to watch is $3,282.8, the July 9 low.
WEDNESDAY CALENDAR
| Date | GMT/Local | Impact | Country | Event |
| 16/07/2025 | 0600/0700 | *** | Consumer inflation report | |
| 16/07/2025 | 0800/1000 | *** | HICP (f) | |
| 16/07/2025 | 0900/1100 | * | Trade Balance | |
| 16/07/2025 | 1100/0700 | ** | MBA Weekly Applications Index | |
| 16/07/2025 | 1215/0815 | ** | CMHC Housing Starts | |
| 16/07/2025 | 1230/0830 | *** | PPI | |
| 16/07/2025 | 1315/0915 | *** | Industrial Production | |
| 16/07/2025 | 1315/0915 | Cleveland Fed's Beth Hammack | ||
| 16/07/2025 | 1400/1000 | Fed Governor Michael Barr | ||
| 16/07/2025 | 1430/1030 | ** | DOE Weekly Crude Oil Stocks | |
| 16/07/2025 | 1800/1400 | Fed Beige Book | ||
| 16/07/2025 | 2230/1830 | New York Fed's John Williams | ||
| 17/07/2025 | 0130/1130 | *** | Labor Force Survey |