EM CEEMEA CREDIT: MAADEN: mandate for USD 5Y & 10Y Sukuks
Saudi Arabian Mining (Ma’aden; Baa1/-/BBB+)
Mandate: USD 5Y and 10Y benchmark Sukuk
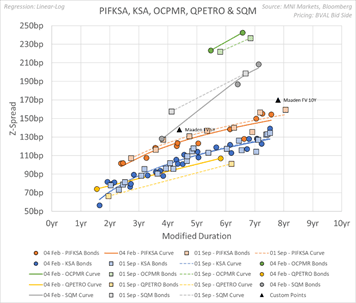
- Ma’aden has mandated for USD benchmark Sukuk deal, indicating 5Y and 10Y tenors. Ma’aden does not have any hard-ccy outstanding public debt in bond format. We see FV estimates in the region of 5Y @ z+138bp or T+110bp and 10Y @ z+170bp or T+125bp (see chart below).
- For comparables within Saudi Arabia, we look at better rated PIFKSA (Aa3/-/A+) charting Sukuks PIFKSA 5.171 Mar31 @ z+123bp and PIFKSA 6.25 Oct33 @ z+128bp, as well as KSA (Aa3/Apos/A+) charting Sukuks KSA 5.25 Jun30 @ z+111bp and KSA 5.25 Jun34 @ z+123bp. We see the Sukuk format as key in our considerations around fair value estimates.
- As industry peers across geographies, we look at Morocco’s lower-rated, phosphate champion OCPMR (Baa3/BB+/BB+) charting OCPMR 6.75 May34 @ z+242bp and OCPR 3.75 Jun31 @ z+223bp and Chile’s similarly rated SQM (Baa1/BBB+/-) charting SQM 6.5Nov33 @ z+187bp and SQM 5.5 Sep34 @ z+208bp. OCPMR curve charts some 40bp in z-spread on top of MOROC sovereign curve.
- Ma’aden is a Saudi, listed, state owned multi-commodity mining and metals company, with headquarters in Riyadh, Kingdom of Saudi Arabia. Ownership structure benefits from Public Investment Fund of Kingdom of Saudi Arabia (PIFKSA) owning over 65% majority stake.
- The Co. plays a strategic role in delivering Saudi Arabia’s Vision 2030. It states being active in over 30 countries, operating 17 mines and sites covering three main segments: phosphate, aluminium, and rare metals (gold, copper and new minerals).
- The main contributor to sales remains Phosphates, accounting for approx. 64% of 9M24 EBITDA (from approx. 40% in FY20) and 55% of sales from 47% in FY20 (all figures indicative).
- Aluminium’s 9M24 EBITDA segment contribution was approx. 24% @ SAR2.16bn (FY20 EBITDA @ SAR 2.23bn). The Co. refers to an ambitious, acquisitive plan, targeting a 10x EBITDA growth over 2020-40 period. This supports the Co.’s diversification effort, a key pillar of its Vision 2040 strategy programme.
- On November 7, 2024, Ma’aden posted 3Q24 results with 9M24 showing revenue growth +6% YoY @ SAR22.58bn, EBITDA +45% YoY @ SAR8.84bn and Net Profit @ SAR2.98bn. Op Cash Flow was +10% YoY @ SAR7.08bn. Ma’aden announced a “capital allocation strategy geared for expansion” (Source: Co. 9M24 outlook). Leverage declined with 9M24 NetDebt/EBITDA @ 1.9x vs 2.3x FY23, guidance for FY24 is in 2-3x range.
Want to read more?
Find more articles and bullets on these widgets:
Historical bullets
JGB TECHS: (H5) Returns Lower
- RES 3: 149.55 - High Mar 22 (cont)
- RES 2: 147.74 - High Jan 15 and bull trigger (cont)
- RES 1: 144.48/146.53 - High Nov 11 / High Aug 6
- PRICE: 142.12 @ 15:01 GMT Jan 03
- SUP 1: 141.65 - Low Dec 30
- SUP 2: 141.56 - 1.764 proj of the Aug 6 - Sep 3 - 9 price swing
- SUP 3: 141.05 - 2.000 proj of the Aug 6 - Sep 3 - 9 price swing
Markets slipped on the hawkish Fed and are yet to fully recover, touching 141.65 on the way lower. Medium-term trend signals on the continuation chart continue to point south. A resumption of the trend would pave the way for a move towards 141.56, a Fibonacci projection point on the continuation chart. A stronger recovery would open 144.48, the Nov 11 high. Further out, key resistance is at 146.53, the Aug 6 high (cont).
USDCAD TECHS: Bull Flag Highlights A Clear Uptrend
- RES 4: 1.4669 2.0% 10-dma envelope
- RES 3: 1.4539 3.382 proj of the Oct 17 - Nov 1 - 6 price swing
- RES 2: 1.4508 3.236 proj of the Oct 17 - Nov 1 - 6 price swing
- RES 1: 1.4467 High Dec 19
- PRICE: 1.4392 @ 15:50 GMT Jan 3
- SUP 1: 1.4336 Low Dec 20
- SUP 2: 1.4307/4232 20-day EMA / Low Dec 17
- SUP 3: 1.4136 50-day EMA
- SUP 4: 1.4011 Low Dec 5
USDCAD is unchanged and bulls remain in the driver’s seat. The latest pause appears to be a flag formation - a bullish continuation signal. Note too that moving average studies are in a bull-mode position, highlighting a dominant uptrend. Sights are on 1.4508 next, a Fibonacci projection level. Initial firm support to watch lies at 1.4307, the 20-day EMA. A pullback would be considered corrective.
AUDUSD TECHS: Southbound
- RES 4: 0.6471 High Dec 9
- RES 3: 0.6408 50-day EMA
- RES 2: 0.6341 High Dec 18
- RES 1: 0.6247/6282 High Dec 30 / 20-day EMA
- PRICE: 0.6204 @ 15:21 GMT Jan 3
- SUP 1: 0.6179 Low Dec 31
- SUP 3: 0.6158 1.236 proj of the Sep 30 - Nov 6 - 7 price swing
- SUP 3: 0.6100 Round number support
- SUP 4: 0.6045 1.500 proj of the Sep 30 - Nov 6 - 7 price swing
A bearish trend condition in AUDUSD remains intact and the pair continues to trade closer to latest lows. Recent weakness maintains the price sequence of lower lows and lower highs. Note that moving average studies are in a bear-mode position too, highlighting a dominant downtrend. Scope is seen for an extension towards 0.6158 next, a Fibonacci projection. Initial firm resistance to monitor is 0.6282, the 20-day EMA.