EGB SYNDICATION: Latvia sustainability bond framework update
"The REPUBLIC OF LATVIA has mandated BNP PARIBAS and Credit Agricole CIB as Joint ESG Structurers fo...
Want to read more?
Find more articles and bullets on these widgets:
Historical bullets
COMMODITIES: WTI Back Above $100/bbl, Last Week's Pullback Considered Corrective
A sharp pullback in WTI futures last week is for now, considered corrective. The contract traded through the 20-day EMA, at $97.88. Attention for now is on support at the 50-day EMA, at $86.29. A clear break of the 50-day average is required to highlight a stronger short-term reversal. On the upside key resistance and the bull trigger has been defined at $117.63, the Apr 7 high. Clearance of this hurdle would confirm a resumption of the uptrend. Recent gains in Gold appear to be corrective, however for now, a short-term bull cycle remains intact. The metal has pierced the 50-day EMA, at $4781.2. This signals scope for an extension towards $4914.9, a Fibonacci retracement point. Clearance of this level would open the $5000.0 handle. Initial firm support to watch lies at $4554.2, the Apr 2 low. A break of this level would be bearish.
- WTI Crude up $7.59 or +7.86% at $104.14
- Natural Gas up $0.03 or +1.17% at $2.677
- Gold spot down $32.36 or -0.68% at $4719.19
- Copper down $1.5 or -0.25% at $592.85
- Silver down $1.59 or -2.1% at $74.3175
- Platinum down $9.99 or -0.49% at $2040.14
EQUITIES: E-Mini S&P Softer, But Holding Onto Bulk of Last Week's Gains
EuroStoxx 50 futures are holding on to the bulk of their recent gains. The contract has traded through both the 20- and 50-day EMAs, paving the way for a climb towards 5945.47, a Fibonacci retracement point. Note that a break of 5945.47 would expose the key resistance and bull trigger at 6143.00, the Feb 26 high. First key support to watch lies at 5525.00, the Apr 2 low. A move lower and a breach of this support would highlight a reversal. A strong rally in S&P E-Minis last week highlights an extension of the reversal that started Mar 31. Note that trend signals remain bearish and for now, this suggests gains are corrective. A continuation higher would open 6921.09 next, a Fibonacci retracement point. Key medium-term resistance and the bull trigger is far off at 7096.50, the Jan 28 high. Initial firm support to watch lies at 6567.00, the Apr 6 low.
- Japan's NIKKEI closed lower by 421.34 pts or -0.74% at 56502.77 and the TOPIX ended 16.84 pts lower or -0.45% at 3723.01.
- Elsewhere, in China the SHANGHAI closed higher by 2.333 pts or +0.06% at 3988.558 and the HANG SENG ended 232.69 pts lower or -0.9% at 25660.85.
- Across Europe, Germany's DAX trades lower by 210.15 pts or -0.88% at 23592.72, FTSE 100 lower by 33.53 pts or -0.32% at 10565.95, CAC 40 down 74.2 pts or -0.9% at 8183.75 and Euro Stoxx 50 down 57.22 pts or -0.97% at 5872.34.
- Dow Jones mini down 215 pts or -0.45% at 47914, S&P 500 mini down 37 pts or -0.54% at 6818.5, NASDAQ mini down 156.5 pts or -0.62% at 25125.75.
EGBS: Light Bear Flattening, But 30-year Bund Yields Still At Multi-Year Highs
The German curve has lightly bear flattened this morning, a familiar reaction in response to the latest deterioration in US-Iran relations. Ceasefire talks broke down over the weekend, but the fairly contained deviation from Friday’s close suggests markets still consider an offramp exists.
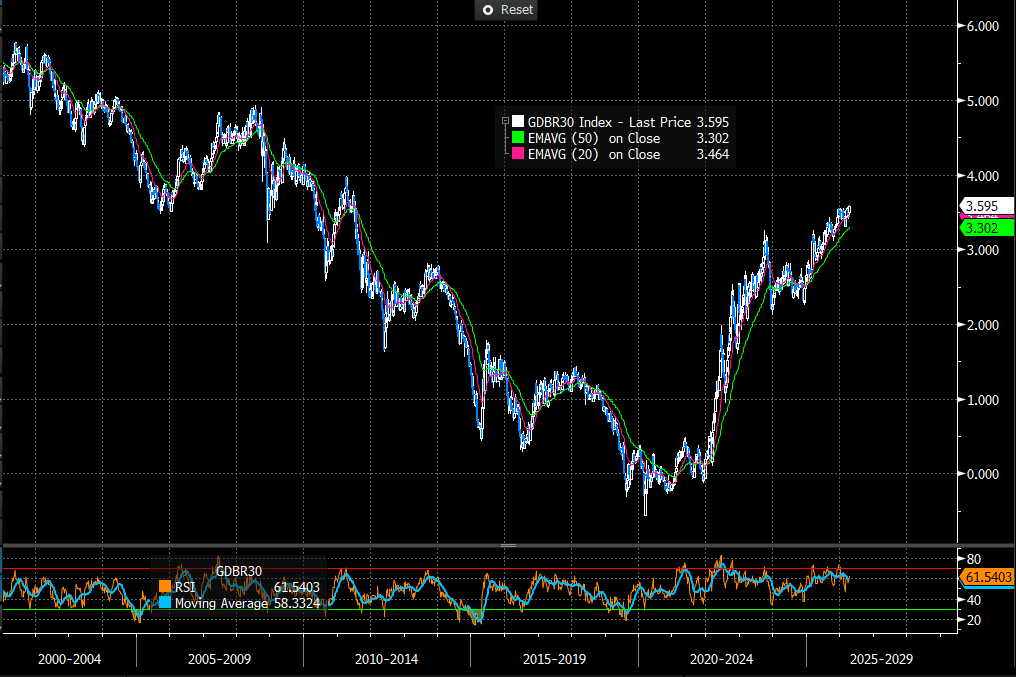
- Schatz yields are up ~2bps to 2.62%, while 30-year yields are up 1bp to 3.59%.
- 30-year yields registered a fresh multi-year high last week, with markets potentially accounting for the longer-term inflationary impact of the war and/or the need for Government fiscal responses.
- This morning, Germany announced a E1.6bln package to help consumers and businesses with fuel prices.
- Bund futures are -23 ticks at 124.97. A bear cycle remains intact and the pullback from last week’s high reinforces this bear theme. The focus is on key short-term support and the bear trigger at 124.25, the Mar 27 low.
- OATs are a little more insulated than other EGB peers, after Moody’s deferred a ratings assessment in its periodic review on Friday (meaning a downgrade was avoided). The 10-year OAT/Bund spread is unchanged at 64.5bps, while the BTP/Bund spread has widened 1bp.
- This week’s Eurozone data calendar is relatively light, with final Eurozone March inflation data due on Thursday. ECB commentary from the IMF/World Bank Spring Meetings will likely attract most attention.
Figure 1: 30-year Bund Yields Since 2000, Weekly (Source: Bloomberg Finance L.P)