EM LATAM CREDIT: LATAM Credit Market Wrap
Source: Bloomberg Finance L.P.
Measure Level Δ DoD
5yr UST 3.60% -1bp
10yr UST 4.00% -0bp
5s-10s UST 39.7 +1bp
WTI Crude 61.4 -0.4
Gold 4100 -25.9
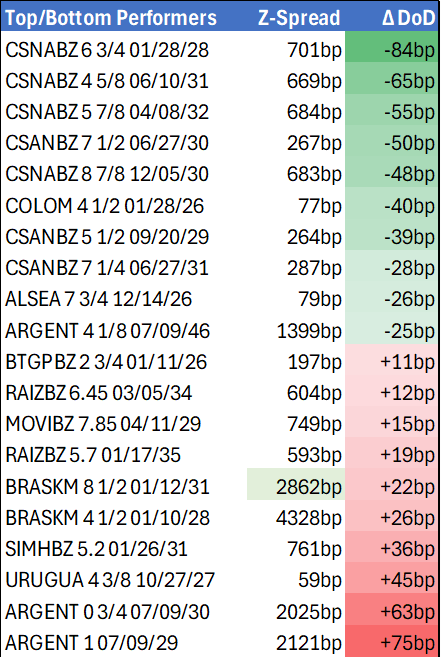
Bonds (CBBT) Z-Sprd Δ DoD
ARGENT 3 1/2 07/09/41 1300bp -18bp
BRAZIL 6 1/8 03/15/34 232bp +1bp
BRAZIL 7 1/8 05/13/54 320bp -1bp
COLOM 8 11/14/35 314bp -4bp
COLOM 8 3/8 11/07/54 367bp -4bp
ELSALV 7.65 06/15/35 365bp -3bp
MEX 6 7/8 05/13/37 218bp -0bp
MEX 7 3/8 05/13/55 261bp -2bp
CHILE 5.65 01/13/37 124bp -1bp
PANAMA 6.4 02/14/35 228bp -2bp
CSNABZ 5 7/8 04/08/32 684bp -55bp
MRFGBZ 3.95 01/29/31 275bp +2bp
PEMEX 7.69 01/23/50 480bp -7bp
CDEL 6.33 01/13/35 183bp -1bp
SUZANO 3 1/8 01/15/32 170bp -3bp
FX Level Δ DoD
USDBRL 5.39 +0.01
USDCLP 941.57 -3.12
USDMXN 18.5 +0.05
USDCOP 3852.86 -29.54
USDPEN 3.38 -0.01
CDS Level Δ DoD
Mexico 91 (3)
Brazil 141 (3)
Colombia 192 (3)
Chile 50 (2)
CDX EM 97.95 0.16
CDX EM IG 101.43 0.09
CDX EM HY 93.86 0.27
Main stories recap:
· Short maturity Treasury yields inched a bp lower as today’s benign September CPI report sealed the deal on a Fed rate cut next week while major U.S. equity indexes hit all-time highs.
· With that pleasant macro backdrop, LATAM benchmark bond spreads tightened 1-3bp generally, though there was outperformance in select Brazil corporate bond names.
· CSN bonds moved over 2 points higher but were still 3 points lower for the week as the fallout from the heavy losses taken by Braskem holders last month still weighed on the Brazil corporate bond market but less so today.
· Cosan bonds were up a point as people anticipated that a successful equity capital raise could mean an eventual tender for outstanding USD bonds, like what the company did earlier this year after selling their 5% stake in Vale.
Want to read more?
Find more articles and bullets on these widgets:
Historical bullets
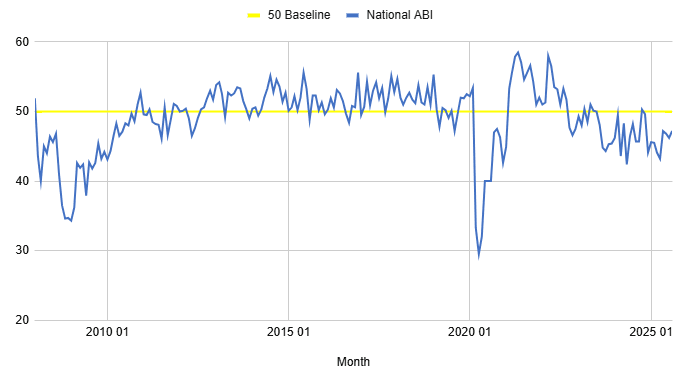
US DATA: Architectural Billings Suggest Weakness Ahead For Construction
The American Institute of Architects (AIA)'s Architecture Billings Index (ABI) remained below the 50 mark in August.
- At 47.2, it improved from 46.2 in July. But the sub-50 reading meant that the value of new design contracts dropped for a record 18th consecutive month (the series has been published for 15 years).
- As a leading indicator of construction activity, this is a negative sign for both nonresidential and residential (multifamily) investment over the coming year.
- Already, construction is under duress - as of the latest data for August from the Census Bureau, private sector construction activity contracted (in value terms) for the 14th consecutive month (-0.2% after -0.5%). Overall, since peaking in December 2023, private nonresidential construction has fallen by 6.9%.
USDCAD TECHS: Approaching The Bull Trigger
- RES 4: 1.4019 38.2% retracement of the Feb 3 - Jun 16 bear leg
- RES 3: 1.3968 High May 20
- RES 2: 1.3925 High Aug 22 and the bull trigger
- RES 1: 1.3907 High Sep 24
- PRICE: 1.3899 @ 21:11 BST Sep 24
- SUP 1: 1.3790/3727 50-day EMA / Low Aug 29 and a bear trigger
- SUP 2: 1.3709 61.8% retracement of the Jul 23 - Aug 22 bull cycle
- SUP 3: 1.3658 76.4% retracement of the Jul 23 - Aug 22 bull cycle
- SUP 4: 1.3637 Low Jul 25
Wednesday’s rally in USDCAD undermines a recent bearish theme as the pair extends the recovery from the Sep 17 low. The pair has pierced resistance at 1.3890, the Sep 11 high. This exposes key resistance at 1.3925, the Aug 22 high and the bull trigger. Clearance of this hurdle would highlight an important short-term bullish break. Initial support to watch lies at 1.3790, the 50-day EMA.
JGB TECHS: (Z5) Bearish Trend Sequence Intact
- RES 3: 140.08 High Jun 13
- RES 2: 139.05 High Aug 4
- RES 1: 137.30 - High Sep 8 and key short-term resistance
- PRICE: 135.79 @ 20:49 BST Sep 24
- SUP 1: 135.76 - Low Sep 22
- SUP 2: 135.39 - 1.618 proj of the Aug 4 - Sep 2 - Sep 8 price swing
- SUP 3: 134.69 - 2.000 proj of the Aug 4 - Sep 2 - Sep 8 price swing
A bear threat in JGB futures remains present and the contract has pulled back from its recent highs. The latest sell-off has also resulted in a break of support at 136.19, the Sep 4 low and a bear trigger. Clearance of this level confirms a resumption of the downtrend and opens 135.39 next, a Fibonacci projection. Key short-term resistance has been defined at 137.30, the Sep 8 high.