EM LATAM CREDIT: LATAM Credit Market Wrap
Source: Bloomberg Finance L.P.
Measure Level Δ DoD
5yr UST 3.67% -7bp
10yr UST 4.10% -5bp
5s-10s UST 42.3 +2bp
WTI Crude 61.9 -0.4
Gold 3862 +3.0
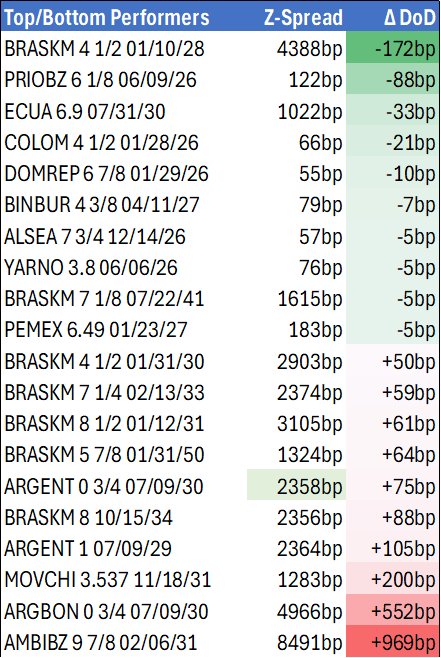
Bonds (CBBT) Z-Sprd Δ DoD
ARGENT 3 1/2 07/09/41 1522bp +6bp
BRAZIL 6 1/8 03/15/34 225bp +4bp
BRAZIL 7 1/8 05/13/54 310bp +1bp
COLOM 8 11/14/35 329bp -1bp
COLOM 8 3/8 11/07/54 392bp -1bp
ELSALV 7.65 06/15/35 384bp +8bp
MEX 6 7/8 05/13/37 219bp +2bp
MEX 7 3/8 05/13/55 267bp -0bp
CHILE 5.65 01/13/37 133bp +3bp
PANAMA 6.4 02/14/35 227bp +2bp
CSNABZ 5 7/8 04/08/32 536bp +1bp
MRFGBZ 3.95 01/29/31 239bp +10bp
PEMEX 7.69 01/23/50 470bp +2bp
CDEL 6.33 01/13/35 182bp +5bp
SUZANO 3 1/8 01/15/32 162bp +5bp
FX Level Δ DoD
USDBRL 5.33 +0.01
USDCLP 959.86 -2.61
USDMXN 18.4 +0.07
USDCOP 3880.89 -40.36
USDPEN 3.48 +0.01
CDS Level Δ DoD
Mexico 90 (1)
Brazil 135 (1)
Colombia 194 1
Chile 51 0
CDX EM 97.81 0.01
CDX EM IG 101.46 0.01
CDX EM HY 93.42 (0.05)
Main stories recap:
· Treasury yields rallied 2-7bp in a bull steepening move after ADP reported a negative change in September payrolls.
· The EM primary market cooled after a hectic week so far with only one new issue in CEEMEA for Bahrain while in LATAM we had one new mandate announcement.
· EM Benchmark bond spreads in the secondary market widened about 5-10bp as yields lagged the rally in U.S. Treasuries.
· Also contributing to the less enthusiastic tone was fallout from the Braskem situation with bonds having dropped about 50 points in the past four months from one of the LATAM credit market’s largest corporate bond issuers.
Want to read more?
Find more articles and bullets on these widgets:
Historical bullets
USDCAD TECHS: Trades Through The 50-Day EMA
- RES 4: 1.4019 38.2% retracement of the Feb 3 - Jun 16 bear leg
- RES 3: 1.3925 High Aug 22 and the bull trigger
- RES 2: 1.3868 High Aug 26
- RES 1: 1.3794 20-day EMA
- PRICE: 1.3751 @ 20:50 BST Sep 1
- SUP 1: 1.3722 Low Aug 7
- SUP 2: 1.3709 61.8% retracement of the Jul 23 - Aug 22 bull cycle
- SUP 3: 1.3658 76.4% retracement of the Jul 23 - Aug 22 bull cycle
- SUP 4: 1.3637 Low Jul 25
A bull cycle in USDCAD that started mid-June remains in play. However, the latest corrective pullback has resulted in a breach of support at the 50-day EMA, at 1.3775. A clear break of this handle signals scope for a deeper retracement and exposes 1.3722, the Aug 7 low. Moving average studies have recently crossed and are in a bull-mode position, highlighting an uptrend. The bull trigger has been defined at 1.3925, the Aug 22 high.
AUDUSD TECHS: Bullish Extension
- RES 4: 0.6688 High Nov 7 ‘24
- RES 3: 0.6677 0.764 proj of the Jun 23 - Jul 11 - 17 price swing
- RES 2: 0.6625 High Jul 24 and the bull trigger
- RES 1: 0.6569 High Aug 14
- PRICE: 0.6555 @ 20:46 BST Sep 1
- SUP 1: 0.6463/6415 Low Aug 27 / Low Aug 21 / 22 and a bear trigger
- SUP 2: 0.6373 Low Jun 23
- SUP 3: 0.6354 38.2% retracement of the Apr 9 - Jul 24 upleg
- SUP 4: 0.6323 Low Apr 16
AUDUSD continues to appreciate. The latest recovery signals the end of the recent corrective phase and sights are on resistance at 0.6569, the Aug 14 high. Clearance of this level would expose key resistance and the bull trigger at 0.6625, the Jul 24 high. Support to watch lies at 0.6415, the Aug 21 / 22 low. A clear break of it would resume the bear leg and highlight a stronger reversal.
EURJPY TECHS: MA Studies Highlight A Dominant Uptrend
- RES 4: 177.08 2.000 proj of the Feb 28 - Mar 18 - Apr 7 price swing
- RES 3: 175.43 High Jul 11 ‘24 and a key medium-term resistance
- RES 2: 174.86 1.764 proj of the Feb 28 - Mar 18 - Apr 7 price swing
- RES 1: 173.02/97 High Aug 13 / High Jul 28 and the bull trigger
- PRICE: 172.35 @ 20:28 BST Sep 1
- SUP 1: 170.69 50-day EMA
- SUP 2: 169.73/45 Low Jul 31 / 23.6% of the Feb 28 - Jul 28 bull leg
- SUP 3: 168.46 Low Jul 1
- SUP 4: 167.46 Low Jun 23
EURJPY continues to trade below its recent highs. The trend structure is bullish and key support to watch lies at the 50-day EMA at 170.69. A clear break of the average is required to highlight a stronger short-term bearish threat. Note that moving average studies are in a bull-mode position highlighting a primary uptrend. Key resistance to watch is the Jul 28 high of 173.97. Clearance of this level would confirm a continuation of the bull cycle.