EM CEEMEA CREDIT: KSA: FV for $ 5Y & 10Y benchmark Sukuk dual tranche
(KSA; Aa3/A+/A+)
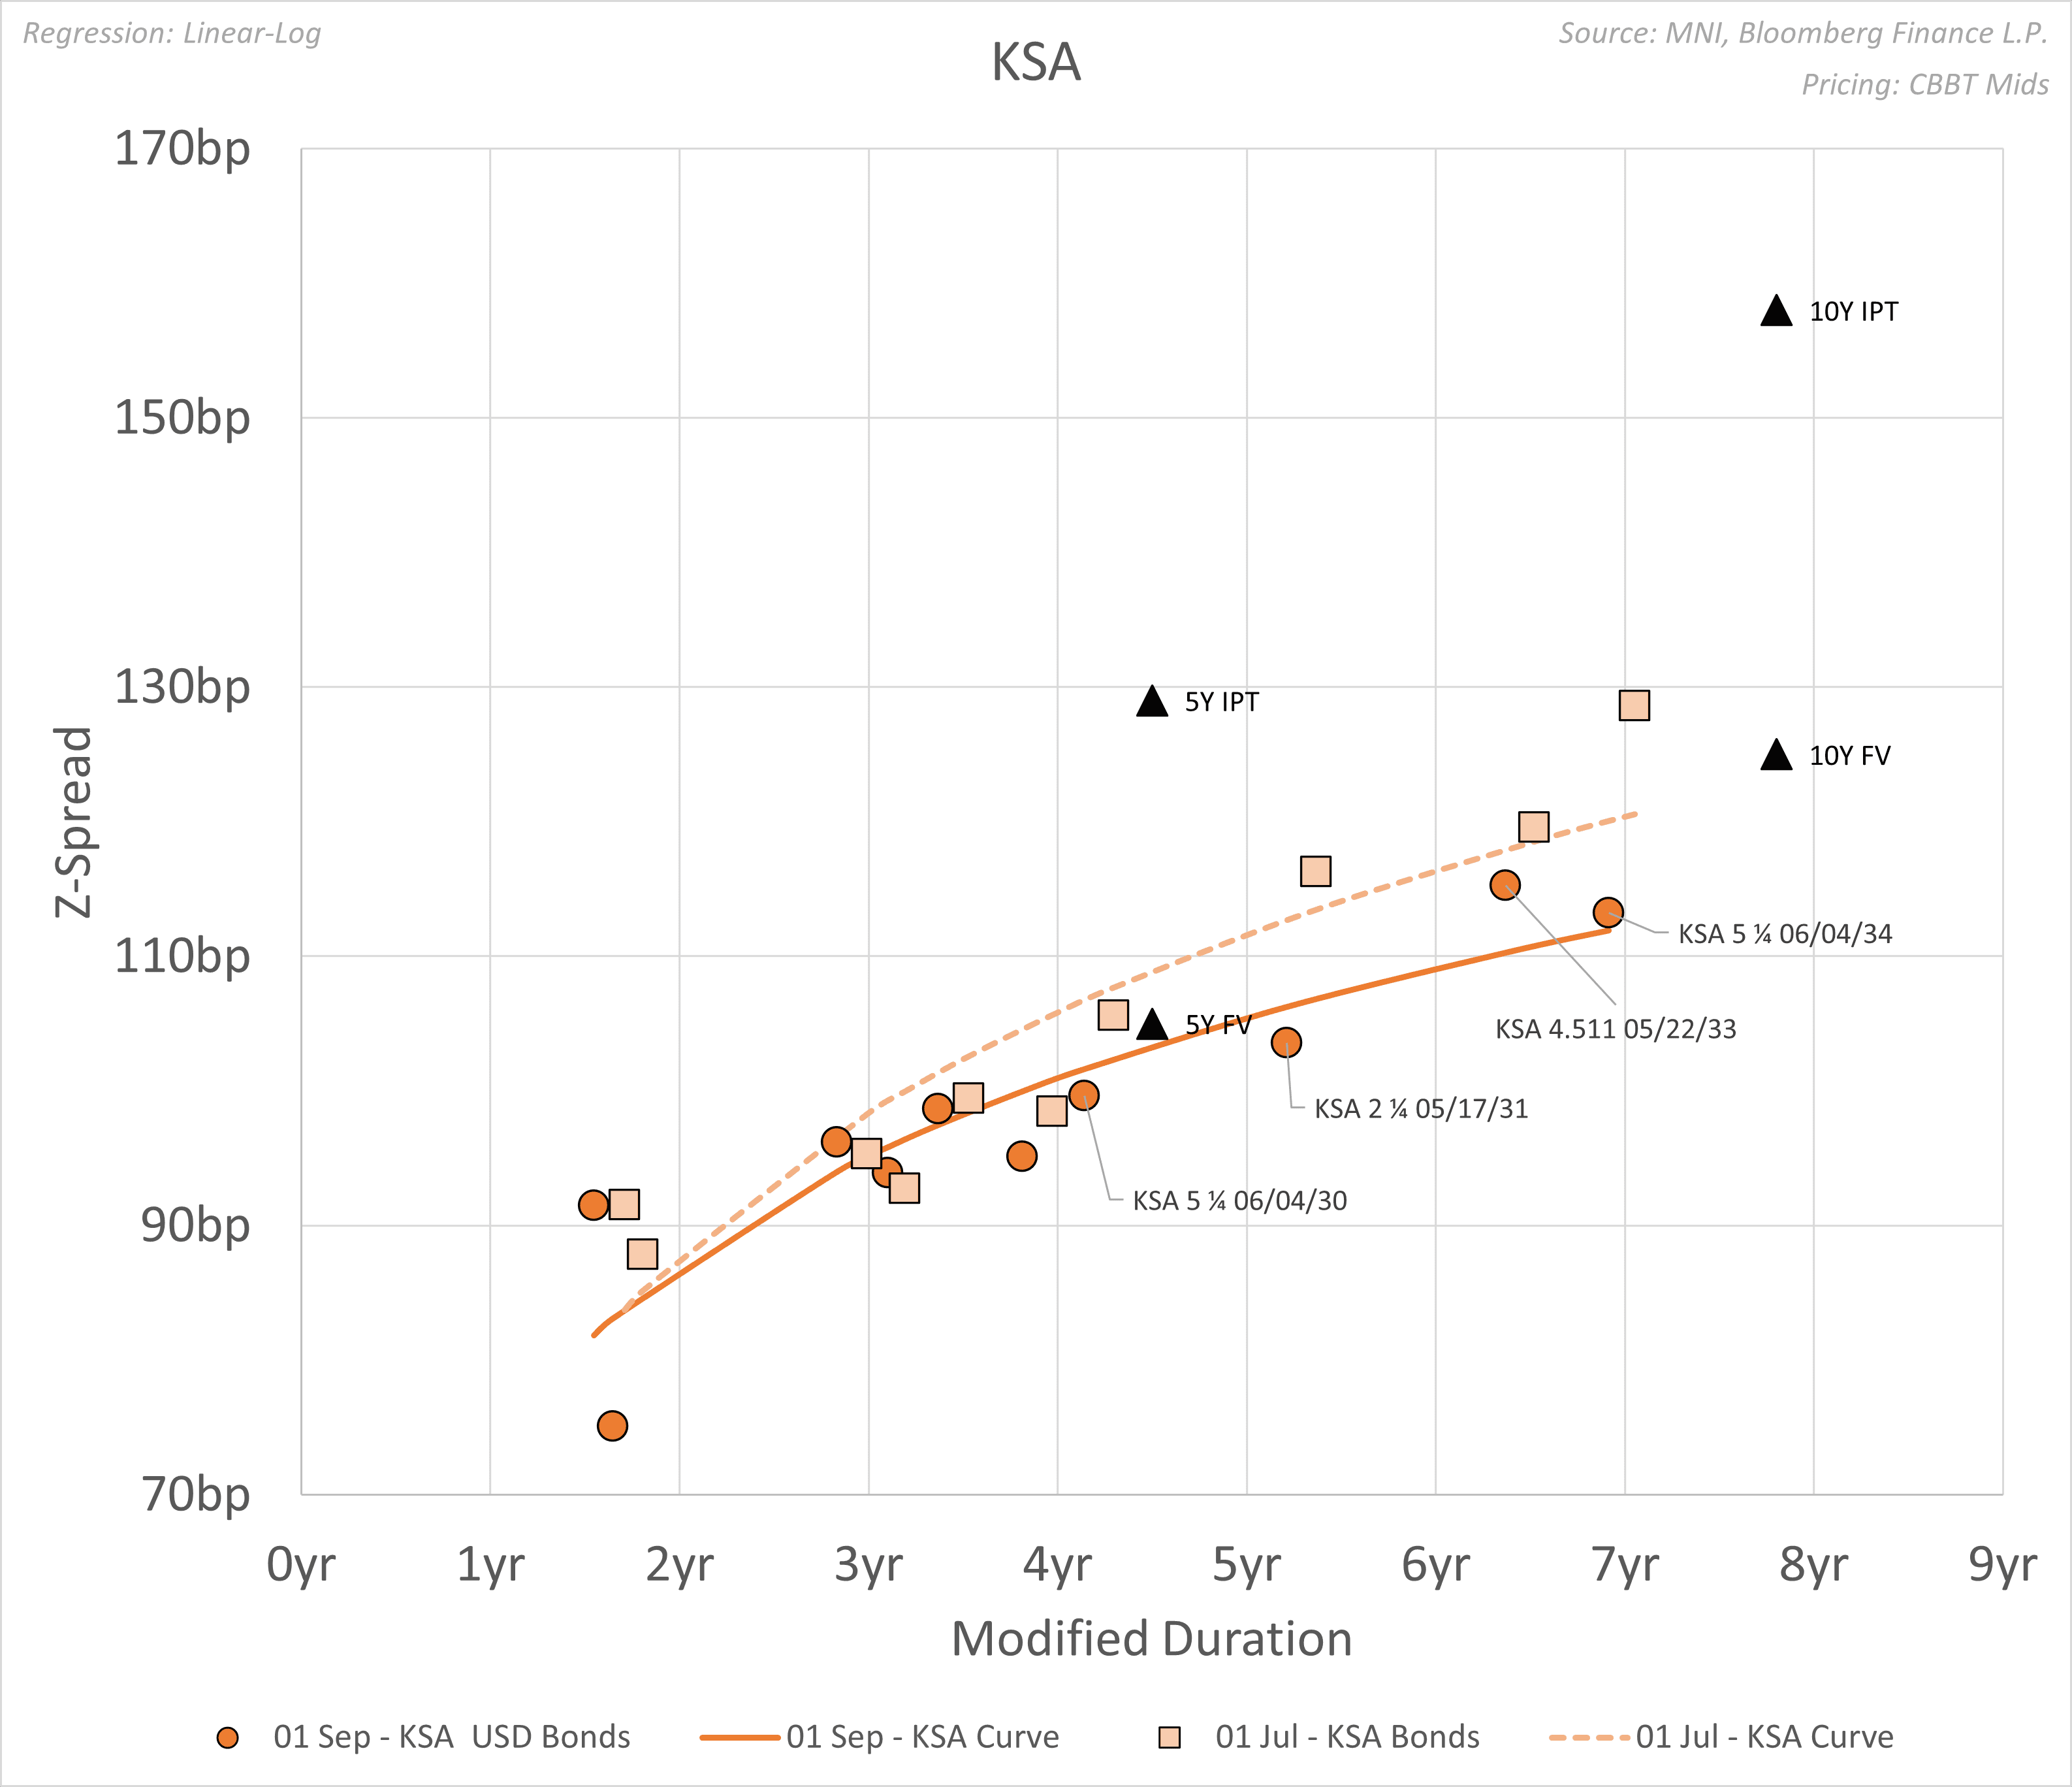
5Y: IPT @ T+95bp area FV @ T+71bp
10Y: IPT @ T+105bp area FV @ T+72bp
• We sketch our FV considerations for the proposed 5Y deal at z+105bp or T+71bp and for the 10Y deal at z+125bp or T+72bp.
• To gain some perspective, we look at the recent KSA curve spread evolution, with the curve showing a flattening over the summer (see chart below).
• For comparables, we focus on the granular $ Sukuk seasoned curve. As of previous CoB, we see KSA Jun30s charting at z+100bp whilst KSA Jun34s is charting at z+113bp.
Want to read more?
Find more articles and bullets on these widgets:
Historical bullets
JGB TECHS: (U5) NFP Tips Prices Sharply Higher
- RES 3: 147.74 - High Jan 15 and bull trigger (cont)
- RES 2: 146.53 - High Aug 6
- RES 1: 141.48/142.95 - High May 2 / High Apr 7
- PRICE: 138.63 @ 17:23 GMT Aug 1
- SUP 1: 137.32 - Low Jul 25
- SUP 2: 136.57 - 1.382 proj of the Jan 28 - Feb 20 - Feb 26 bear leg
- SUP 3: 134.89 - 2.000 proj of the Jan 28 - Feb 20 - Feb 26 bear leg
JGBs rallied sharply alongside global bond markets Friday, piercing mid-week resistance in the process. The first important resistance to watch is 141.48, the May 2 high. A break of this level would be viewed as an early bullish signal. A return lower would signal scope for an extension towards 136.57, a Fibonacci projection.
USDCAD TECHS: Slips Sharply on USD Downdraft
- RES 4: 1.4111 Apr 10
- RES 3: 1.4019 38.2% retracement of the Feb 3 - Jun 16 bear leg
- RES 2: 1.3920 High May 21
- RES 1: 1.3879 High Aug 1
- PRICE: 1.3794 @ 17:42 BST Aug 1
- SUP 1: 1.3716/3557 20-day EMA / Low Jul 03
- SUP 2: 1.3540 Low Jun 16 and the bear trigger
- SUP 3: 1.3503 1.618 proj of the Feb 3 - 14 - Mar 4 price swing
- SUP 4: 1.3473 Low Oct 2 2024
A short-term bullish corrective phase in USDCAD remains in play despite sharp weakness Friday. On the recent run higher, price traded through the 50-day EMA at 1.3739 and this has been followed by a break of resistance at 1.3798, the Jun 23 high. Clearance of 1.3798 represents an important short-term bullish development, signalling scope for a stronger recovery. Sights are on 1.3920 next, the May 21 high. On the downside, initial firm support to watch lies at 1.3716, the 20-day EMA.
MACRO ANALYSIS: MNI US Macro Weekly: Poor Payrolls Trumps Patient Powell
- We have published and e-mailed to subscribers the MNI US Macro Weekly offering succinct MNI analysis across the range of macro developments over the past week.
- Please find the full report here.
Executive Summary
- The second half of the week has seen some significant moves in markets from first a patient Fed Chair Powell not giving a nod to a September rate cut before a weak payrolls report with huge downward revisions materially altered recent trends.
- Nonfarm payrolls growth underwhelmed at 73k in July but the major headline was the -258k two-month downward revision, of which -139k came from the private sector and -119k from the public sector. Outside of April 2020, that’s the largest two-month downward revision in at least forty-five years.
- We caution though that whilst jobs growth has soured sharply, it’s doing so along with a significant slowing in labor supply under immigration curbs.
- As such, the unemployment rate may have technically ticked up to a new cycle high of 4.248% (above 4.244% in May) but it continues to roughly plateau in the 4.0-4.25% range seen since last July. The median FOMC forecast from the June SEP had the unemployment rate increasing to an average 4.5% in 4Q25 as part of forecast with two rate cuts in 2025 so further deterioration would be expected.
- A note on the latest initial jobless claims data, which are back at 2019 averages, a period when the unemployment rate averaged 3.7%.
- The weak report prompted an extraordinary response from President Trump, directing his team to fire BLS Commissioner Erika McEntarfer. It’s a broadening out of criticism beyond the Fed’s Powell and its Board.
- Speaking after payrolls, Atlanta Fed’s Bostic (in a non-voting role this year) said he hasn’t changed his view that there should be just one rate cut this year.
- Elsewhere in a major week for data, core PCE inflation exceeded latest Fed tracking in June at 2.8% Y/Y, whilst away from any tariff impact, market-based services inflation printed 3.3% Y/Y. Various inflation metrics showed a continued stabilization at above 2% target rates.
- The Q2 GDP advance release meanwhile beat analyst expectations with 3.0% annualized although it was close to Atlanta Fed GDPNow expectations. PDFP moderated further to 1.2% annualized for its weakest since 4Q22 although could have been worse.
- As a precursor to next week’s ISM Services report, the Manufacturing counterpart was weak across the board in July. Prices paid pulled back from recent highs, new orders chalked up a sixth consecutive month firmly in contraction territory and the employment index fell to its lowest since mid-2020.
- Yields have tumbled after the weak payrolls report. A September cut is mostly priced now vs 50/50 before the release, with a cumulative 59bp by year-end and five cuts in total from current levels.