EU CREDIT SUPPLY: Korea Electric Power (KORELE, Aa2/AA/AA-) - Mandate and FV
Credit Supply: Korea Electric Power (KORELE, Aa2/AA/AA-) - Mandate and FV
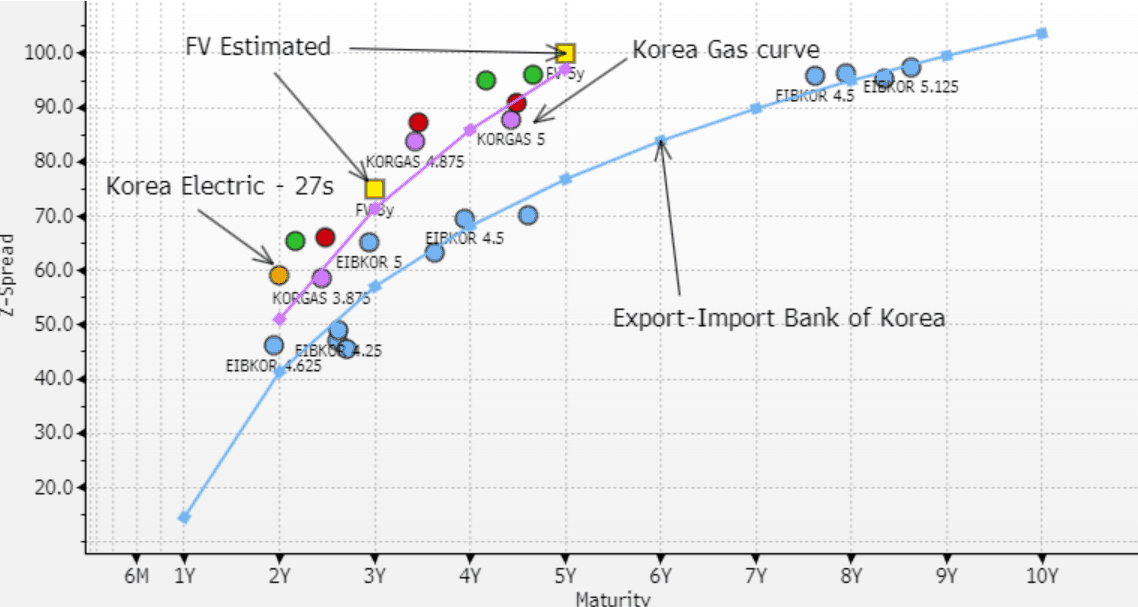
New $ Mandate: 3y & 5yr
FV Estimate: 3y T+50bp, 5y T+70bp in fxd.
Korea Electric Power (KEPCO) has mandated banks to organise investor calls ahead of a possible 3y and 5y fixed or floating rate deal. There is no mention of size, but we assume benchmark.
Assuming the deal does come to the market, we take a look at where fair value might be for a 3y and 5y fixed bond of benchmark size (note the Jan. '24 issue was $1.2bn).
KEPCO is a highly rated (Aa2/AA), Korean electricity producer, majority owned by the Korean state and a strategic asset. We expect state support if and when needed. As referenced below, we make our assessment of fair value versus peer, Korea Gas (KORGAS), also majority state owned and similarly rated.
KEPCO previously issued dollars in January '24 (1/27s), which trades around 10bp wide of the KORGAS curve in z-sprd terms, but we note it’s a relatively large size ($1.2bn). In our assessment, we clean things up a bit by eliminating bonds issued beyond 3 years to get to a more liquid curve.
As illustrated in the chart (below) we believe that FV is likely to be a few bp wide of the KORGAS curve, with the 3y FV at around T+50bp (z+75bp) and the 5y at around T+70bp (z+100bp).
Want to read more?
Find more articles and bullets on these widgets:
Historical bullets
JGB TECHS: (H5) Returns Lower
- RES 3: 149.55 - High Mar 22 (cont)
- RES 2: 147.74 - High Jan 15 and bull trigger (cont)
- RES 1: 144.48/146.53 - High Nov 11 / High Aug 6
- PRICE: 142.12 @ 15:01 GMT Jan 03
- SUP 1: 141.65 - Low Dec 30
- SUP 2: 141.56 - 1.764 proj of the Aug 6 - Sep 3 - 9 price swing
- SUP 3: 141.05 - 2.000 proj of the Aug 6 - Sep 3 - 9 price swing
Markets slipped on the hawkish Fed and are yet to fully recover, touching 141.65 on the way lower. Medium-term trend signals on the continuation chart continue to point south. A resumption of the trend would pave the way for a move towards 141.56, a Fibonacci projection point on the continuation chart. A stronger recovery would open 144.48, the Nov 11 high. Further out, key resistance is at 146.53, the Aug 6 high (cont).
USDCAD TECHS: Bull Flag Highlights A Clear Uptrend
- RES 4: 1.4669 2.0% 10-dma envelope
- RES 3: 1.4539 3.382 proj of the Oct 17 - Nov 1 - 6 price swing
- RES 2: 1.4508 3.236 proj of the Oct 17 - Nov 1 - 6 price swing
- RES 1: 1.4467 High Dec 19
- PRICE: 1.4392 @ 15:50 GMT Jan 3
- SUP 1: 1.4336 Low Dec 20
- SUP 2: 1.4307/4232 20-day EMA / Low Dec 17
- SUP 3: 1.4136 50-day EMA
- SUP 4: 1.4011 Low Dec 5
USDCAD is unchanged and bulls remain in the driver’s seat. The latest pause appears to be a flag formation - a bullish continuation signal. Note too that moving average studies are in a bull-mode position, highlighting a dominant uptrend. Sights are on 1.4508 next, a Fibonacci projection level. Initial firm support to watch lies at 1.4307, the 20-day EMA. A pullback would be considered corrective.
AUDUSD TECHS: Southbound
- RES 4: 0.6471 High Dec 9
- RES 3: 0.6408 50-day EMA
- RES 2: 0.6341 High Dec 18
- RES 1: 0.6247/6282 High Dec 30 / 20-day EMA
- PRICE: 0.6204 @ 15:21 GMT Jan 3
- SUP 1: 0.6179 Low Dec 31
- SUP 3: 0.6158 1.236 proj of the Sep 30 - Nov 6 - 7 price swing
- SUP 3: 0.6100 Round number support
- SUP 4: 0.6045 1.500 proj of the Sep 30 - Nov 6 - 7 price swing
A bearish trend condition in AUDUSD remains intact and the pair continues to trade closer to latest lows. Recent weakness maintains the price sequence of lower lows and lower highs. Note that moving average studies are in a bear-mode position too, highlighting a dominant downtrend. Scope is seen for an extension towards 0.6158 next, a Fibonacci projection. Initial firm resistance to monitor is 0.6282, the 20-day EMA.