FOREX: JPY Crosses - Trade Heavy Ignoring The Bounce In Risk For Now
The US Equity market seems to be concentrating on the potential rate cuts coming and ignoring the worries about growth that would make the cuts possible for now. This morning has seen US futures open a little higher, ESU5 +0.17%, NQU5 +0.20%. The Yen has remained well bid in the crosses keeping them heavy overnight even with the big retracement higher in risk. Is the Yen telling us something and leading the market or will risk continue higher forcing the crosses to turn higher once more.
- EUR/JPY - Overnight range 169.91 - 171.16, Asia is trading around 170.00. This pair continues to trade heavy ignoring the bounce in risk. Watch for any signs of topping out should risk actually start correcting lower, a move sub 169.50/170.00 could signal a deeper pullback is on the cards.
- GBP/JPY - Overnight 195.04 - 196.53, Asia trades around 195.35. The pair sliced through its support around 197.00 and has moved very quickly towards the 195.00 support. The move higher looks to have stalled for now and a sustained break below 195.00 would turn momentum lower again. A bounce back towards 197.00/197.50 should now see sellers remerge.
- NZD/JPY - Overnight range 86.68 - 87.46, Asia is currently dealing 86.80. The pair failed with multiple attempts to break above 89.00. A top looks to potentially be in place now and a break sub 96.50 could signal a deeper correction, expect sellers on any back towards 88.00 initially.
- CNH/JPY - Overnight range 20.4515 - 20.6254, Asia is currently trading around 20.4700. This pair broke through its 20.7000/20.8000 resistance area last week but the price action was pretty ugly as the move higher was rejected in what looks like a key day reversal. Initial support is around the 20.40 area but a sustained break back below 2.3000 would begin to turn momentum lower again.
Fig 1 : GBP/JPY Daily Chart
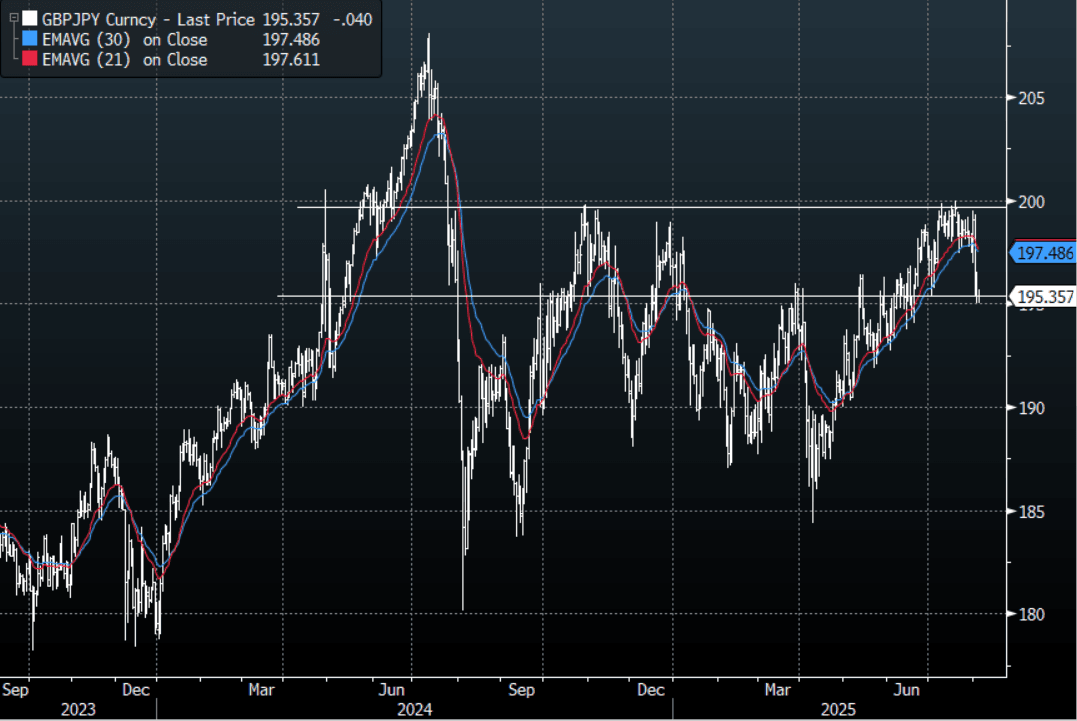
Source: MNI - Market News/Bloomberg Finance L.P
Want to read more?
Find more articles and bullets on these widgets:
Historical bullets
USDCAD TECHS: Trend Outlook Remains Bearish
- RES 4: 1.4111 High Apr 4
- RES 3: 1.4016 High May 12 and 13 and a key resistance
- RES 2: 1.3920 High May 21
- RES 1: 1.3674/3776 20- and 50-day EMA values
- PRICE: 1.3607 @ 16:12 BST Jul 4
- SUP 1: 1.3557 Low Jul 03
- SUP 2: 1.3540 Low Jun 16 and the bear trigger
- SUP 3: 1.3503 1.618 proj of the Feb 3 - 14 - Mar 4 price swing
- SUP 4: 1.3473 Low Oct 2 2024
The trend needle in USDCAD points south and this week’s move down reinforces current conditions. S/T gains between Jun 16 - 23 appear to have been corrective. Key support and the bear trigger is 1.3540, Jun 16 low. Clearance of this level would resume the downtrend and open 1.3503, a Fibonacci projection. Pivot resistance is at the 50-day EMA, at 1.3776. A clear break of this average would signal scope for a stronger recovery.
AUDUSD TECHS: Bull Cycle Remains In Play
- RES 4: 0.6700 76.4% retracement of the Sep 30 ‘24 - Apr 9 bear leg
- RES 3: 0.6688 High Nov 7 ‘24
- RES 2: 0.6603 High Nov 11 ‘24
- RES 1: 0.6590 High Jul 01
- PRICE: 0.6548 @ 16:05 BST Jul 04
- SUP 1: 0.6521 20-day EMA
- SUP 2: 0.6468/6373 50-day EMA / Low Jun 23 and a reversal trigger
- SUP 3: 0.6357 Low May 12
- SUP 4: 0.6275 Low Apr 14
The trend set-up in AUDUSD remains bullish and the pair is holding on to its recent gains. The latest break higher maintains the bullish price sequence of higher highs and higher lows, the definition of an uptrend. Moving average studies are in a bull-mode position, highlighting a dominant uptrend. Sights are on 0.6603 next, the Nov 11 2024 high. Key short-term support has been defined at 0.6373, the Jun 23 low.
EURJPY TECHS: Northbound
- RES 4: 171.88 High Jul 19 ‘24
- RES 3: 171.28 1.382 proj of the Feb 28 - Mar 18 - Apr 7 price swing
- RES 2: 171.09 High Jul 23 ‘24
- RES 1: 170.61 High Jul 03
- PRICE: 170.22 @ 16:04 BST Jul 04
- SUP 1: 169.04 Low Jul 02
- SUP 2: 167.87 20-day EMA
- SUP 3: 167.13 Low Jun 20
- SUP 4: 165.66 50-day EMA
EURJPY traded higher on Thursday resulting in a print above 170.47, the 76.4% retracement of the Jul 11 - Aug 5 sell-off. A clear break of this price point would strengthen bullish conditions and signal scope for extension. This would open 170.28 next, a Fibonacci projection. The trend is overbought, a pullback would unwind this condition. Support to watch lies at 167.87, the 20-day EMA.