US CAPITAL GOODS: John Deere 3Q25 Earnings
(DE; A1/A/A+)
Weak Industry demand continues to impact Deere. Credit Neutral
• Overall Equipment (ex-Fin. Services) revenues declined 9% y/y to $12bn due to lower equipment sales volumes across all 3 of Deere's segments as well as lower realized prices on larger Agriculture equipment and Construction machinery.
• Equipment operating margin was down 590 bps y/y to 14.6% as a result of lower overall shipment volumes, unfavorable sales mix in Large Agricultural machinery and higher costs due to tariffs.
• Deere provided an updated Industry Outlook for Ag & Turf market demand for FY25. Deere expects industry volumes to decline 30% in the US/Canada for Large Agricultural machinery with Europe flat to -5% and South America expected to be flat. For Construction/Forestry Equipment, Deere expects a 10% decline in the US/Canada for FY25 with flat to down 5% expected across ex-US markets.
• For the quarter, DE's adjusted EPS of $4.75 was slightly ahead of Bloomberg consensus estimates of $4.70.
• DE updated FY25 guidance with net income of $4.75bn-$5.25bn versus prior expectations of $4.75bn-$5.50bn and net operating cash flow of $4.5bn-$5.5bn versus FY24 CFO of $6.9bn (Equipment operations only).
• For Deere Equipment (ex-Fin. Services), the Company generated $1.56bn of FCF post-dividends and repurchased $298mm of shares in the quarter.
• The Company ended the quarter with gross leverage (ex-Financial Services) of ~1.5x which has increased ~0.5x from FYE24 due primarily to lower EBITDA vs. FY24 and a modest increase in gross debt outstanding.
• We note that DE keeps overall leverage at the Equipment Company relatively low given the cyclical nature of the business and management reiterated its top priority for use of Cash from Operations was to maintain "A" ratings. While leverage has increased, we wouldn't expect any rating impact and believe DE would use FCF to defend the current ratings.
Want to read more?
Find more articles and bullets on these widgets:
Historical bullets
US DATA: Restaurant Prices, Energy Services Boost Headline CPI
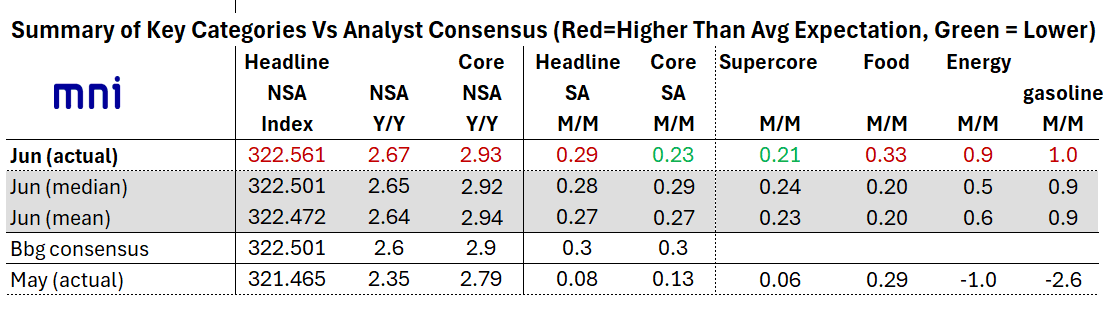
In contrast to core CPI, headline inflation was stronger in June than expected, rising 0.29% M/M (0.28% MNI median, 0.08% prior), for a 2.93% Y/Y rate (2.92% MNI median, 2.79% prior). Both food and energy came in above-expected.
- Energy had been expected to re-accelerate from -1.0% M/M in May, and duly delivered with a rise to a 5-month high 0.9% (0.946% unrounded, very close to a 1.0% unrounded figure) vs 0.5% MNI median. Gasoline was largely in-line with a 1.0% rise (0.9% MNI median, -2.6% prior), with the overall energy "beat" appearing to stem from energy services which rose 0.9% after 0.4%: gas service prices were up 0.5% after -1.0%, with electricity ticking up to 1.0% from 0.9%.
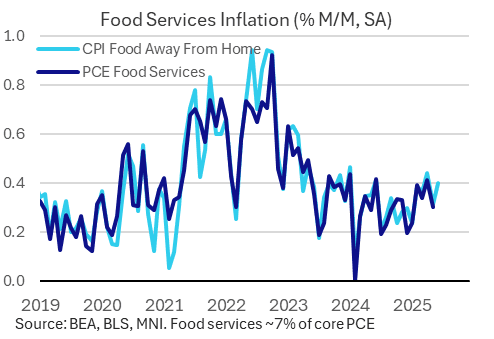
- The bigger surprise was in food prices, which rose to a 3-month high 0.33% M/M - an unexpected acceleration from 0.29% prior (0.24% MNI median expected).
- Food at home prices were steady at 0.28% M/M (0.27% prior) on a mixed performance across categories (BLS: "Three of the six major grocery store food group indexes increased in June, while the other three declined"), but food away from home inflation picked up to 0.40% (0.31% prior). The latter may provide a bit of a boost for core PCE expectations vs the initial CPI readthrough, as it feeds into the food services PCE category.'
US DATA: A Wide Range Of CPI Core Goods Items See M/M Acceleration In June
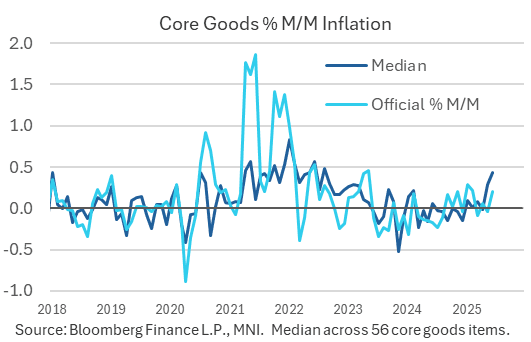
- Core goods inflation of 0.20% M/M was close to expectations in June (average of 0.18% M/M across seven analyst estimates) after -0.04% M/M in May and 0.06% in April.
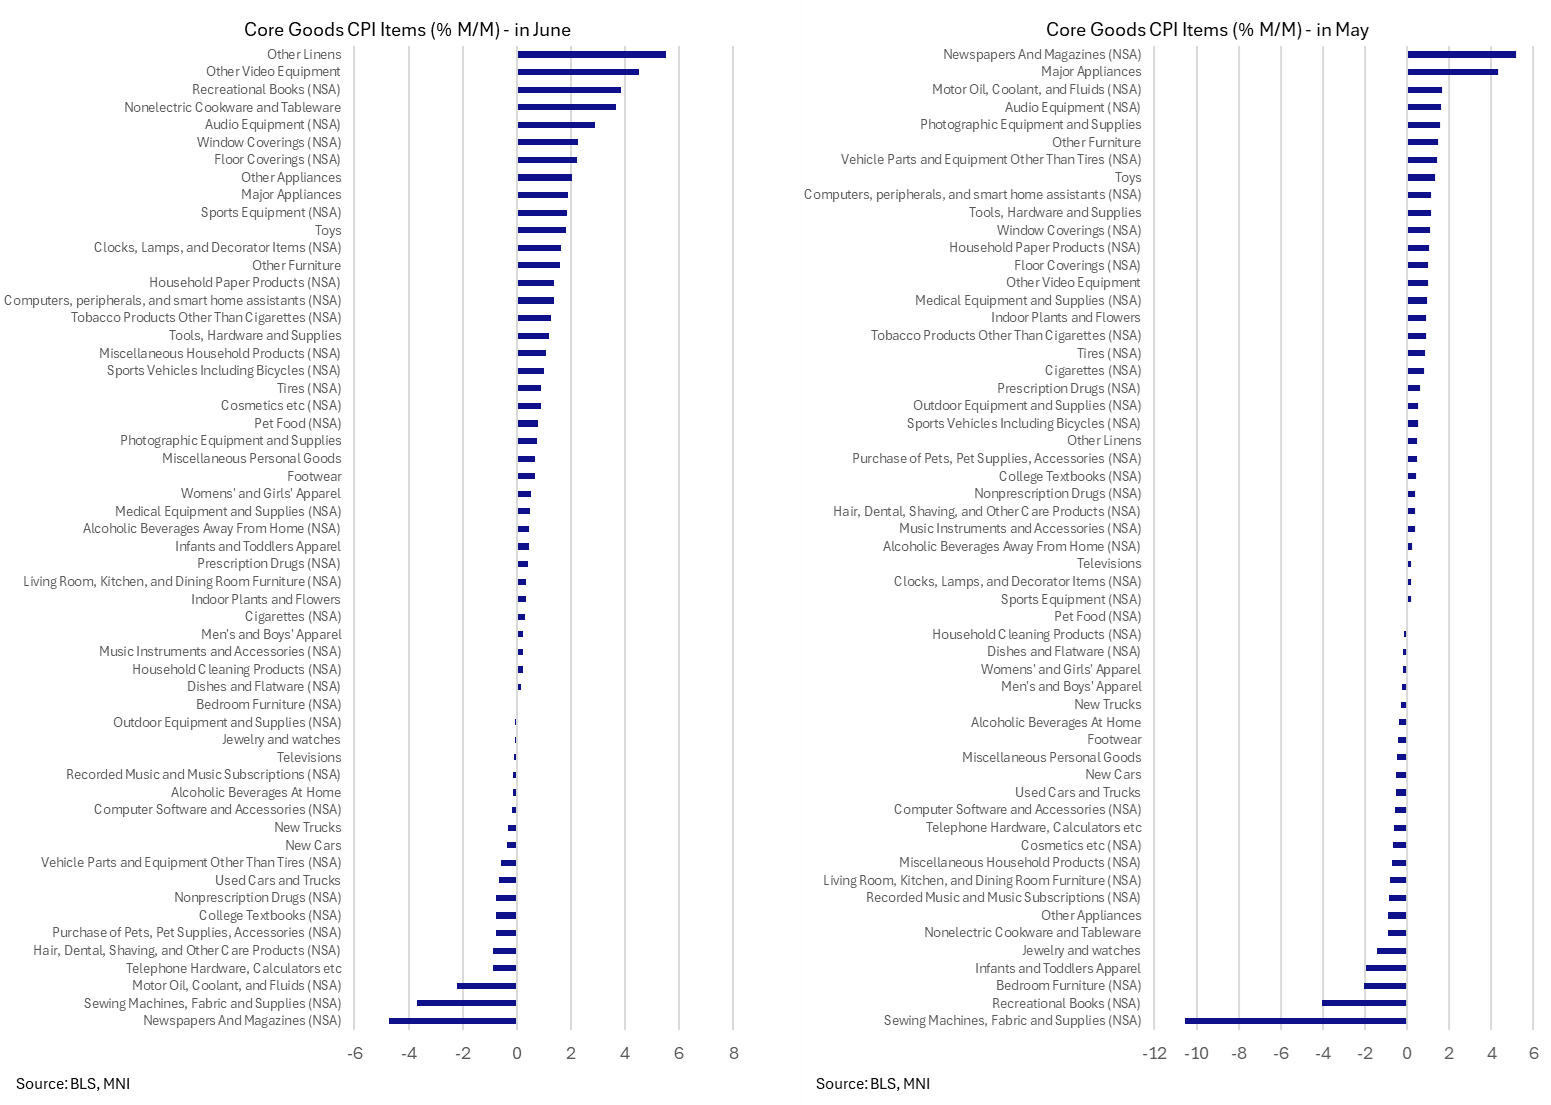
- It came despite a slightly larger than expected decline in used car prices (-0.67% M/M vs median estimate of -0.50% or mean of -0.15%) along with new cars also falling -0.3% M/M.
- These large ticket items masked a broader increase in core goods across 56 items for a second month, with a median increase of 0.44% M/M in June after 0.29% in May and -0.01% in April.
- This 0.44% M/M doesn’t materially change anything from a "largest since x" point (now since Aug and not Sep 2022) but is another marked acceleration – see chart.
- For context, this median averaged 0.32% in 2021 and 0.39% in 2022 and peaked at 0.84% in Jan 2022.
- One point of caution: you can see in the second chart below just how many of these series that feed into core goods are NSA.
STIR: Fed Pricing A Little More Dovish After CPI Took Edge Off Bessent's Comment
Fed pricing sees a modest dovish reaction to the CPI data, although the readings provided little differentiation vs. headline BBG survey expectations on net (but did include a 0.1ppt downside surprise for unrounded M/M core CPI & a 0.1ppt upside surprise for unrounded headline CPI).
- Unrounded supercore was pretty close to the average of a limited survey sample, with our macro team noting that it was core services that limited inflation, while core goods provided a slightly hawkish surprise (see previous bullets for greater details on the release)
- A reminder that hawkish adjustments were seen ahead of the data, after Treasury secretary Bessent’s left some feeling that there may have been a more hawkish surprise in the offing.
- We suggested that he may have just been referring to a roughly in-line print given consensus expectations for a move higher across the major CPI metrics vs. May levels. This seems to have been proven true.
- FOMC-dated OIS shows 1bp of easing for this month’s decision, 16bp through September, 31bp through October and 47bp through year-end.
- That compares to 1bp, 15bp, 29bp and 46bp ahead of the data and 1bp, 17bp, 31bp and 49bp before Bessent spoke.
- SOFR-implied terminal rate pricing at 3.22% vs. 3.25% ahead of the data and 3.23% pre-Bessent (corrected from 3.33% when previously published).