US DATA: Initial Claims Tick Up For A Second Week To 233-234k, Per MNI Estimates
Oct-10 12:39
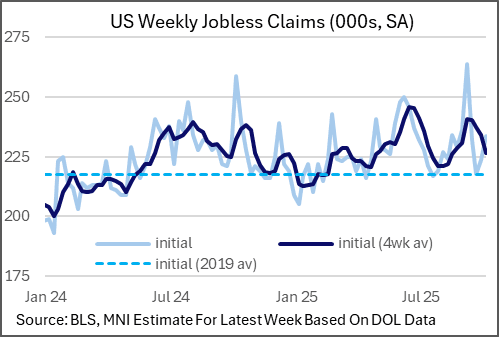
MNI estimates based on state-by-state data that initial jobless claims in the Oct 4 week of 233-234k (unrounded 233.5k) on a seasonally-adjusted basis, a notable rise from 224k (estimated) the prior week.
- If confirmed that would mark a second (unofficial) consecutive weekly increase and the largest rise in a month, as well as the the highest number of claims in 4 weeks.
- However, the higher claims weeks of late August/early September mean that the 4-week moving average continues to descend, to 227k in the latest week vs 234k prior, for a 7-week low.
- Also, there is likely to be a downward revision to those early September readings due to the identified Texas claims fraud that will very likely be revised at some point.
- As such excluding that Texas effect, overall claims have been hovering in a 217-237k range for the last 16 weeks, suggestive of a "low firing" labor market.
- MNI had estimated 223-225k initial claims in the prior week, dependent on the outcomes of Arizona, Massachusetts and US Virgin Islands claims which hadn't been published. While the Virgin Islands is still outstanding, the AZ and MA numbers were close enough to our estimates.
- This week, Hawaii (a relatively small state) and Massachusetts haven't reported. We assume the prior week's uptick was the usual seasonal norm for MA, and in the Oct 4 week it leveled off; however that assumption likely means that risks to our estimate are tilted slightly to the upside.
- One standout in the current week was Missouri whish saw a 3.9k uptick in claims (NSA), the largest rise since January and outside of the seasonal norms, though (obviously) no explanation was provided.
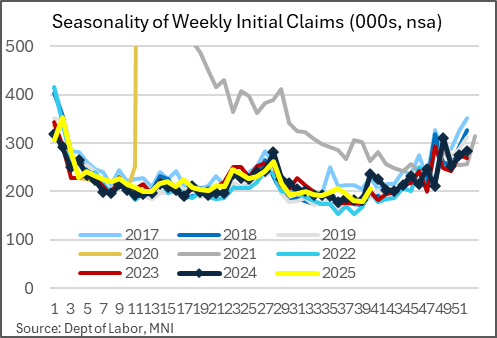
- The overall national NSA rise was 27.1k (to 206k), most since early June, though this was not outside of the seasonal norm.
Want to read more?
Find more articles and bullets on these widgets:
Historical bullets
US TSYS: Post-PPI React
Sep-10 12:34
- Fast two-way as Treasury futures extend lows before gapping higher after lower than expected PPI inflation data and down-revisions to prior.
- Currently, the Dec'25 10Y trades +2 at 113-13 (yld 4.0645 -.0230) vs. 113-16 high -- Initial resistance above at 113-21+ High Sep 5.
- Curves steeper: 2s10s +0.402 at 53.111, 5s30s +0.860 at 112.185.
- Soft PPI heads enough to re-trigger USD weakness, erasing the entirety of the morning's tepid gains on Poland/Russia headlines. GBP/USD's show back above 1.3550 tops out at 1.3563, still well short of yesterday's highs into 1.3590.
MNI: US AUG FINAL DEMAND PPI -0.1%, EX FOOD, ENERGY -0.1%
Sep-10 12:30
- MNI: US AUG FINAL DEMAND PPI -0.1%, EX FOOD, ENERGY -0.1%
- US AUG FINAL DEMAND PPI EX FOOD, ENERGY, TRADE SERVICES +0.3%
- US AUG FINAL DEMAND PPI Y/Y +2.6%, EX FOOD, ENERGY Y/Y +2.8%
- US AUG PPI: FOOD +0.1%; ENERGY -0.4%
- US AUG PPI: GOODS +0.1%; SERVICES -0.2%; TRADE SERVICES -1.7%
BONDS: Bid In E-minis Limits Demand Over Last Few Hours
Sep-10 12:27
Little to really add when it comes to FI-specific commentary, although another fresh all-time high for S&P 500 e-minis has limited rallies/applied pressure at stages over the past few hours.
- The previously covered block buy in TU futures has supported Tsys over the last hour or so, with that curve bull steepening on the day but back from highs (yields flat to 1bp lower).
- Meanwhile, Bunds (yields 1-2 bp higher) and gilts (yields 1.5-3.5bp higher) bear flatten.
- U.S. PPI data due shortly, presenting the major macro calendar event for the session.
- PPI is expected to slow, albeit with the major Y/Y readings still forecast above 3%. There will also be some focus on the revisions. See our recent run of bullets for more colour.