US DATA: Industrial Production Maintained At Best Steady Growth In September
Industrial production was broadly as expected in the shutdown-delayed September report, continuing to hold at three-year highs for the Y/Y even if that’s only 1.6%. Core durable goods orders data have recently been more upbeat but ISM Manufacturing Chair Spence offers a more pessimistic take.
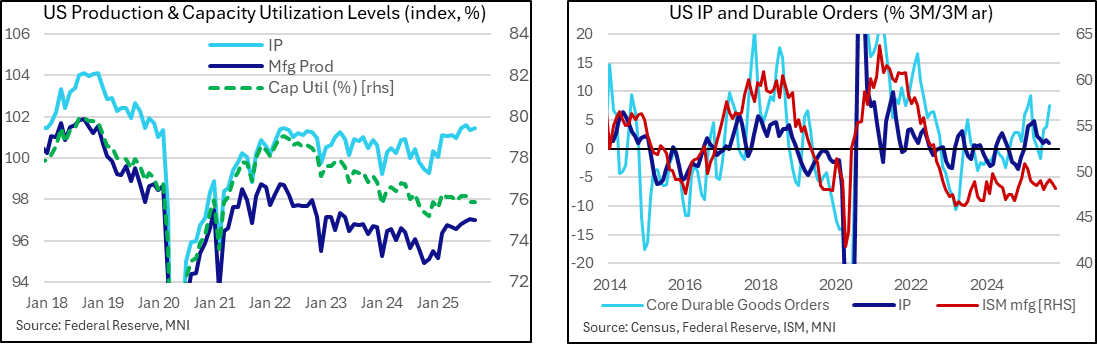
- Industrial production was as expected in September as it increased 0.10% M/M after a weaker than first thought -0.26% M/M in August but equally a stronger than previously thought 0.16% in July.
- Utilities production adds volatility here, as is quite typical, rising 1.1% M/M after -3.0% M/M.
- Instead, manufacturing production continued a recent moderation trend, now registering -0.04% M/M in September after three steadily slower increases through Jun-Aug including 0.08% in Aug.
- In trend terms, overall industrial production firmed to 1.6% Y/Y for a joint high since Sep 2022 (looking at the seasonally adjusted data), whilst recent momentum is softer at 1.1% annualized on a 3m/3m basis.
- Manufacturing production paints a similar picture, at 1.5% Y/Y (highest since Apr 2022) and 1.3% annualized.
- Last week’s delayed September for durable goods orders offered a more upbeat tone (7.6% 3m/3m annualized, 4.0% Y/Y in nominal terms) but ISM manufacturing chair Susan Spence offered a more cautious take in Monday’s exclusive with MNI: "There's nothing that we're reading or seeing in the news and what's going on with tariffs that give me any confidence that all of a sudden the customers are going to come start ordering from us”.
- Capacity utilization meanwhile held steady at 75.9% with the Bloomberg calendar not capturing previously large downward revisions from 77.4% in annual revisions. Whilst off lows of 75.2% in late 2024, it still holds a sizeable trend easing in recent years and has stabilized before pre-pandemic rates.
Want to read more?
Find more articles and bullets on these widgets:
Historical bullets
EURUSD TECHS: Bear Leg Extends
- RES 4: 1.1779 High Oct 1
- RES 3: 1.1728 High Oct 17
- RES 2: 1.1669 High Oct 28 and key resistance
- RES 1: 1.1577 Low Oct 22
- PRICE: 1.1530 @ 16:24 GMT Nov 3
- SUP 1: 1.1505 Low Nov 3
- SUP 2: 1.1460 1.382 proj of the Oct 17 - 22 - 28 price swing
- SUP 3: 1.1392 Low Aug 1 and bear trigger
- SUP 4: 1.1313 Low May 30
EURUSD traded lower Monday, as the current bear leg extends. The pair last Friday breached an important support at 1.1542, the Oct 9 low. This confirms a resumption of the current downtrend. Note that 1.1516, the 76.4% retracement of the Aug 1 - Sep 17 bull leg, has been pierced. A clear break of this level would expose key support at 1.1392, the Aug 1 low. Resistance to watch is 1.1669, the Oct 17 high.
US OUTLOOK/OPINION: GDPNow Firms Further To 4.0% For Q3
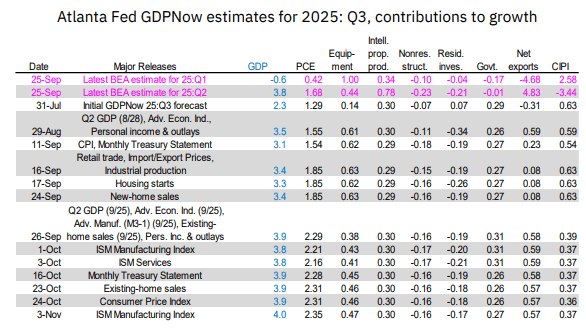
- It has less to go on under the government shutdown but the Atlanta Fed’s GDPNow estimate has been revised up marginally to 3.99% annualized for Q3 real GDP growth, a fresh high, after 3.93% on Oct 24.
- Whilst it isn’t a material departure from the 3.8-3.9% updates seen through October, it’s still solid considering today’s ISM manufacturing report surprised to the downside.
- The small upward revision from Oct 24 is led by an additional 0.04pps coming from personal consumption. Equipment investment tracking was also revised up from 8.7% to 9.0% but that’s only worth an extra 0.01pp to GDP.
- It points to robust GDP growth after the 3.8% in Q2 and -0.6% in Q1, or an average of 1.6% through 1H25 when trying to control for tariff front-running, after the 2.4% through 2024.
- Alternatively, private domestic final purchases (PDFP – a favorite of Fed Chair Powell) is seen on track for a strong ~3.2% in Q3. That would be a further recovery from the 2.4% averaged in 1H25 after the 2.9% through 2024.

PIPELINE: Corporate Bond Update: Alphabet, EBAY Guidance Updated
- Date $MM Issuer (Priced *, Launch #)
- 11/03 $Benchmark Alphabet 8-pt jumbo*: 3Y +30, 3Y SOFR+52, +5Y +40, 7Y +50, 10Y +62, 20Y +72, 30Y +82, 50Y +107 (massive debt issuance includes $6.5B over 6 tranches: 3Y, 6Y, 7Y, 13Y, 19Y and 39Y).
- 11/03 $4B #Qatar $1B 3Y +15, $3B 10Y Sukuk +20
- 11/03 $2B Tenet 7NC3 5.5%a, 8NC3 6%a
- 11/03 $1B Neptune Bidco 5.5NC2
- 11/03 $600M #WEC Energy 30.5NC5.25 5.625%
- 11/03 $500M #Lincoln National 10Y +125
- 11/03 $500M Howmet Aerospace WNG 7Y +95a
- 11/03 $Benchmark Novartis Capital 7Pt**: 3Y +55a, 3Y SOFR, 5Y +70a, 7Y +75a, 10Y +80a, 20Y +80a, 30Y +90a
- 11/03 $Benchmark Shell 5Y +80a, 5Y SOFR, +10Y +95a
- 11/03 $Benchmark UBS 8NC7 +120a, 21.5NC20.5 +115a
- 11/03 $Benchmark Peoples Republic of China 3Y, 5Y
- 11/03 $Benchmark EBAY 3Y +65, 10Y +103
- 11/03 $Benchmark Mattel investor calls
- *Prior Alphabet issuance for comparison: $5B on April 28 of this year ($750M 5Y +32, $1.25B 10Y +47, $1.5B 30Y +62, $1.5B 40Y +70) a long stretch since issuing $10B on Aug 3 2020 ($1B 5Y +25, $1B 7Y +45, $2.25B 10Y +58, $1.25B 20Y +73, $2.5B 30Y +88 and $2B 40Y +108)
- **Prior Novartis $3.7B on September 16, 2024: $1B 5Y +45, $850M 7Y +57, $1.1B 10Y +67, $750M 30Y +77