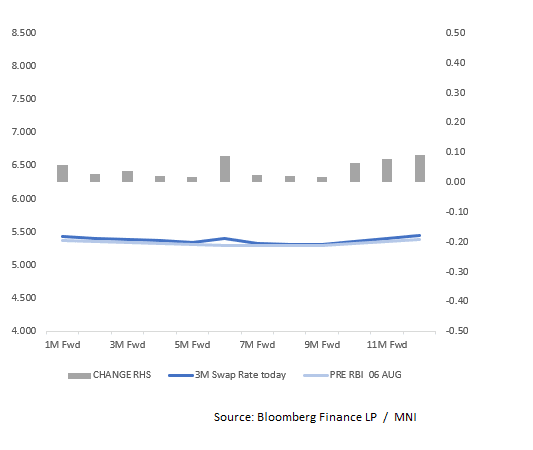
INDIA: India Updated Swaps Pricing Vs. Pre-RBI Meeting Levels
- We assess the change in expectations for rate move via an analysis of the swaps curve. We compare the three month on a forward basis each month out to 12 months. We look to use this as an indicator for a change in expectations from week to week, comparing it to the FBIL Overnight Mumbai Interbank Outright Rate (FBIL- Overnight MIBOR) as per market standard.
- The swaps curve has 4bps of increases over the next 12 months up from 3bps earlier this week. By way of comparison, the BBG MIPR function has no change over the next 12 months, from -7bp.
Want to read more?
Find more articles and bullets on these widgets:
Historical bullets
GLOBAL MACRO: Sharp Narrowing In US Deficits With China, EU & Canada
In line with global export growth peaking in March, US data shows that its trade deficit peaked at the same time. Countries front loaded shipments to beat the early April reciprocal tariff announcement. Ship tracking data for May show that the number of container vessels moderated, and consistent with this the US June visible trade deficit fell to its lowest in over two years. Given the bringing forward of shipments, the data is going to be difficult to interpret over H2. It will take time to see what the impact from the increase in the US effective tariff rate to around 16% will be on the deficit.
- Bilateral balances have generally turned over 2025. The deficit with Canada narrowed around $2.1bn in June from March but almost $10bn since January, China’s $8.4bn and $22.2bn respectively and the EU’s $37.6bn and $13.4bn.
- Looking at Asian trends, the 12-month sum of the US deficit with Japan has stabilised, narrowed with China and Korea, but deteriorated with India and especially Taiwan.
US merchandise trade deficit $bn 12mth sum
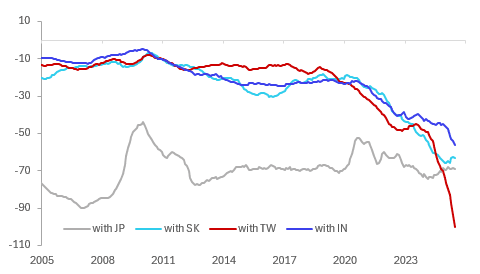
- The monthly deficit with Taiwan has consistently widened over 2025 as negotiations with the US took place. Its reciprocal tariff was reduced to 20% from 32% but uncertainty over its key chip shipments continues. The number of ships leaving for the US has moderated since late July but remain around the recent average.
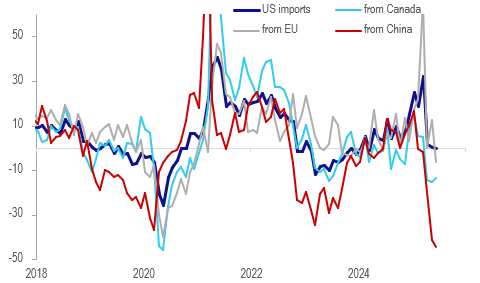
- US imports growth peaked in March at 32.3% y/y and fell 0.2% y/y in June driven by sharp declines from its main trading partners. Imports from Canada fell 13.7% y/y, 6.3% from the EU but a sharp 44.5% from China.
- There also seems to have been a frontloading of US exports with growth peaking at 10.8% y/y in April as firms were likely concerned about retaliation. This has moderated since with June only 3.4% y/y.
US merchandise imports y/y%
Source: MNI - Market News/LSEG
AUSSIE BONDS: Little Changed On A Subdued Data-Light Session
ACGBs (YM -0.5 & XM -1.0) are little changed on a data-light session.
- Cash US tsys are flat to 1bp cheaper, with a steepening bias, in today's Asia-Pac session after yesterday's twist-flattener.
- Cash ACGBs are 1bp cheaper with the AU-US 10-year yield differential at +2bps.
- The latest ACGB Mar-36 auction saw strong demand, with the weighted average yield coming in 0.21bps through prevailing mid-yields, according to Yieldbroker, continuing the trend of firm pricing at recent ACGB auctions. However, the cover ratio collapsed to 3.3111x from 4.45x.A$1000mn of the 3.00% 21 November 2033 bond is planned for Friday.
- The bills strip is weaker, with pricing -1 to -3.
- RBA-dated OIS pricing is little changed across meetings today. A 25bp rate cut in August is given a 100% probability, with a cumulative 63bps of easing priced by year-end (based on an effective cash rate of 3.84%).
BOJ: Rinban Purchase Offer
The BoJ offers to buy a total of Y885bn of JGBs from the market:
- Y100bn worth of JGBs with <1 Year until maturity
- Y325bn worth of JGBs with 1-3 Years until maturity
- Y325bn worth of JGBs with 3-5 Years until maturity
- Y135bn worth of JGBs with 10-25 Years until maturity