US DATA: Imports Surprisingly Jumped On A Different Type Of Gold (1/2)
Sep-04 17:09
- The goods & services trade balance was close to expectations in July at a deficit of $78.3bn (cons $77.9bn) after a downward revised $59.1bn (initial $60.2bn) in June.
- The goods deficit widened from $85.7bn to $103.9bn whilst the services surplus narrowed from $26.6bn to $25.6bn.
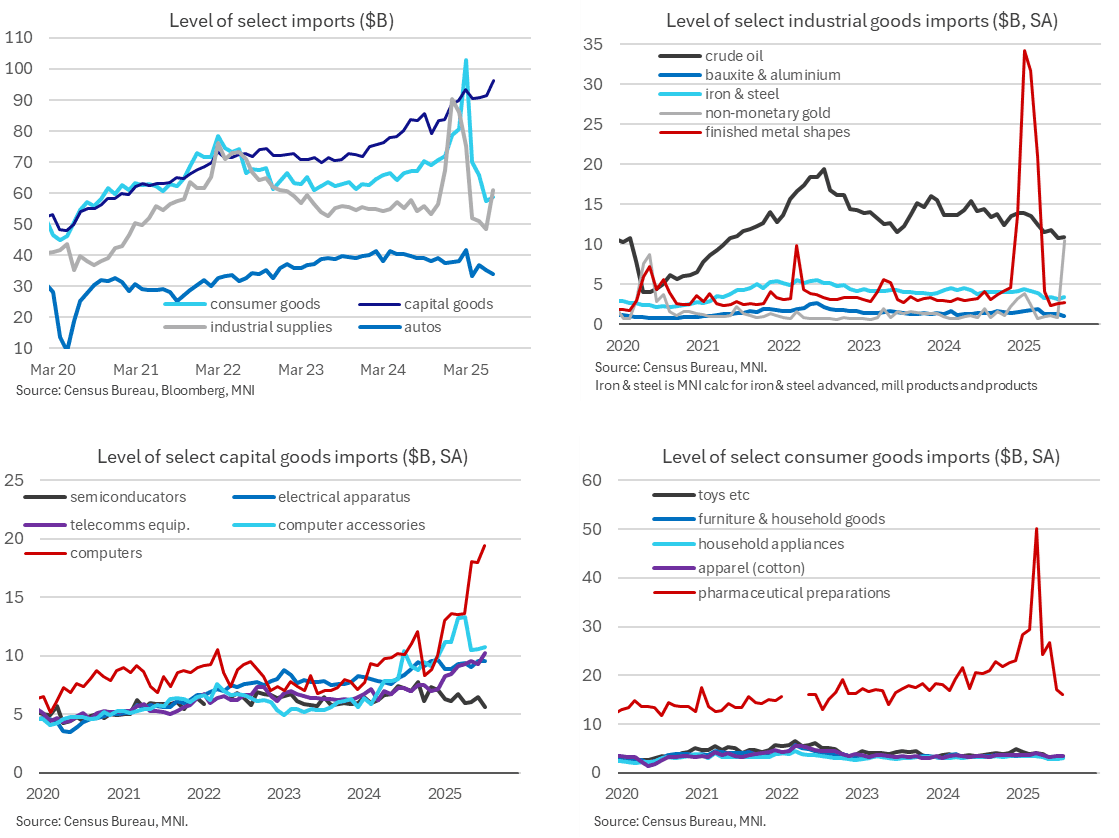
- Today’s more detailed release confirmed that the widening in the goods deficit was primarily driven by stronger imports of industrial supplies followed by imports of capital goods.
- More surprisingly though, of the $12.5bn increase in industrial supplies, $9.6bn came from non-monetary gold. This is different to when monetary gold related imports increased in Dec and then continued to surge in Jan-Mar on tariff front-running, causing caused distortions in GDP tracking. This monetary gold showed up in “finished metal shapes” but isn't seen as a productive asset and is therefore excluded from GDP calculations).
- It’s this realization that it wasn’t monetary gold driving the rise in imports in July that likely played a role in the 0.41pp downward revision in the net trade component from today’s Atlanta Fed GDPNow estimate (from 0.69pp to 0.28pp) as noted earlier. GDPNow essentially excludes the broad-based industrial supplies category when assessing the flash trade release published last week before being refined with today's new information.
- As for capital goods, the $4.7bn increase to $91.5bn was more broad-based but led by computers (+$1.5bn to $18.0bn) and telecommunications equipment (+$0.9bn to $9.3bn).
Want to read more?
Find more articles and bullets on these widgets:
Historical bullets
US TSYS/SUPPLY: Review 3Y Note Auction: Another Small Tail
Aug-05 17:03
- Treasury futures remain weaker, little react after $58B 3Y note auction (91282CNU1) tails yet again: drawing 3.669% high yield vs. 3.662% WI; 2.53x bid-to-cover vs. 2.51x prior.
- Peripheral stats see indirect take-up slips to 53.99% vs. 54.11% prior; direct bidder take-up 28.13% from 29.38% prior; primary dealer take-up rises to 17.88% vs. 16.51% prior.
- The next 3Y auction is tentatively scheduled for September 9.
FED: US TSY 3Y NOTE AUCTION: HIGH YLD 3.669%; ALLOTMENT 72.30%
Aug-05 17:02
- US TSY 3Y NOTE AUCTION: HIGH YLD 3.669%; ALLOTMENT 72.30%
- US TSY 3Y NOTE AUCTION: DEALERS TAKE 17.88% OF COMPETITIVES
- US TSY 3Y NOTE AUCTION: DIRECTS TAKE 28.13% OF COMPETITIVES
- US TSY 3Y NOTE AUCTION: INDIRECTS TAKE 53.99% OF COMPETITIVES
- US TSY 3Y AUCTION: BID/CVR 2.53
EURUSD TECHS: Corrective Cycle
Aug-05 17:00
- RES 4: 1.1851 High Sep 10 2021
- RES 3: 1.1829 High Jul 01 and the bull trigger
- RES 2: 1.1789 High Jul 24
- RES 1: 1.1617 20-day EMA
- PRICE: 1.1578 @ 16:43 BST Aug 5
- SUP 1: 1.1401 Low Jul 30 and a bear trigger
- SUP 2: 1.1373 Low Jun 10
- SUP 3: 1.1313 Low May 30
- SUP 4: 1.1184 38.2% retracement of the Feb 3 - Jul 1 bull cycle
Despite Friday's rally and a late recovery into the Tuesday close, EURUSD maintains a bearish tone. The recent breach of key support at the 50-day EMA, at 1.1548, highlights a stronger reversal and the start of a correction. This opens 1.1373 next, the Jun 10 low. Firm resistance is seen at 1.1617, the 20-day EMA, where a break is required to signal a reversal. This week’s price action highlights a key short-term support and bear trigger at 1.1401, Jul 30 low. A break would resume the downtrend.