US DATA: Huge Jump In New Home Sales At Odds With Broader Indicators
Sep-24 14:26
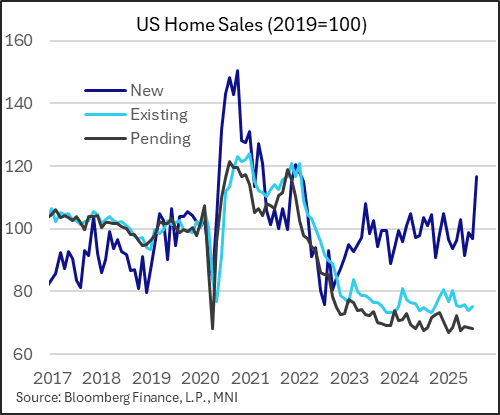
New single-family home sales soared in August to 800k on a seasonally adjusted annualized basis, a 20.5% rise from 664k in July (rev from 652k). A slight decline had been expected to 650k, but instead sales jumped to the highest rate since January 2022.
- There was no explanation for the surge in the Census Bureau release. For now we treat this reading with caution, and consider it an anomaly that's likely to see reversion in coming months.
- It's at odds with continued decade-plus lows in NAHB single-family homebuilder sentiment through September, and comes ahead of the recent improvement in mortgage rates (which in any case haven't seen an appreciable rise in mortgage purchase applications).
- We know from the NAHB report that builder incentives for buyers hit a 5-year high in August (66% used such incentives), which may also have played a factor.
- With August typically a down month for sales M/M on a non-seasonally-adjusted basis (only 2 of the prior 10 years saw NSA rises in August), the SA will have provided a boost too: NSA sales were 66k sales in August, up 10k from July and 56k in August 2024. 9k of the 10k Y/Y jump was in the South, so there may have been a one-off explanation for this.
- All four national regions saw sizeable increases in sales - while the Northeast saw a 72% M/M increase, that was from a low base (31k from 18k), the biggest contributor was the 25% rise in the South (530k from 425k).
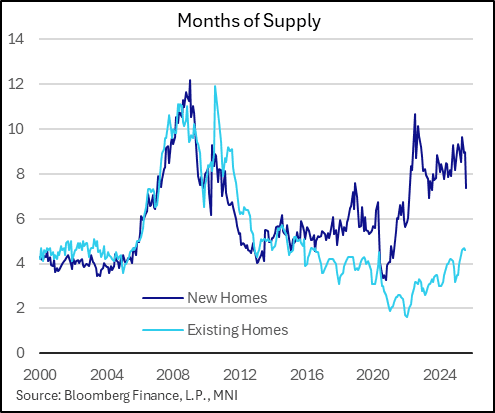
- This implied a sudden tightening of inventory: months of supply vs current sales fell to a 25-month low 7.4 from 9.0.
- % Y/Y prices rose 1.9% to $413.5k (not seasonally-adjusted), but remained below the month-of-August peak of $441k in 2023.
Want to read more?
Find more articles and bullets on these widgets:
Historical bullets
US DATA: New Home Sales Activity Not As Bad As Once Thought, But Still Weak
Aug-25 14:21
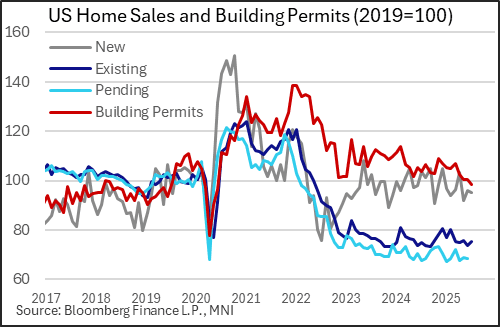
New home sales were much stronger than expected in July, with an upward revision to June suggesting that activity has been stronger this summer than previously estimated - but nonetheless, broader trends of elevated inventories and falling prices continue to suggest increasing slack in the new build market.
- The June reading of 652k (seasonally-adjusted, annualized) was better than the 630k Bloomberg consensus, but actually represented a slight fall (-0.6%) on the month due to a sizeable upward revision to June to 656k (from 627k). This is a significant improvement from May's near-18 month low (623k), though still keeps sales below pre-pandemic (2019) levels (and down 8% Y/Y).
- Regionally, sales were mixed, with falls in the Northeast and West more than compensated for by rises in the South and Midwest.
- The pickup in activity will be welcome news for homebuilders, though the rest of the data remained tenuous.
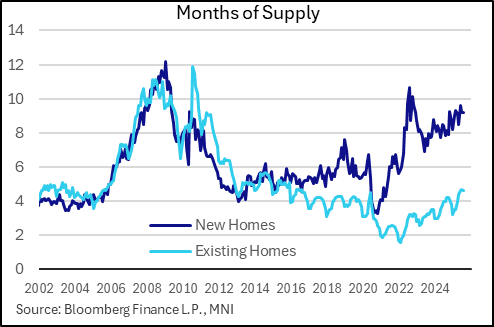
- One element of good news was that revisions were also seen in lower inventories, closer to 500k the last couple of months whereas June's data had previously shown 511k houses on the market which would have been highest since October 2007 (instead, the distinction of highest since 2007 reverts to March's 504k).
- That said, inventories remain over 9 months of supply equivalent (9.2 for 2 consecutive months) albeit a little below the 9.6 in May though well above levels that prevailed in the tight markets of 2021-23 and above the 7.9 months a year earlier.
- Additionally the data showed a 5.9% Y/Y fall in median prices ($403.8k, $20-30k below prices seen in 2022-23 at the height of the market).
- As such the broad sweep of data continue to indicate deterioration in the new homes market overall, though it may be worsening at a lesser rate than previously thought. This will continue to keep a lid on residential construction activity.
US TSY FUTURES: BLOCK: Sep'25 2Y Buy
Aug-25 14:15
- +6,000 TUU5 103-27.62, but through 103-27.5 offer at 1001:00ET, DV01 $215,400.
- Futures continue to unwind Friday's post-Chair Powell rally, however, with the 2Y contract trading 103-27.38 (-2.75)
US TSYS: Post-New Home Sales React
Aug-25 14:00
- Treasury futures maintain losses after higher than expected new home sales.
- Tsy Sep'25 10Y futures currently trades -7 at 111-29.5 - session low but still above support at the 50-day EMA, at 111-13. A clear break of this average would expose support at 110-23+, the Aug 1 low
- 10Y yield +.0311 at 4.2848%
- Curves mildly flatter: 2s10s -0.033 at 55.494, 5s30s -.398 at 111.081.