GLOBAL MACRO: Global PMI Suggests Weaker IP Growth In Q3
The JP Morgan global manufacturing PMI has been oscillating around the breakeven-50 mark since November as uncertainty remained high. In July it dipped below 50 at 49.7 after June’s 50.4. Recently it has been consistent with low but steady IP growth of 1.5-3%. The PMI is suggesting that after this event, industrial production growth is likely to slow back to within that range.
Global growth %
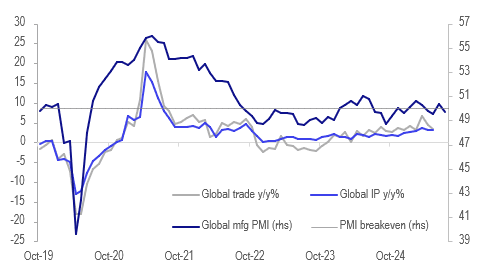
- CPB Global IP rose 0.3% m/m in May, the fourth consecutive increase, to hold annual growth at 3.1% y/y. It peaked in March at 3.6% y/y in line with the high in global export growth as shipments were frontloaded ahead of initial US tariff deadlines.
- The dip in the July manufacturing PMI was driven by output, orders and future output. The decline in orders was due to the exports contracting at a sharper rate with the index at 48.2 after 49.2, but still above both April and May.
- Growth in future output is still expect to be positive just less so than in June at 58.9 after 60.2 but is still above 2025’s low of 57.1 in April.
- Production was down in July in consumer, intermediate and capex goods sectors.
- Employment contracted at a slightly stronger rate in July but was close to unchanged with the PMI at 49.4 in July down from 49.7, but the 12th consecutive cut in staffing.
- Both input and output inflation in the PMI were little changed.
- Emerging Asia continued to outperform with India’s PMI showing the fastest growth followed by Vietnam and Thailand, according to JP Morgan/S&P Global. At the other end, Taiwan saw the worst contraction.
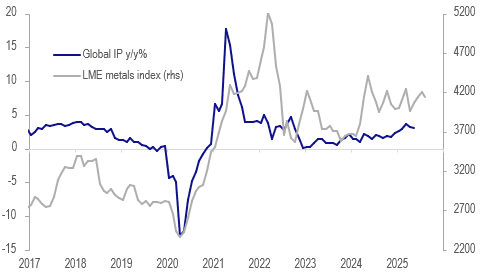
- Metal and wool prices as well as the Baltic Freight Index signal that global IP growth should remain close to recent rates around mid-year even if it does moderate after frontloading of exports.
Global IP y/y% vs LME metal prices
Want to read more?
Find more articles and bullets on these widgets:
Historical bullets
USDCAD TECHS: Trend Outlook Remains Bearish
- RES 4: 1.4111 High Apr 4
- RES 3: 1.4016 High May 12 and 13 and a key resistance
- RES 2: 1.3920 High May 21
- RES 1: 1.3674/3776 20- and 50-day EMA values
- PRICE: 1.3607 @ 16:12 BST Jul 4
- SUP 1: 1.3557 Low Jul 03
- SUP 2: 1.3540 Low Jun 16 and the bear trigger
- SUP 3: 1.3503 1.618 proj of the Feb 3 - 14 - Mar 4 price swing
- SUP 4: 1.3473 Low Oct 2 2024
The trend needle in USDCAD points south and this week’s move down reinforces current conditions. S/T gains between Jun 16 - 23 appear to have been corrective. Key support and the bear trigger is 1.3540, Jun 16 low. Clearance of this level would resume the downtrend and open 1.3503, a Fibonacci projection. Pivot resistance is at the 50-day EMA, at 1.3776. A clear break of this average would signal scope for a stronger recovery.
AUDUSD TECHS: Bull Cycle Remains In Play
- RES 4: 0.6700 76.4% retracement of the Sep 30 ‘24 - Apr 9 bear leg
- RES 3: 0.6688 High Nov 7 ‘24
- RES 2: 0.6603 High Nov 11 ‘24
- RES 1: 0.6590 High Jul 01
- PRICE: 0.6548 @ 16:05 BST Jul 04
- SUP 1: 0.6521 20-day EMA
- SUP 2: 0.6468/6373 50-day EMA / Low Jun 23 and a reversal trigger
- SUP 3: 0.6357 Low May 12
- SUP 4: 0.6275 Low Apr 14
The trend set-up in AUDUSD remains bullish and the pair is holding on to its recent gains. The latest break higher maintains the bullish price sequence of higher highs and higher lows, the definition of an uptrend. Moving average studies are in a bull-mode position, highlighting a dominant uptrend. Sights are on 0.6603 next, the Nov 11 2024 high. Key short-term support has been defined at 0.6373, the Jun 23 low.
EURJPY TECHS: Northbound
- RES 4: 171.88 High Jul 19 ‘24
- RES 3: 171.28 1.382 proj of the Feb 28 - Mar 18 - Apr 7 price swing
- RES 2: 171.09 High Jul 23 ‘24
- RES 1: 170.61 High Jul 03
- PRICE: 170.22 @ 16:04 BST Jul 04
- SUP 1: 169.04 Low Jul 02
- SUP 2: 167.87 20-day EMA
- SUP 3: 167.13 Low Jun 20
- SUP 4: 165.66 50-day EMA
EURJPY traded higher on Thursday resulting in a print above 170.47, the 76.4% retracement of the Jul 11 - Aug 5 sell-off. A clear break of this price point would strengthen bullish conditions and signal scope for extension. This would open 170.28 next, a Fibonacci projection. The trend is overbought, a pullback would unwind this condition. Support to watch lies at 167.87, the 20-day EMA.