FOREX: G10 Wrap - USD Struggling To Hold Onto Gains
The BBDXY has had an Asian range of 1220.34 - 1223.25, Asia is currently trading around 1221. The USD continues to struggle on any rallies, Asia has seen it give back all of its FOMC gains to a trade deal reportedly with the UK as per the NYT. MNI BOE Decision - Consensus is for a 25bp cut with a question mark over how many members will vote for a 50bp cut. Since the last meeting, most MPC speakers have stuck to the script of tariffs being negative for growth but that the impact on inflation was unclear. The forecasts in the MPR may give them more to base updated communications on. However, with uncertainty so high, we think there is a good chance that some of the structure of the existing guidance remains.
- EUR/USD - Asian range 1.1300 - 1.1336, Asia is currently trading 1.1325. Intra-day support is around the 1.1250 area, should this area not hold demand should remerge on dips back to 1.1100.
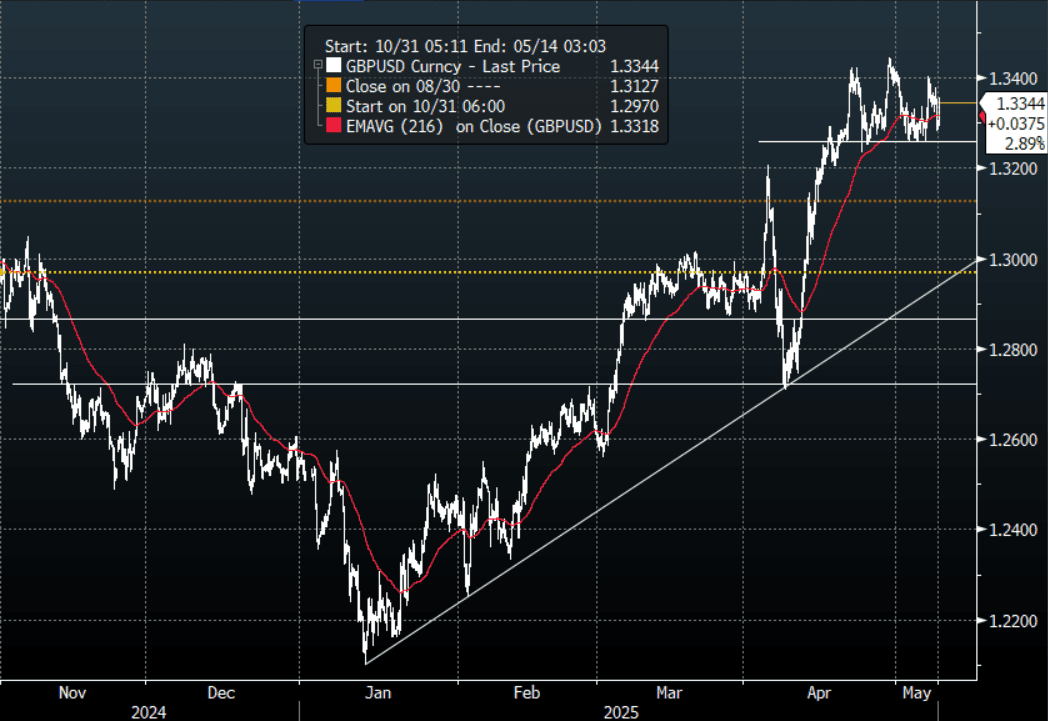
- GBP/USD - Asian range 1.3286 - 1.3356, Asia is currently dealing around 1.3345, having benefited from the trade deal announcement. Intra-day support is around the 1.3250 area, then the pivotal 1.30/31 support is next.
- USD/JPY - Asian range 143.45 - 143.96, pretty muted price action in the Asia session. Sellers should be lining up back towards 146.00/147.00
- USD/CNH - Asian range 7.2167 - 7.2369, the USD/CNY fix printed 7.2073. Asia is currently dealing around 7.2340, sellers should return back towards 7.2500.
- Cross asset : SPX +0.8%, Gold $3390, US 10-Year 4.29%, BBDXY 1220, Crude oil $58.62.
Data/Events : Ger Industrial Production, Spain Industrial Production, US Initial Jobless Claims
Fig 1: GBP/USD Spot Hourly Chart
Source: MNI - Market News/Bloomberg
Want to read more?
Find more articles and bullets on these widgets:
Historical bullets
JGBS AUCTION: 30Y Supply Shows Very Poor Demand Metrics
The 30-year bond auction delivered disappointing results. The low price came in at 100.00, falling short of dealer expectations according to a Bloomberg poll. The cover ratio declined to 2.9582x from 3.4997x, while the auction tail widened significantly to 0.75 — the largest since 2023 — up from just 0.12 previously, all pointing to noticeably weaker demand.
- This follows a 10-year auction earlier in the week, which showed mixed demand metrics.
- As noted in our auction preview, today’s supply lands against a backdrop of elevated global market volatility, following President Trump’s announcement of reciprocal tariffs last week.
- With these dynamics in play, today’s 30-year auction was always going to be a key test for investor demand amid ongoing uncertainty.
- The 30-year JGB remains approximately 1bp cheaper than pre-auction levels in early afternoon trading.
JGBS AUCTION: 30-Year JGB Auction Results
The Japanese Ministry Of Finance (MoF) sells ¥600.6bn 30-Year JGBs:
- Average Yield: 2.414% (prev. 2.500%)
- Average Price: 99.75 (prev. 96.57)
- High Yield: 2.457% (prev. 2.508%)
- Low price: 99.00 (prev. 96.45)
- % Allotted At High Yield: 33.8235% (prev. 92.5925%)
- Bid/Cover: 2.9582x (prev. 3.4997x)
CROSS ASSET: Risk Parity - Is The Party Over ?
Over the last 15 years there has been a mass migration to passive funds in the trillions of USD’s. The growth in these funds have been extraordinary at the expense of the active funds and in 2024 total assets in passive mutual funds and ETF’s surpassed those in active ones.
- With the allure of low fees, broad diversification and liquidity, Risk Parity became the new buzz word.
- The Cons though are beginning to mount. Capital floods into the same names, amplifying market weightings.
- No fundamental discrimination, it will buy whatever the index holds regardless of macro risks or price discovery. As long as money comes in the fund continues to pay the highs.
- This all works very well in a 15 year bull market that has consistently been protected by the FED put.
- What happens in a bear market ? Redemptions spike and just like when they buy on the way up at the highs, there is no fundamental discrimination on execution so as redemptions hit the fund will sell at the lows.
- This can amplify downside risks to the market especially in the names that are most heavily held.
- As you can see from the graph below Risk Parity has put in a lower high around the 850 area and is now looking to break below its pivotal 750/750 support. A move back through here would see redemptions begin to increase and the negative feedback loop in stocks would add a serious headwind to risk.
Risk Parity Index

Source: MNI - Market News/Bloomberg