ASIA STOCKS: Equity Outflows Accelerate - Taiwan -$3.8bn Last Two Days
Asian markets saw an increase in equity outflow pressures yesterday. Tech sensitive plays, particularly Taiwan, saw the brunt of the selling pressure. For Taiwan, offshore investors have sold just over $3.8bn of local stocks in the last two sessions. For South Korea we have seen just over $1.6bn in net selling. Tech/AI valuation concerns continues to see tech equity indices struggle, although the MSCI IT index posted a small rise for Tuesday. The Kospi is up modestly in the first part of Wednesday trade, but offshore investors are still net sellers per the NBUY function on BBG.
- In SEA, we saw net selling as well across the board, as broader equity sentiment was challenged yesterday. Today's focus will rest with central bank decisions in Indonesia and Thailand. The BoT is expected to cut, while BI is seen on hold, albeit in close run decision (with some analysts seeing a cut).
Table 1: Asian Markets Net Equity Flows
| Yesterday | Past 5 Trading Days | 2025 To Date | |
| South Korea (USDmn) | -939 | -837 | -5654 |
| Taiwan (USDmn) | -2117 | -3238 | -7912 |
| India (USDmn)* | 64 | -591 | -17686 |
| Indonesia (USDmn) | -56 | 55 | -1602 |
| Thailand (USDmn) | -11 | -16 | -3273 |
| Malaysia (USDmn) | -33 | -97 | -4806 |
| Philippines (USDmn) | -7 | -44 | -844 |
| Total (USDmn) | -3098 | -4769 | -41777 |
| * Data Up To Dec 15 |
Source: Bloomberg Finance L.P./MNI
Want to read more?
Find more articles and bullets on these widgets:
Historical bullets
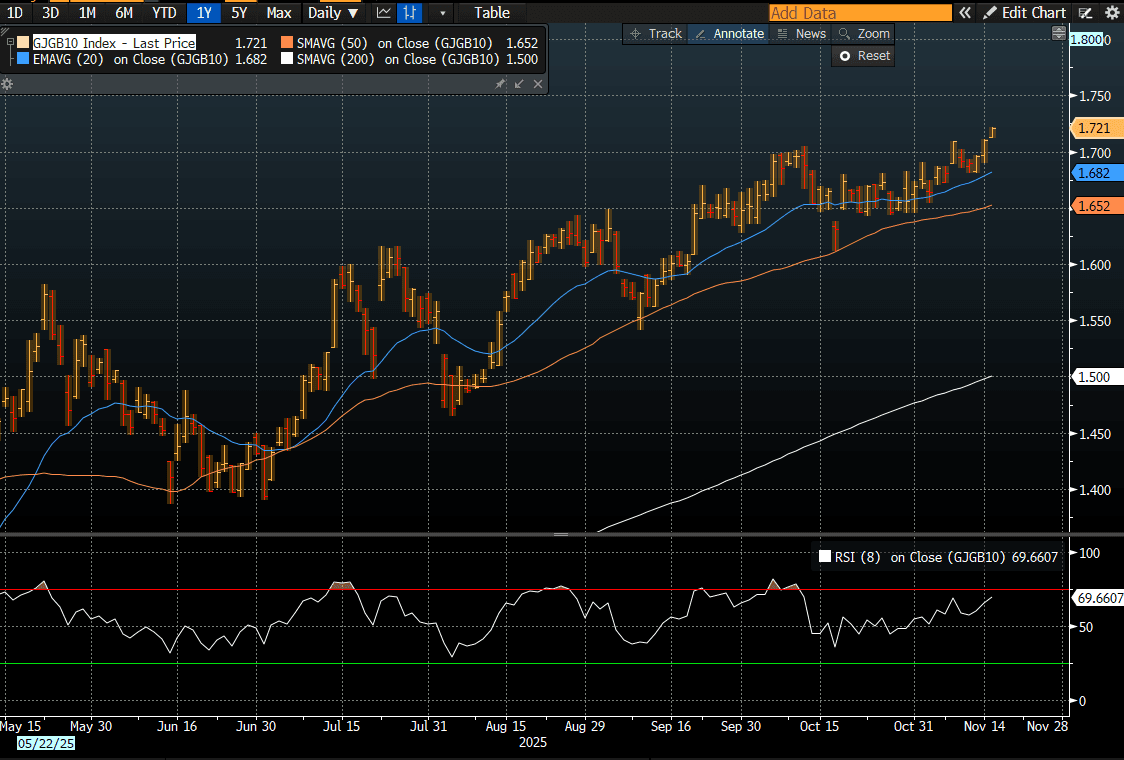
JGBS: Cheaper After Smaller Than Expected Drop In Q3 GDP, 10YY Fresh Cycle High
In Tokyo morning trade, JGB futures are weaker and at session lows, -16 compared to settlement levels, after the release of Q3 GDP data.
- Q3 GDP (preliminary) in Japan was negative q/q, but not as much as the market forecast, thanks to upbeat business spending (+1.0%q/q versus -0.1% forecast). This was the first GDP decline since Q1 2024, but the detail paints a resilient underlying economic backdrop and comes ahead of fresh fiscal stimulus from the new Takaichi government. Today's GDP data should add some confidence, at the margins, the BOJ has in the GDP backdrop. We await Ueda's early Dec speech for details around hike timing.
- The data will likely bolster the Takaichi administration’s conviction that aggressive fiscal spending is needed to shore up the economy, with the premier expected to unveil her first economic package as soon as this week.
- The Finance Ministry is preparing an economic package of roughly ¥17tn, according to a Nikkei report published Saturday.
- Cash US tsys are flat to 1bp cheaper, with a steepening bias, in today's Asia-Pac session.
- Cash JGBs are flat to 2bps cheaper across benchmarks, with a steepening bias. The benchmark 10-year yield is 1.2bps higher at 1.722%, a fresh cycle high.
- Swap rates are 1-5bps higher.
Source: Bloomberg Finance LP
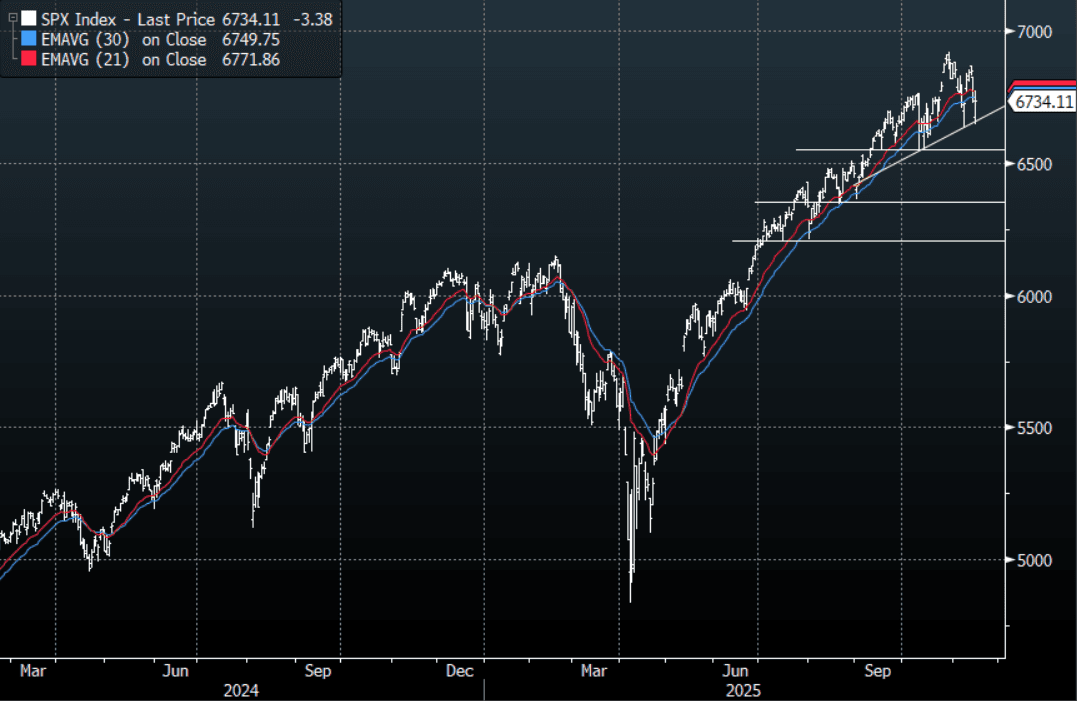
US STOCKS: S&P(ESZ5) - Bounces Off Support, Keeping Bullish Trend Intact
The S&P(ESZ5) overnight range was 6670.50 - 6795.50, SPX closed -0.05%, Asia is currently trading around 6760.00. The S&P looked to be rolling over again on Friday night down almost 1.5% before it found solid demand during the N/Y session and pared back all the day's losses. The market will be looking toward the release of some US data this week to get a gauge on things and also heavily focused on the upcoming Nvidia results which will heavily impact the direction of markets this week. The Crypto space which has been a leading indicator for risk has fallen to a low around $93 000 this morning and is technically starting to look vulnerable to a deeper correction. This morning stocks opened a little higher, E-minis(S&P) +0.05%, NQZ5 +0.10%. Technically the S&P has put in a lower high on the Daily chart and this could be signaling a deeper potential pullback, but a break below the support between 6550-6600 will be needed first to confirm a break of the bullish trend.
Fig 1: S&P 500 Index Daily Chart
Source: MNI - Market News/Bloomberg Finance L.P
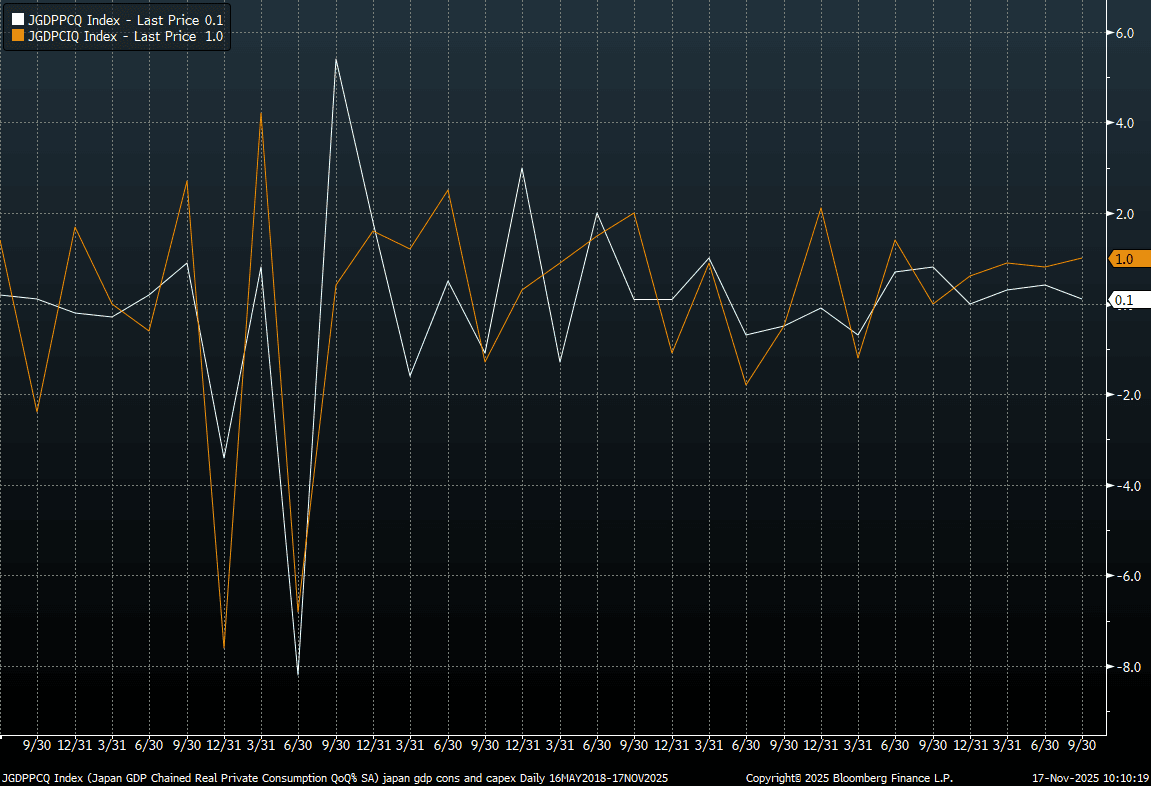
JAPAN DATA: Q3 GDP Contracts, But Resilient Detail, Particularly Business Spend
Q3 GDP (preliminary) in Japan was negative q/q, but not as much as the market forecast, thanks to upbeat business spending (+1.0%q/q versus -0.1% forecast). This was the first GDP decline since Q1 2024, but the detail paints a resilient underlying economic backdrop and comes ahead of fresh fiscal stimulus from the new Takaichi government. Today's GDP data should add some confidence, at the margins, the BOJ has in the GDP backdrop (particularly in terms of the drivers). We await Ueda's early Dec speech for details around hike timing.
- The q/q outcome for GDP was -0.4% against a -0.6% forecast. Note Q2 growth was revised to +0.6% from 0.5% originally reported. In annualized terms, growth -1.8%q/q, versus -2.4% forecast and a revised 2.3% gain in Q2. Note business s[ending was also revised up in Q2 to 0.8% from 0.6%q/q. Other components of GDP were close to forecasts, consumption up 0.1%q/q, while inventories were a -0.2ppt drag and net exports also trimmed -0.2ppt off growth.
- Whilst this is just a preliminary GDP print, the detail should be welcomed by the authorities. The q/q trends for private consumption (the white line) and business spending are plotted in the chart below.
- The resilience to strength in business spending, in particular, will be welcome. Via our Tokyo policy team: Private consumption and capital investment, the major components of the economy, are likely to firm in or after the fourth quarter, the official said. Private consumption, particularly non-durable goods, was hit by high prices and scorching weather in Q3, but is undergoing a moderate recovery supported by improving consumer sentiment, the official added.
- This also comes ahead of fresh fiscal stimulus, via BBG: "The Finance Ministry plans an economic package worth about ¥17 trillion ($110 billion), the Nikkei reported on Saturday, without identifying its sources. The supplementary budget to fund the spending is expected to reach about ¥14 trillion, exceeding last year’s ¥13.9 trillion compiled under former Prime Minister Shigeru Ishiba, the report said." - BBG
Fig 1: Japan GDP Components, Q/Q (Consumption (White Line) & Business Spending (Orange Line)
Source: Bloomberg Finance L.P./MNI