LOOK AHEAD: Economic Data Calendar 07/10/2025
| Date | GMT/Local | Period | Country | Release | Prior | Consensus | |
| 07/10/2025 | 1700/1300 | Oct | Bid to Cover Ratio | -- | -- | ||
| 07/10/2025 | 1900/1500 | Aug | Consumer Credit m/m | 16.0 | 14.0 | USD (b) | |
| 08/10/2025 | 2330/0830 | Aug | Base wages y/y | 2.5 | -- | % | |
| 08/10/2025 | 2330/0830 | Aug | Real wages y/y | -0.2 | -0.4 | % | |
| 08/10/2025 | 2330/0830 | Aug | Total wages y/y | 3.4 | 2.7 | % | |
| 08/10/2025 | 0100/1400 | Oct | RBNZ OCR | 3.0 | 2.75 | % | |
| 08/10/2025 | 0600/0800 | Aug | Industrial Production m/m SCA | 1.3 | -1.0 | % | |
| 08/10/2025 | 0600/0800 | Aug | Industrial Production m/m SCA (Revised Prior) | -- | -- | % | |
| 08/10/2025 | 0600/0800 | Aug | Industrial Production y/y CA | 1.5 | -0.9 | % | |
| 08/10/2025 | 0600/0800 | Aug | Industrial Production y/y CA (Revised Prior) | -- | -- | % | |
| 08/10/2025 | 0600/0800 | Sep | CPIF Flash y/y (1dp) | 3.2 | 3.2 | % | |
| 08/10/2025 | 0600/0800 | Sep | CPIF Flash y/y (2dp) | 3.25 | -- | % | |
| 08/10/2025 | 0600/0800 | Sep | CPIF-XE Flash ex. Energy y/y (2dp) | 2.92 | -- | % | |
| 08/10/2025 | 0600/0800 | Sep | CPIF Flash y/y (1dp) | 3.2 | 3.2 | % | |
| 08/10/2025 | 0600/0800 | Sep | CPIF Flash y/y (2dp) | 3.25 | -- | % | |
| 08/10/2025 | 0600/0800 | Sep | CPIF-XE Flash ex. Energy y/y (2dp) | 2.92 | -- | % | |
| 08/10/2025 | 0900/1000 | 10-Oct | Bid to Cover Ratio | -- | -- | ||
| 08/10/2025 | 1100/0700 | 03-Oct | MBA Mortgage Applications w/w | -12.7 | -- | % | |
| 08/10/2025 | 1430/1030 | 03-Oct | Crude Oil Domestic Production | 13505.0 | -- | bbl (k) | |
| 08/10/2025 | 1430/1030 | 03-Oct | Crude Oil Domestic Production w/w change | 4.0 | -- | bbl (k) | |
| 08/10/2025 | 1430/1030 | 03-Oct | Crude Oil Stock ex. SPR | 416546.0 | -- | bbl (k) | |
| 08/10/2025 | 1430/1030 | 03-Oct | Crude Oil Stocks ex. SPR w/w | 1.792 | -- | bbl (m) | |
| 08/10/2025 | 1430/1030 | 03-Oct | Cushing, Oklahoma Stocks | 23467.0 | -- | bbl (k) | |
| 08/10/2025 | 1430/1030 | 03-Oct | Cushing, Oklahoma Stocks w/w change | -271.0 | -- | bbl (k) | |
| 08/10/2025 | 1430/1030 | 03-Oct | Distillate Fuel Oil | 123577.0 | -- | bbl (k) | |
| 08/10/2025 | 1430/1030 | 03-Oct | Distillate Stocks w/w change | 0.578 | -- | bbl (m) | |
| 08/10/2025 | 1430/1030 | 03-Oct | Gasoline Stocks w/w change | 4.124 | -- | bbl (m) | |
| 08/10/2025 | 1430/1030 | 03-Oct | Refinery % Operable Utilization | 91.4 | -- | % | |
| 08/10/2025 | 1430/1030 | 03-Oct | Refinery % Operable Utilization change | -1.6 | -- | % | |
| 08/10/2025 | 1430/1030 | 03-Oct | Strategic Petroleum Reserve (SPR) | 406700.0 | -- | bbl (k) | |
| 08/10/2025 | 1430/1030 | 03-Oct | Strategic Petroleum Reserve (SPR) w/w change | 742.0 | -- | bbl (k) | |
| 08/10/2025 | 1430/1030 | 03-Oct | Total Motor Gasoline | 220694.0 | -- | bbl (k) | |
| 08/10/2025 | 1430/1030 | 04-Oct | Distillate Fuel Oil Products Supplied | 3617.0 | -- | bbl (k) | |
| 08/10/2025 | 1430/1030 | 04-Oct | Distillate Fuel Oil Products Supplied w/w change | -121.0 | -- | bbl (k) | |
| 08/10/2025 | 1430/1030 | 04-Oct | Finished Motor Gasoline Products Supplied | 8518.0 | -- | bbl (k) | |
| 08/10/2025 | 1430/1030 | 04-Oct | Finished Motor Gasoline Products Supplied w/w change | -440.0 | -- | bbl (k) | |
| 08/10/2025 | 1430/1030 | 04-Oct | Kerosene-Type Jet Fuel Products Supplied | 1740.0 | -- | bbl (k) | |
| 08/10/2025 | 1430/1030 | 04-Oct | Kerosene-Type Jet Fuel Products Supplied w/w change | 241.0 | -- | bbl (k) | |
| 08/10/2025 | 1430/1030 | 04-Oct | Other Oils Products Supplied | 5396.0 | -- | bbl (k) | |
| 08/10/2025 | 1430/1030 | 04-Oct | Other Oils Products Supplied w/w change | 72.0 | -- | bbl (k) | |
| 08/10/2025 | 1430/1030 | 04-Oct | Propane/Propylene Products Supplied | 534.0 | -- | bbl (k) | |
| 08/10/2025 | 1430/1030 | 04-Oct | Propane/Propylene Products Supplied w/w change | -361.0 | -- | bbl (k) | |
| 08/10/2025 | 1430/1030 | 04-Oct | Residual Fuel Oil Products Supplied | 362.0 | -- | bbl (k) | |
| 08/10/2025 | 1430/1030 | 04-Oct | Residual Fuel Oil Products Supplied w/w change | -17.0 | -- | bbl (k) | |
| 08/10/2025 | 1430/1030 | 04-Oct | Total Products Supplied | 20166.0 | -- | bbl (k) | |
| 08/10/2025 | 1430/1030 | 04-Oct | Total Products Supplied w/w change | -627.0 | -- | bbl (k) | |
| 08/10/2025 | 1700/1300 | Oct | Bid to Cover Ratio | -- | -- | ||
| 09/10/2025 | 0600/0800 | Aug | Trade balance exports m/m | -0.6 | 0.2 | % | |
| 09/10/2025 | 0600/0800 | Aug | Trade balance imports m/m | -0.1 | -0.5 | % | |
| 09/10/2025 | 0600/0800 | Aug | Trade balance m/m | 14.7 | 15.0 | E (b) | |
| 09/10/2025 | 1230/0830 | 04-Oct | Continuing Claims | -- | 1925.0 | (k) | |
| 09/10/2025 | 1230/0830 | 04-Oct | Initial Jobless Claims | -- | 228.0 | (k) | |
| 09/10/2025 | 1230/0830 | 04-Oct | Prev Continuing Claims, Rev | -- | -- | (k) | |
| 09/10/2025 | 1230/0830 | 04-Oct | Prev Initial Jobless Claims, Rev | -- | -- | (k) | |
| 09/10/2025 | 1230/0830 | 02-Oct | Corn Net Sales | -- | -- | MT (k) | |
| 09/10/2025 | 1230/0830 | 02-Oct | Corn Weekly Exports | -- | -- | MT (k) | |
| 09/10/2025 | 1230/0830 | 02-Oct | Soy Net Sales | -- | -- | MT (k) | |
| 09/10/2025 | 1230/0830 | 02-Oct | Soy Weekly Exports | -- | -- | MT (k) | |
| 09/10/2025 | 1230/0830 | 02-Oct | Wheat Net Sales | -- | -- | MT (k) | |
| 09/10/2025 | 1230/0830 | 02-Oct | Wheat Weekly Exports | -- | -- | MT (k) | |
| 09/10/2025 | 1400/1000 | Aug | Wholesale Inventories m/m | 0.1 | -0.2 | % | |
| 09/10/2025 | 1400/1000 | Aug | Wholesale Sales m/m | 1.4 | -- | % | |
| 09/10/2025 | 1400/1000 | Aug | Wholesale Inventories m/m | 0.1 | -0.2 | % | |
| 09/10/2025 | 1400/1000 | Aug | Wholesale Sales m/m | 1.4 | -- | % | |
| 09/10/2025 | 1430/1030 | 03-Oct | Natural Gas Stocks w/w | 53.0 | -- | Bcf | |
| 09/10/2025 | 1600/1200 | 15/16 | Corn Ending Stocks current year | 2110.0 | -- | (m) | |
| 09/10/2025 | 1600/1200 | 15/16 | Corn Production current year | 16814.0 | -- | (m) | |
| 09/10/2025 | 1600/1200 | 15/16 | Corn yield per acre current year | 186.7 | -- | ||
| 09/10/2025 | 1600/1200 | 15/16 | Cotton Ending Stocks current year | 3.6 | -- | (m) | |
| 09/10/2025 | 1600/1200 | 15/16 | Cotton Production current year | 13.22 | -- | (m) | |
| 09/10/2025 | 1600/1200 | 15/16 | Soybeans - Ending Stocks current year | 300.0 | -- | (m) | |
| 09/10/2025 | 1600/1200 | 15/16 | Soybeans Production current year | 4301.0 | -- | (m) | |
| 09/10/2025 | 1600/1200 | 15/16 | Soybeans yield per acre current year | 53.5 | -- | ||
| 09/10/2025 | 1600/1200 | 15/16 | Wheat - Ending Stocks current year | 844.0 | -- | (m) | |
| 09/10/2025 | 1600/1200 | 15/16 | Wheat Production current year | 1927.0 | -- | (m) | |
| 09/10/2025 | 1700/1300 | Oct | Bid to Cover Ratio | -- | -- | ||
| 10/10/2025 | 0600/0800 | Sep | CPI Underlying m/m | -0.7 | -- | % | |
| 10/10/2025 | 0600/0800 | Sep | CPI Underlying y/y | 3.1 | 3.1 | % | |
| 10/10/2025 | 0600/0800 | Sep | CPI m/m | -0.6 | -- | % | |
| 10/10/2025 | 0600/0800 | Sep | CPI y/y | 3.5 | 3.5 | % | |
| 10/10/2025 | 0600/0800 | Sep | Private Sector Production m/m | -1.7 | -- | % | |
| 10/10/2025 | 0900/1100 | Aug | Industrial Production m/m | 0.4 | -0.4 | % | |
| 10/10/2025 | 0900/1100 | Aug | Industrial Production wda y/y | 0.9 | -- | % | |
| 10/10/2025 | 1230/0830 | Sep | Employment Change | -65.5 | 5.0 | (k) | |
| 10/10/2025 | 1230/0830 | Sep | Unemployment Rate | 7.1 | 7.2 | % | |
| 10/10/2025 | 1230/0830 | Sep | Employment Change | -65.5 | 5.0 | (k) | |
| 10/10/2025 | 1230/0830 | Sep | Unemployment Rate | 7.1 | 7.2 | % | |
| 10/10/2025 | 1400/1000 | Oct | U. Mich Consumer Expectations | 51.7 | 51.4 | ||
| 10/10/2025 | 1400/1000 | Oct | U. Mich Consumer Sentiment | 55.1 | 54.0 | ||
| 10/10/2025 | 1400/1000 | Oct | U. Mich Current Economic Conditions | 60.4 | 60.0 | ||
| 10/10/2025 | 1400/1000 | Oct | U. Michigan 1 Year Inflation | 4.7 | 4.7 | % | |
| 10/10/2025 | 1400/1000 | Oct | U. Michigan 5 Year Inflation | 3.7 | 3.7 | % | |
| 10/10/2025 | 1700/1300 | 10-Oct | Baker Hughes Canada Gas Rig Count | 69.0 | -- | ||
| 10/10/2025 | 1700/1300 | 10-Oct | Baker Hughes Canada Oil Rig Count | 129.0 | -- | ||
| 10/10/2025 | 1700/1300 | 10-Oct | Baker Hughes Canada Rig Count | 190.0 | -- | ||
| 10/10/2025 | 1700/1300 | 10-Oct | Baker Hughes US Gas Rig Count | 118.0 | -- | ||
| 10/10/2025 | 1700/1300 | 10-Oct | Baker Hughes US Oil Rig Count | 422.0 | -- | ||
| 10/10/2025 | 1700/1300 | 10-Oct | Baker Hughes US Rig Count | 549.0 | -- | ||
| 10/10/2025 | 1700/1300 | 10-Oct | Baker Hughes Canada Gas Rig Count | -- | -- | ||
| 10/10/2025 | 1700/1300 | 10-Oct | Baker Hughes Canada Oil Rig Count | -- | -- | ||
| 10/10/2025 | 1700/1300 | 10-Oct | Baker Hughes Canada Rig Count | -- | -- | ||
| 10/10/2025 | 1700/1300 | 10-Oct | Baker Hughes US Gas Rig Count | -- | -- | ||
| 10/10/2025 | 1700/1300 | 10-Oct | Baker Hughes US Oil Rig Count | -- | -- | ||
| 10/10/2025 | 1700/1300 | 10-Oct | Baker Hughes US Rig Count | -- | -- | ||
| 10/10/2025 | 1800/1400 | Sep | Treasury Budget Balance | -344.8 | -- | USD (b) | |
| 13/10/2025 | - | Sep | Exports y/y | -- | -- | % | |
| 13/10/2025 | - | Sep | Imports y/y | -- | -- | % | |
| 13/10/2025 | - | Sep | Trade Balance | -- | -- | USD (b) | |
| 13/10/2025 | - | Sep | M2 YTD y/y | -- | -- | % | |
| 13/10/2025 | - | Sep | New Loans | -- | -- | CNY (t) | |
| 13/10/2025 | - | Q3 | Social Financing | -- | -- | CNY (t) | |
| 14/10/2025 | 2301/0001 | Sep | BRC Like-for-Like Sales y/y | 2.9 | -- | % | |
| 14/10/2025 | 2301/0001 | Sep | BRC Total Sales y/y | 3.1 | -- | % | |
| 14/10/2025 | 0600/0700 | Aug | AWE (Regular Pay), 3mo av y/y% 2dp - Private Sector (revised prior) | -- | -- | % | |
| 14/10/2025 | 0600/0700 | Aug | AWE (Regular Pay), 3mo av y/y% 2dp - Public Sector (revised prior) | -- | -- | % | |
| 14/10/2025 | 0600/0700 | Aug | AWE (Regular Pay), 3mo av y/y% 2dp - Whole Economy (revised prior) | -- | -- | % | |
| 14/10/2025 | 0600/0700 | Aug | AWE (Regular Pay), monthly y/y% 2dp - Private Sector (revised prior) | -- | -- | % | |
| 14/10/2025 | 0600/0700 | Aug | AWE (Total Pay), 3mo av y/y% 2dp - Private Sector (revised prior) | -- | -- | % | |
| 14/10/2025 | 0600/0700 | Aug | AWE (Total Pay), 3mo av y/y% 2dp - Public Sector (revised prior) | -- | -- | % | |
| 14/10/2025 | 0600/0700 | Aug | AWE (Total Pay), 3mo av y/y% 2dp - Whole Economy (revised prior) | -- | -- | % | |
| 14/10/2025 | 0600/0700 | Aug | AWE: Private regular pay (3m y/y) | 4.66 | -- | % | |
| 14/10/2025 | 0600/0700 | Aug | AWE: Private regular pay (single month y/y) | 4.51 | -- | % | |
| 14/10/2025 | 0600/0700 | Aug | AWE: Private total pay (3m y/y) | 4.63 | -- | % | |
| 14/10/2025 | 0600/0700 | Aug | AWE: Public sector regular pay (3m y/y) | 5.56 | -- | % | |
| 14/10/2025 | 0600/0700 | Aug | AWE: Public sector total pay (3m y/y) | 5.08 | -- | % | |
| 14/10/2025 | 0600/0700 | Aug | AWE: Whole economy regular pay (3m y/y) | 4.83 | -- | % | |
| 14/10/2025 | 0600/0700 | Aug | AWE: Whole economy total pay (3m y/y) | 4.71 | -- | % | |
| 14/10/2025 | 0600/0700 | Aug | Economic Activity Rate (16-64 SA 2dp) - Prior | -- | -- | % | |
| 14/10/2025 | 0600/0700 | Aug | Economic Activity Rate (16-64) | 78.93 | -- | % | |
| 14/10/2025 | 0600/0700 | Aug | Employment 3-month change | 232.0 | -- | (k) | |
| 14/10/2025 | 0600/0700 | Aug | Employment Level Change (16+ SA thousands) - Prior | -- | -- | % | |
| 14/10/2025 | 0600/0700 | Aug | Employment Rate (16-64 SA 2dp) - Prior | -- | -- | % | |
| 14/10/2025 | 0600/0700 | Aug | Employment Rate (16-64) | 75.17 | -- | % | |
| 14/10/2025 | 0600/0700 | Aug | Unemployment Rate (16+ 1dp) | 4.7 | -- | % | |
| 14/10/2025 | 0600/0700 | Aug | Unemployment Rate (16+ 2dp) | 4.66 | -- | % | |
| 14/10/2025 | 0600/0700 | Aug | Unemployment Rate (16+ SA 1dp) - Prior | -- | -- | % | |
| 14/10/2025 | 0600/0700 | Aug | Unemployment Rate (16+ SA 2dp) - Prior | -- | -- | % | |
| 14/10/2025 | 0600/0700 | Aug | AWE (Regular Pay), 3mo av y/y% 2dp - Private Sector (revised prior) | -- | -- | % | |
| 14/10/2025 | 0600/0700 | Aug | AWE (Regular Pay), 3mo av y/y% 2dp - Public Sector (revised prior) | -- | -- | % | |
| 14/10/2025 | 0600/0700 | Aug | AWE (Regular Pay), 3mo av y/y% 2dp - Whole Economy (revised prior) | -- | -- | % | |
| 14/10/2025 | 0600/0700 | Aug | AWE (Regular Pay), monthly y/y% 2dp - Private Sector (revised prior) | -- | -- | % | |
| 14/10/2025 | 0600/0700 | Aug | AWE (Total Pay), 3mo av y/y% 2dp - Private Sector (revised prior) | -- | -- | % | |
| 14/10/2025 | 0600/0700 | Aug | AWE (Total Pay), 3mo av y/y% 2dp - Public Sector (revised prior) | -- | -- | % | |
| 14/10/2025 | 0600/0700 | Aug | AWE (Total Pay), 3mo av y/y% 2dp - Whole Economy (revised prior) | -- | -- | % | |
| 14/10/2025 | 0600/0700 | Aug | AWE: Private regular pay (3m y/y) | -- | -- | % | |
| 14/10/2025 | 0600/0700 | Aug | AWE: Private regular pay (single month y/y) | -- | -- | % | |
| 14/10/2025 | 0600/0700 | Aug | AWE: Private total pay (3m y/y) | -- | -- | % | |
| 14/10/2025 | 0600/0700 | Aug | AWE: Public sector regular pay (3m y/y) | -- | -- | % | |
| 14/10/2025 | 0600/0700 | Aug | AWE: Public sector total pay (3m y/y) | -- | -- | % | |
| 14/10/2025 | 0600/0700 | Aug | AWE: Whole economy regular pay (3m y/y) | -- | -- | % | |
| 14/10/2025 | 0600/0700 | Aug | AWE: Whole economy total pay (3m y/y) | -- | -- | % | |
| 14/10/2025 | 0600/0700 | Aug | Economic Activity Rate (16-64 SA 2dp) - Prior | -- | -- | % | |
| 14/10/2025 | 0600/0700 | Aug | Economic Activity Rate (16-64) | -- | -- | % | |
| 14/10/2025 | 0600/0700 | Aug | Employment 3-month change | -- | -- | (k) | |
| 14/10/2025 | 0600/0700 | Aug | Employment Level Change (16+ SA thousands) - Prior | -- | -- | % | |
| 14/10/2025 | 0600/0700 | Aug | Employment Rate (16-64 SA 2dp) - Prior | -- | -- | % | |
| 14/10/2025 | 0600/0700 | Aug | Employment Rate (16-64) | -- | -- | % | |
| 14/10/2025 | 0600/0700 | Aug | Unemployment Rate (16+ 1dp) | -- | -- | % | |
| 14/10/2025 | 0600/0700 | Aug | Unemployment Rate (16+ 2dp) | -- | -- | % | |
| 14/10/2025 | 0600/0700 | Aug | Unemployment Rate (16+ SA 1dp) - Prior | -- | -- | % | |
| 14/10/2025 | 0600/0700 | Aug | Unemployment Rate (16+ SA 2dp) - Prior | -- | -- | % | |
| 14/10/2025 | 0600/0800 | Sep | CPI (f) m/m | -- | -- | % | |
| 14/10/2025 | 0600/0800 | Sep | CPI (f) y/y | -- | -- | % | |
| 14/10/2025 | 0600/0800 | Sep | HICP (f) m/m | -- | -- | % | |
| 14/10/2025 | 0600/0800 | Sep | HICP (f) y/y | -- | -- | % | |
| 14/10/2025 | 0600/0700 | Sep | Claimant Count Change | 17.4 | -- | (k) | |
| 14/10/2025 | 0600/0700 | Sep | Claimant Count Change - Prior Revised | -- | -- | (k) | |
| 14/10/2025 | 0600/0700 | Sep | Claimant Count Rate | 4.4 | -- | % | |
| 14/10/2025 | 0600/0700 | Sep | PAYE Median Monthly Pay (Y/Y) | 6.56 | -- | % | |
| 14/10/2025 | 0600/0700 | Sep | PAYE Median Monthly Pay (Y/Y) - Revised Prior | -- | -- | % | |
| 14/10/2025 | 0600/0700 | Sep | PAYE Payrolled Employees (SA Millions) - Revised Prior | -- | -- | (m) | |
| 14/10/2025 | 0600/0700 | Sep | PAYE Payrolled Employees (SA) | 30.3 | -- | (m) | |
| 14/10/2025 | 0600/0700 | Sep | PAYE Payrolled Employees 12-month change (SA Thousands) - Revised Prior | -- | -- | (k) | |
| 14/10/2025 | 0600/0700 | Sep | PAYE Payrolled Employees 12-month change (SA) | -129.3 | -- | (k) | |
| 14/10/2025 | 0600/0700 | Sep | PAYE Payrolled Employees 3-month change (SA Thousands) - Revised Prior | -- | -- | (k) | |
| 14/10/2025 | 0600/0700 | Sep | PAYE Payrolled Employees 3-month change (SA) | -38.0 | -- | (k) | |
| 14/10/2025 | 0600/0700 | Sep | PAYE Payrolled Employees 6-month change (SA Thousands) - Revised Prior | -- | -- | (k) | |
| 14/10/2025 | 0600/0700 | Sep | PAYE Payrolled Employees 6-month change (SA) | -- | -- | (k) | |
| 14/10/2025 | 0600/0700 | Sep | PAYE Payrolled Employees monthly change (SA Thousands) - Revised Prior | -- | -- | (k) | |
| 14/10/2025 | 0600/0700 | Sep | PAYE Payrolled Employees monthly change (SA) | -7.7 | -- | (k) | |
| 14/10/2025 | 0600/0700 | Sep | V/U Ratio | 0.43 | -- | ||
| 14/10/2025 | 0600/0700 | Sep | V/U Ratio (SA 2dp) - Revised Prior | -- | -- | ||
| 14/10/2025 | 0600/0700 | Sep | Vacancies | 728.0 | -- | (k) | |
| 14/10/2025 | 0600/0700 | Sep | Vacancies (SA thousands) - Revised Prior | -- | -- | (k) | |
| 14/10/2025 | 0600/0800 | Sep | CPI (f) m/m | -- | -- | % | |
| 14/10/2025 | 0600/0800 | Sep | CPI (f) y/y | -- | -- | % | |
| 14/10/2025 | 0600/0800 | Sep | HICP (f) m/m | -- | -- | % | |
| 14/10/2025 | 0600/0800 | Sep | HICP (f) y/y | -- | -- | % | |
| 14/10/2025 | 0900/1100 | Oct | ZEW Current Conditions Index | -- | -- | ||
| 14/10/2025 | 0900/1100 | Oct | ZEW Expectations Index | -- | -- | ||
| 14/10/2025 | 1000/0600 | Sep | NFIB Small Business Index | -- | -- | ||
| 14/10/2025 | 1230/0830 | Aug | Building Permits | -- | -- | % | |
| 14/10/2025 | 1255/0855 | 11-Oct | Redbook Retail Sales y/y (month) | -- | -- | % | |
| 14/10/2025 | 1255/0855 | 11-Oct | Redbook Retail Sales y/y (week) | -- | -- | % |
Want to read more?
Find more articles and bullets on these widgets:
Historical bullets
LOOK AHEAD: US Macro: PPI (Wed) and CPI (Thu) Inflation
US PPI inflation is released on Wednesday before CPI inflation on Thursday, an unusual ordering that should see core PCE implications dialled in after the CPI release rather than the usual wide range waiting for specific PPI details. PPI will be watched more closely than usual this month after a far stronger than expected jump in last month’s July report fired a warning short over tariff-based cost pressures starting to feed through. That included a 0.6% M/M increase in our preferred core series of PPI ex food, energy & trade services, which strips out items such as the then booming portfolio management & investment advice category following the strength in equity markets. It's too early to gauge an accurate sense of analyst expectations for August.
CPI inflation on Thursday will then be the last major release ahead of the Sep 17 FOMC decision. Consensus looks for core CPI at 0.3% M/M after the 0.32% M/M in July, another monthly increase comfortably above a pace consistent with 2% inflation. August should in theory start to see the largest tariff impacts along with September and possibly October. Returning to July’s report, core goods inflation was softer than expected, at a still solid (by core goods standards) 0.2% M/M for a second month running but about half that of 0.4% expected by analysts. Instead, non-housing core services surprised higher. The latter was a “dangerous” development in the words of a usually dovish Chicago Fed’s Goolsbee (’25 voter), who speaking after Friday’s payrolls report is still undecided on a September cut whilst looking for August inflation data “to get more information”.
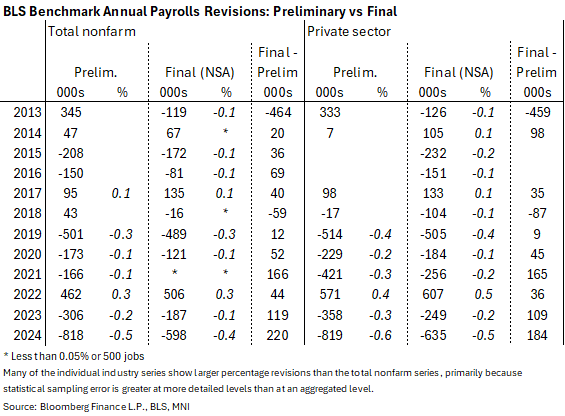
LOOK AHEAD: US Macro: Payrolls Preliminary Benchmark Revisions (Tue)
- The BLS on Tuesday will publish preliminary estimates of benchmark revisions, based off QCEW data for Q1.
- These will give an indication of the actual benchmark revisions on the Mar 2025 level of payrolls due with the Jan 2026 payrolls report released in early February.
- Bear in mind that the final benchmark estimate tends to nearly always be more negative than the preliminary figure – see historical values to the right.
- That doesn’t mean they can’t be large again after last year’s historically negative revision that lowered the level of payrolls by ~600k. Initial estimates we’ve seen look for another large downward revision, with the smallest being worth -550k but with wide ranges higher.
FED: Barclays Adds A Cut To 2025 Fed View
Barclays analysts now expect three Fed cuts in the remainder of the year, adding October to their pre-existing call for 25bp reductions in September and December. "Given the disappointing August employment report, we expect the FOMC to see more elevated downside risks to the employment side of the mandate."
- As for a 50bp September cut, "we think that the FOMC will view [that] as sending too strong a signal that labor market conditions are deteriorating. Indeed, we think that participants such as Powell understand that the slower pace of payroll employment reflects at least, in part, slower labor supply, which does not translate into increased labor market slack."
- For 2026 they continue to expect 25bp cuts in March and June to 3.00-3.25%, but "we do not think the FOMC will be able to cut rates more than twice next year, as we think that activity will show some slight acceleration, with the economy adapting to the new tariff environment and fiscal policy providing some support, and the unemployment rate will revert down amid limited increase in labor supply."