FED: Dot Count Could Come Down To The Wire
Beyond the usual uncertainty about the Fed's updated quarterly Dot Plot/economic projections, preparing for September's release has an additional tricky element since on the eve of the FOMC meeting we still don't know for sure how many submissions there will be.
- There's currently 18 FOMC members, with 1 vacancy after Gov Kugler's resignation after the July meeting. Board nominee Miran is on track to be confirmed to the Fed board in time for Tuesday's FOMC meeting start - a final vote on the Senate floor is likely to come on Monday evening and our assumption is he is on track to make it and get sworn in as a Governor by Chair Powell in time, but this is not a "sure thing".
- And the Trump administration is asking for the court to decide by Monday on whether to grant a "stay" on the decision earlier this week that allowed Gov Cook to remain in her job (and thus attend the September FOMC meeting) for now.
- We are assuming for the purposes of our Fed preview (out tomorrow) that we will get a full 19 "dot" submissions, including Cook and Miran, but it could be 18 or even 17 depending on events early next week.
- One or two missing won't necessarily shift median rate projections vs what they otherwise would have been. But it could be a close call on areas like the longer-run rate dot which in June had 3 participants on the current median of 3.00%, with 8 below and 8 above.
- Note that in addition to (possibly) the switching out of Kugler's dots for Miran's, June's projections included then-Philly Fed president Harker who has been replaced by Anna Paulson who will be submitting for the first time in September.
- Miran's participation would in all likelihood bring a more dovish skew to the prior dots, and he's a prime candidate to dissent in favor of a larger-than-25bp cut. Paulson is yet to speak on current monetary policy since her appointment.
Want to read more?
Find more articles and bullets on these widgets:
Historical bullets
AUDUSD TECHS: Consolidation Mode
- RES 4: 0.6700 76.4% retracement of the Sep 30 ‘24 - Apr 9 bear leg
- RES 3: 0.6688 High Nov 7 ‘24
- RES 2: 0.6677 0.764 proj of the Jun 23 - Jul 11 - 17 price swing
- RES 1: 0.6541/6625 High Aug 7 / 24 and the bull trigger
- PRICE: 0.6521 @ 16:04 BST Aug 12
- SUP 1: 0.6419 Low Aug 1
- SUP 2: 0.6373 Low Jun 23 and a bear trigger
- SUP 3: 0.6354 38.2% retracement of the Apr 9 - Jul 24 upleg
- SUP 4: 0.6323 Low Apr 16
AUDUSD rallied well off the week’s lowest levels last week on broad USD weakness - erasing any signs of a bearish breakout on the show through the 20- and 50-day EMAs. While support at 0.6455 the Jul 17 low, has been cleared, the recovery in prices keeps key resistance in focus at 0.6625 the Jul 24 high. It also represents the bull trigger. Any return lower would signal a bearish threat into 0.6373, the Jun 23 low.
EURJPY TECHS: Trend Structure Remains Bullish
- RES 4: 177.08 2.000 proj of the Feb 28 - Mar 18 - Apr 7 price swing
- RES 3: 175.43 High Jul 11 ‘24 and a key medium-term resistance
- RES 2: 174.86 1.764 proj of the Feb 28 - Mar 18 - Apr 7 price swing
- RES 1: 173.97 High Jul 28 and the bull trigger
- PRICE: 172.76 @ 16:03 BST Aug 12
- SUP 1: 169.73/45 Low Jul 31 / 23.6% of the Feb 28 - Jul 28 bull leg
- SUP 2: 169.71 50-day EMA
- SUP 3: 168.46 Low Jul 1
- SUP 4: 167.46 Low Jun 23
A bullish trend condition in EURJPY remains intact and for now the recent move down is considered corrective. Key support to watch lies at the 50-day EMA at 169.62. A clear break of the EMA is required to highlight a stronger short-term bearish threat. Moving average studies remain in a bull-mode position highlighting an uptrend. A break of the Jul 28 high of 173.97, would resume the bull cycle.
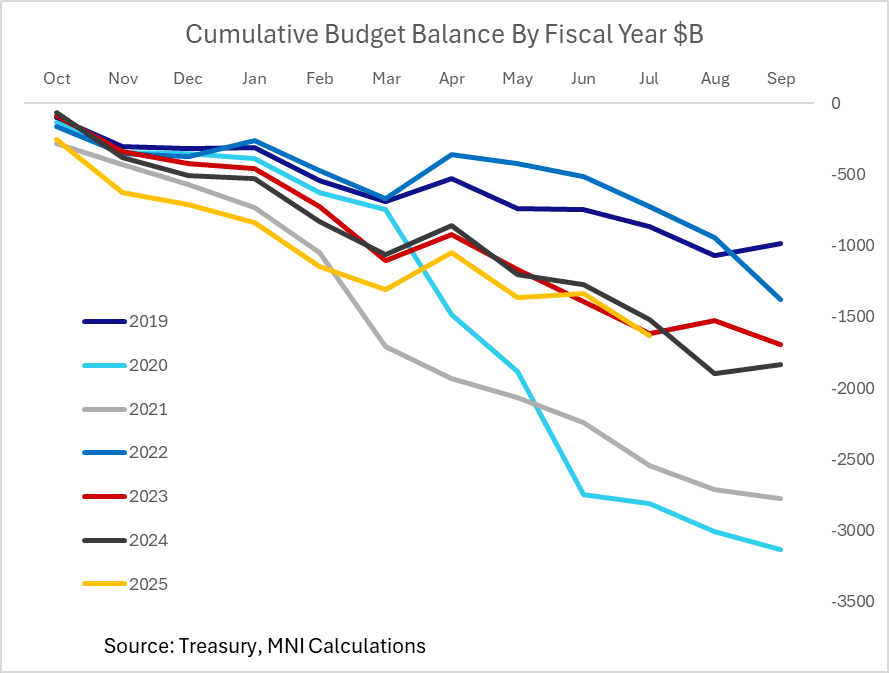
US FISCAL: Federal Deficit Up 7% Y/Y With 2 Months To Go In Fiscal Year
Treasury reported a $291.1B federal budget deficit in July, larger than the $239B shortfall expected by Bloomberg consensus but almost exactly in line with the Congressional Budget Office's previously published $289B estimate.
- As MNI noted previously, while the year-to-date deficit is up 7% Y/Y to $1.629T with two months remaining in the 2025 fiscal year (which runs Oct-Sep), compared with $1.517T in the same period of FY2024, the difference is smaller when adjusting for timing changes.
- CBO estimated a $37B wider deficit when accounting for these changes, vs $109B "actual". The implied adjusted rise in the deficit is around 2% Y/Y, tracking lower than nominal GDP growth over that period.
- YTD revenue is up 6.4% Y/Y ($4.346T), with expenditure up 6.7% ($5.975T).
- At the start of 2025, CBO estimated a $1.9T deficit this fiscal year which remains plausible with August typically seeing a large deficit ahead of a better outturn in September in part on tax receipts, though looks on the high side at this point.
- That implies the FY2025 deficit looks closer to coming in below the 6.4% of GDP posted in FY2024, though is widely expected to re-expand in FY2026 largely on "One Big Beautiful Bill" effects.
- CBO will publish the Monthly Budget Review with its final projection next month.