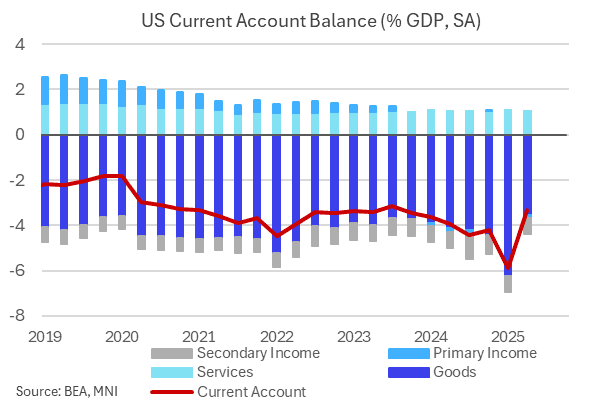
US DATA: Current Account Weighed By Trade Deficit, Weaker Net Investment Income
The US current account deficit was a little smaller than expected in Q2 2025, at $251B, vs $257B expected (prior revised to $440B from $450B - all figures rounded).
- This was the smallest deficit in nominal terms since Q4 2023, but comes after a record shortfall the prior quarter. The implied 3.3% of GDP deficit was the smallest since Q3 2023, after 5.9% in Q1. The swings were of course exaggerated primarily by tariff-related trade shifts, but when we average the two quarters out, the deficit comes out at $346B.
- That's wide by historical standards (the prior 8 quarters averaged $254B), with the difference again being the goods trade deficit of $368B on average the first half of the year ($284B 8-quarters prior average). The services trade surplus averaged $80B in H1, vs around $74B the prior 8 quarters, so a slight improvement there in line with the historical average, even as the primary and secondary income accounts showed slightly smaller deficits - see chart as % of GDP.
- We get August advance goods trade data on Thursday - it's expected to see a smaller deficit of $95B vs a surprisingly high $103B in July. Consensus for the current account sees a small narrowing over the coming quarters, from an average 4.6% of GDP in H1 to 4.0% by mid-2026.
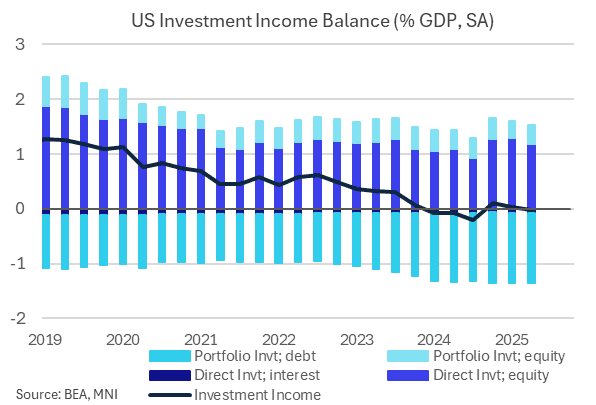
- One key to the current account outlook is portfolio income: as US yields have risen, the % of GDP paid out to the rest of the world has neared 2.0% (1.8% in the latest quarter) of GDP from 1.5% in 2022, while credits received have been static at 0.6%, reflecting the negative international portfolio investment position.
- While this has been offset by an improvement in net direct investment income, that widening in the portfolio category accounts for about 0.4-0.5pp of the current account deficit, and doesn't look likely to abate in the near future. The investment income balance used to represent a strong surplus for the US current account (+1% of GDP) but has been flat for the last couple of years.
Want to read more?
Find more articles and bullets on these widgets:
Historical bullets
FED: NatWest Now Sees Cuts In 2025, Starting In September
As with Deutsche earlier, NatWest has changed its Fed call after the Powell Jackson Hole speech to reflect a 25bp September cut. Previously, the call was for no cuts in 2025. The new baseline outlook includes further 25bp cuts in December and March, bringing rates closer to neutral ("however, the changing composition of the committee becomes far less clear once Powell term expires in May").
- "While the August jobs and CPI reports will be watched carefully, it is clear to us that Powell has already seen enough to decide renewed action to counter downside economic risks is likely warranted, and so we now look for a 25 basis point rate cut on September 17th.
- "We expect officials will very much downplay the likelihood of a 50bp rate cut leading up to the jobs data, but we have to admit if the report is "weak enough" (e.g., the unemployment rate increases by 0.3pct to 4.5% (where officials had it at year end) anything can happen and wouldn't rule anything out. However, given the latest pivot and with financial markets pricing (86% of a 25bp rate cut) a lot has to happen (unemployment rate 3-handle and core CPI +0.5%) for the FOMC to undeliver and hold off from a rate cut in September. "
USDCAD TECHS: Bull Cycle Hindered
- RES 4: 1.4111 High Apr 10
- RES 3: 1.4019 38.2% retracement of the Feb 3 - Jun 16 bear leg
- RES 2: 1.3968 High May 20
- RES 1: 1.3925 High Aug 22
- PRICE: 1.3840 @ 16:55 BST Aug 22
- SUP 1: 1.3794 20-day EMA
- SUP 2: 1.3769/22 50-day EMA / Low Aug 22
- SUP 3: 1.3576 Low Jul 23
- SUP 4: 1.3557/40 Low Jul 3 / Low Jun 16 and the bear trigger
Gains this week in USDCAD and the breach of resistance at 1.3879, the Aug 1 high, marked a positive development, however the slippage into the Friday close undermines this sentiment - for now. Moving average studies have crossed and are in a bull-mode position, reinforcing current conditions. An extension higher would signal scope for a climb towards 1.4019, a Fibonacci retracement. On the downside, support to watch lies at 1.3769, the 50-day EMA - a level not yet challenged by the correction lower.
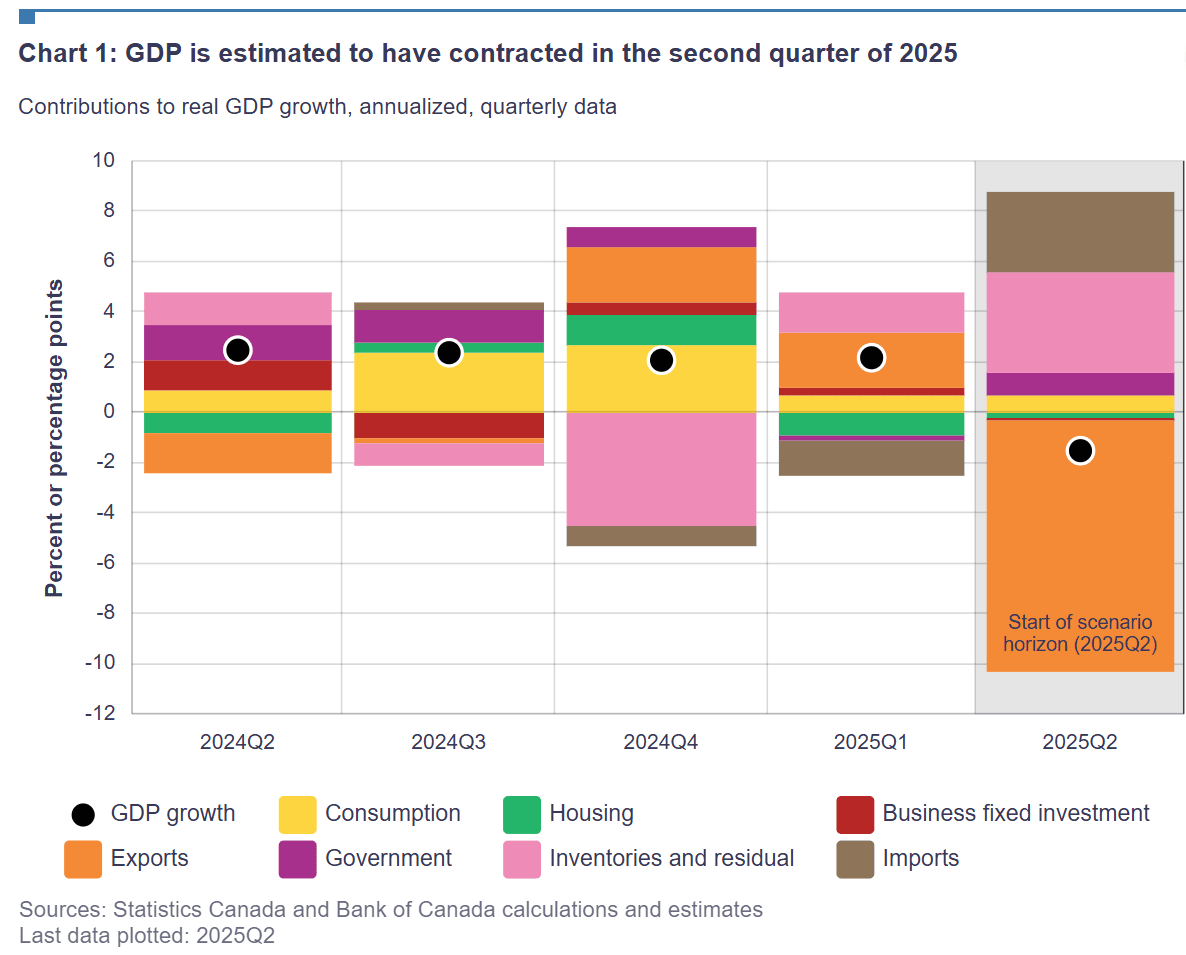
CANADA: Q2 Expected To See GDP Contraction, BOC's Estimate Looks Too Negative
The June retail sales release helps wrap up the last major data before Canadian Q2 GDP is released on Friday August 29.
- Current Bloomberg analyst consensus shows Q2 is expected to show a 0.7% Q/Q annualized contraction, versus +2.2% in Q1. The private sector consensus is more optimistic than the Bank of Canada's -1.5% estimate in its July Monetary Policy Report (which MNI thinks is too low) but the component-by-component breakdown is similar if of differing magnitudes.
- Widely expected are: a softening in household consumption growth (+1.2% in Q1), with a pickup in government spending, continued weakness in fixed investment (-3.0% in Q1) though with residential outperforming business capital formation, and a reversal of Q2's positive contribution from net exports. In short, the data are expected to confirm that trade activity was brought forward to Q1 ahead of tariffs, with the effects reversing in Q2.
- Going forward, the BOC envisages growth resuming in Q3 (+1.0% in its "current tariff" scenario). In the meantime, a weak Q2 reading could provide Governing Council with more conviction to resume easing rates in September, with the July meeting decision noting "If a weakening economy puts further downward pressure on inflation and the upward price pressures from the trade disruptions are contained, there may be a need for a reduction in the policy interest rate".